the Creative Commons Attribution 4.0 License.
the Creative Commons Attribution 4.0 License.
 | 07 Sep 2021
On the modeling of amplitude-sensitive electron spin resonance (ESR) detection using voltage-controlled oscillator (VCO)-based ESR-on-a-chip detectors
Anh Chu
Benedikt Schlecker
Michal Kern
Justin L. Goodsell
Alexander Angerhofer
Klaus Lips
Jens Anders
In this paper, we present an in-depth analysis of a voltage-controlled oscillator (VCO)-based sensing method for electron spin resonance (ESR) spectroscopy, which greatly simplifies the experimental setup compared to conventional detection schemes. In contrast to our previous oscillator-based ESR detectors, where the ESR signal was encoded in the oscillation frequency, in the amplitude-sensitive method, the ESR signal is sensed as a change of the oscillation amplitude of the VCO. Therefore, using VCO architecture with a built-in amplitude demodulation scheme, the experimental setup reduces to a single permanent magnet in combination with a few inexpensive electronic components. We present a theoretical analysis of the achievable limit of detection, which uses perturbation-theory-based VCO modeling for the signal and applies a stochastic averaging approach to obtain a closed-form expression for the noise floor. Additionally, the paper also introduces a numerical model suitable for simulating oscillator-based ESR experiments in a conventional circuit simulator environment. This model can be used to optimize sensor performance early on in the design phase. Finally, all presented models are verified against measured results from a prototype VCO operating at 14 GHz inside a 0.5 T magnetic field.
- Article
(3459 KB) - Full-text XML
- BibTeX
- EndNote


Electron spin resonance (ESR) is a very powerful spectroscopic method which is used extensively in a large variety of disciplines including chemistry, material science and the life sciences (Twahir et al., 2015, 2016; Azarkh et al., 2013; Qi et al., 2014; Qin and Warncke, 2015; Fehr et al., 2011, 2012). At its basis, ESR spectroscopy uses the spin of an electron as a very sensitive nanoscopic probe of its magnetic and electronic environment inside a molecule or a solid to provide important information which is often difficult to obtain using other spectroscopy techniques. Since ESR detects exclusively paramagnetic species, it is ideally suited for the detection of free radicals, which are related to premature cell aging (Kopani et al., 2006) and food degradation (Elias et al., 2009; Ottaviani et al., 2001), or for the detection of paramagnetic defects in semiconductor materials (Fehr et al., 2011). To overcome the problem of limited sensitivity in conventional ESR, miniaturized detectors have been suggested, which improve the achievable spin sensitivity thanks to their larger unitary magnetic field, Bu, and, in this way, room temperature spin sensitivities between 107 and 109 spins (G )−1 at various B0 field strengths have been reported in the literature (see Anders et al., 2012a; Twig et al., 2013; Gualco et al., 2014; Matheoud et al., 2017, 2018; Dayan et al., 2018; Abhyankar et al., 2020; Zhang and Niknejad, 2021). Apart from the poor sensitivity associated with inductive ESR detectors, conventional ESR setups also suffer from a relatively large complexity. As a partial solution to this problem, an oscillator-based ESR detection method was presented by Anders et al. (2012a) and Yalcin and Boero (2008) which detects the ESR effect by monitoring the sample-induced inductance variation as a change in the oscillation frequency. By using integrated LC tank oscillators, this approach removes the need for expensive external B1 field sources and also benefits from the great scaling potential of modern nanometer-scaled CMOS (complementary metal–oxide–semiconductor) technologies and their very high maximum operating frequencies. Exploiting these advantages and utilizing a 45 µm detection coil inside an LC tank oscillator operating around 146 GHz, the design presented by Matheoud et al. (2017) achieves a spin sensitivity of about 2×10⁷ spins (G )−1. The oscillator-based detection concept was then extended to the use of voltage-controlled oscillators (VCOs) by Handwerker et al. (2016), which allows for a great simplification of the experimental setup, thereby, for the first time, enabling the design of battery-operated, portable ESR spectrometers. Such portable ESR spectrometers can potentially have a very large impact on (emerging) disciplines such as the analysis of irradiated food (Chauhan et al., 2009), the study of wine oxidation (Elias et al., 2009), the prevention of the formation of free radicals in vegetable oils (Ottaviani et al., 2001), on-site radiation dosimetry (Romanyukha et al., 2014), point-of-care transcutaneous oxygen monitoring (Wolfson et al., 2014; Cristea et al., 2021) or measurements of skin antioxidant capability (Haag et al., 2011).
While in the reports by Anders et al. (2012a), Matheoud et al. (2017) and Yalcin and Boero (2008) only the frequency-sensitive detection option of an LC tank oscillator was discussed, a second mode of detection is available in oscillator-based ESR detectors because the oscillation amplitude is also affected by the ESR signal. This concept was originally published by Chu et al. (2018) using a CMOS LC-tank VCO and by Matheoud et al. (2018) using a high-electron-mobility-transistor-based LC Colpitts oscillator. In both of those reports, amplitude-sensitive detection is mentioned beside frequency-sensitive detection, and sensitivity calculations are performed only for the latter. In this paper, we will extend the state of the art by providing both analytical and numerical models for the amplitude-sensitive detection mode. Using our analysis, we show that the amplitude and frequency-sensitive detection modes display the same theoretically achievable spin sensitivity but with the potential for a simplified experimental setup for the amplitude-sensitive detection mode. These simplifications can, in turn, be used for further reductions in the size and cost of future generations of portable ESR spectrometers.
The paper is organized as follows. In Sect. 2, we will explain the experimental setup of an amplitude-sensitive VCO-based ESR experiment. In Sects. 3 and 4 we then derive analytical expressions for the ESR-induced amplitude variations in an LC tank oscillator before we also provide analytical expressions for the amplitude noise of LC tank VCOs in Sect. 5 to estimate the achievable limit of detection (LOD) in Sect. 6. Next, in Sect. 7 we provide a model suitable for simulating ESR spectroscopy experiments in conventional circuit simulators. Then, in Sects. 8 and 9, we compare the analytical model against these circuit simulations and validate all models using measured results from a VCO prototype operating around 14 GHz in a 0.5 T magnetic field. The paper is concluded with a short discussion and an outlook for future work in Sect. 10.
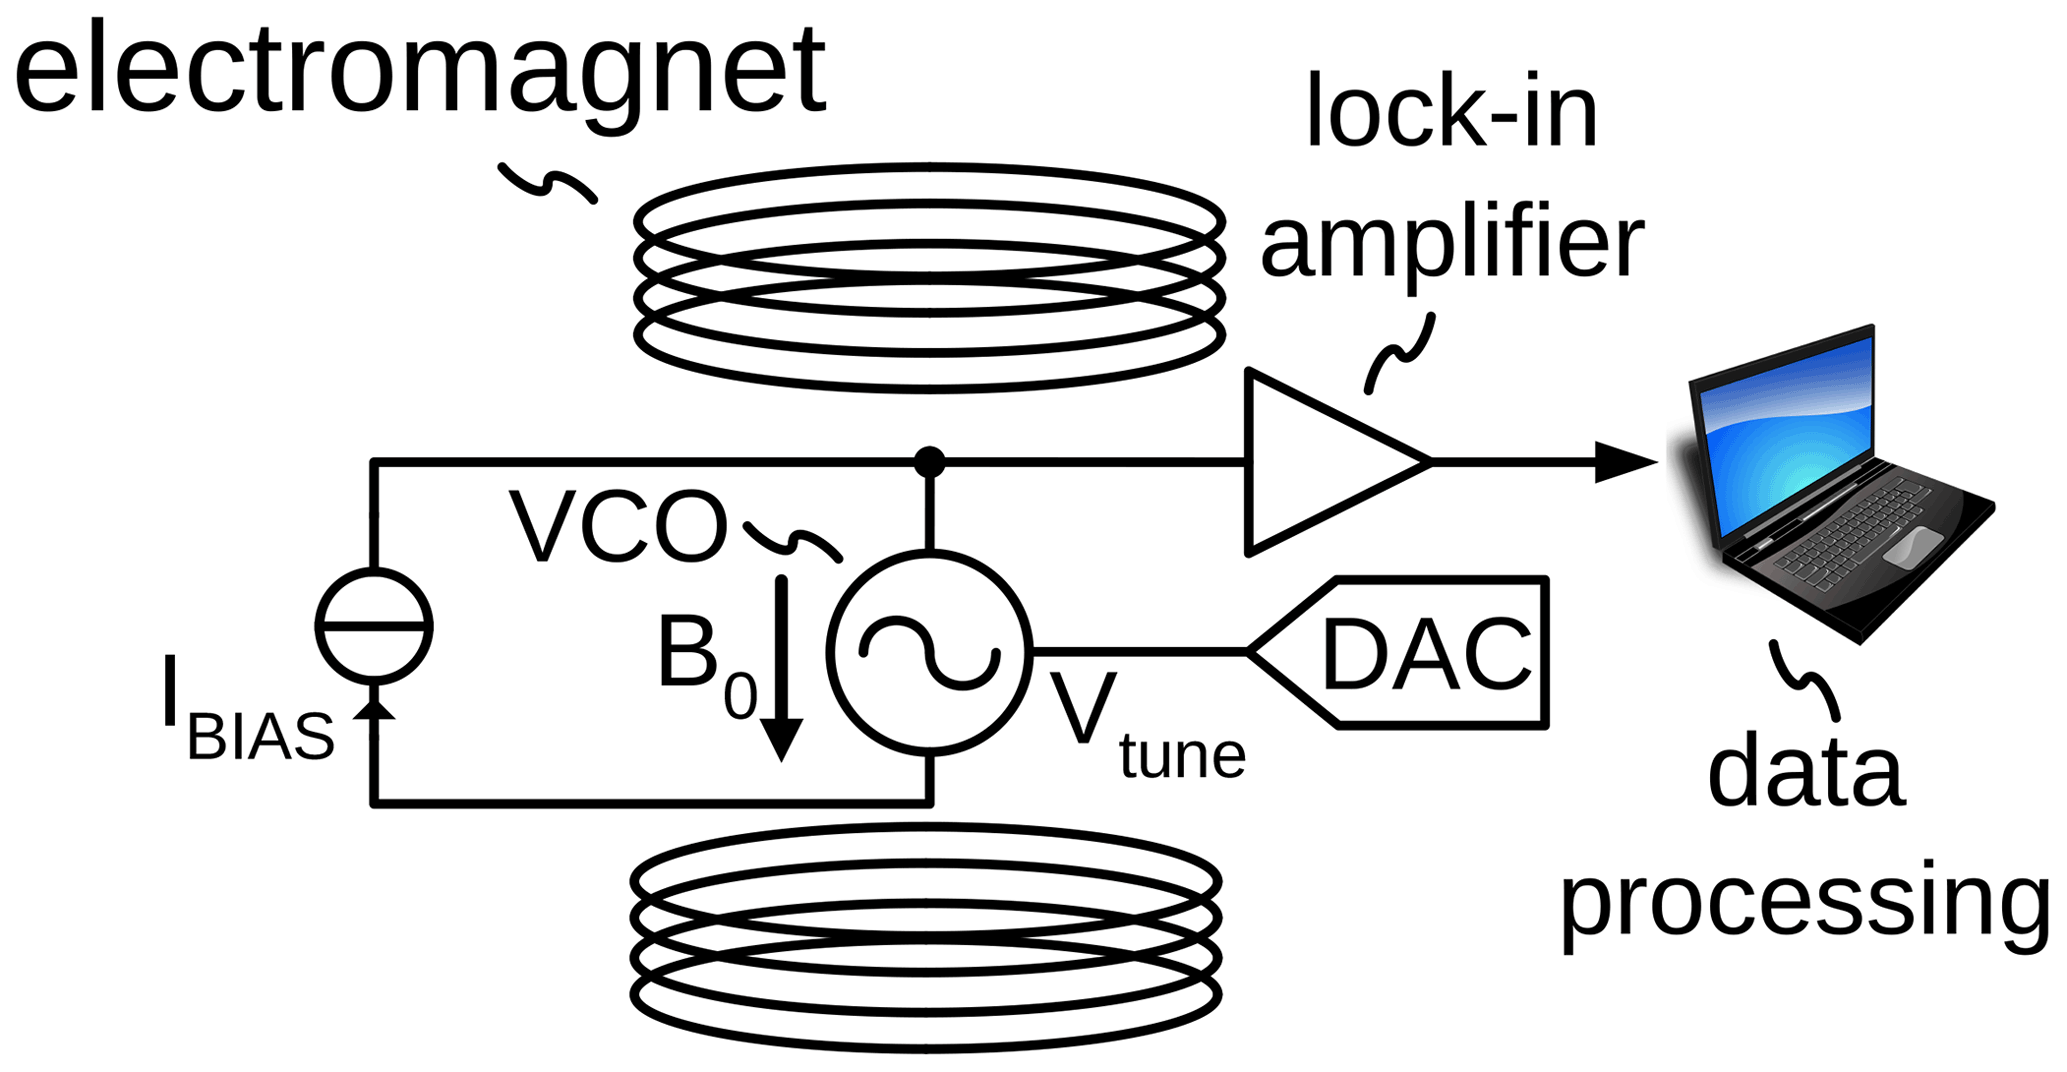
A conventional setup for ESR experiments is shown in Fig. 1a. The ESR sample is placed inside a microwave resonator, which is situated inside a variable field magnet. An ESR experiment is performed by irradiating the sample with microwaves at a constant frequency through a circulator and monitoring the reflected power. The external magnetic field B0 is swept through the resonance condition. In order to improve the achievable sensitivity, frequently lock-in detection is introduced by modulating the static magnetic field with an AC magnetic field with amplitude Bm using a pair of modulation coils. The building blocks highlighted in red in Fig. 1a are those that prevent a miniaturization of the experimental setup (electromagnet), an energy efficient operation (electromagnet and modulation coils) and an integration into CMOS technology of the spectrometer electronics (circulator). In contrast, in the amplitude-sensitive detection scheme incorporating VCOs shown in Fig. 1b, all required electronic components can be easily integrated into CMOS technology, and the power-hungry and bulky electromagnet is replaced by a permanent magnet. The replacement of the variable field by a permanent magnet is possible because in the proposed setup, an ESR spectrum is recorded at a fixed static magnetic field B0 while sweeping the frequency of the excitation signal (i.e., the magnetic field produced by the coil of the integrated LC tank oscillator) in and out of resonance to induce the ESR transition. Using a VCO, this frequency sweep can conveniently be carried out by applying a voltage ramp to the VCO control voltage using a digital-to-analog converter (DAC). The VCO control voltage both defines the new excitation frequency and, at the same time, tunes the LC tank inside the VCO to this frequency. This is because, in a VCO, the oscillation frequency and the resonance frequency of the LC tank are identical at all times. This is in contrast to a conventional resonator-based scheme, in which the resonance frequency and the excitation frequency can be independently defined. Moreover, the same DAC output signal can be used to produce a frequency modulation at every sweep point, which allows the field modulation to be replaced using external modulation coils by a much more power-saving frequency modulation, with the same positive effect on the achievable signal-to-noise ratio (SNR) when using subsequent lock-in detection. At this point, it is important to note that the aforementioned simplifications of the experimental setup were already achieved using the frequency-sensitive VCO-based detection setup presented by Handwerker et al. (2016). However, the amplitude-sensitive ESR setup of Fig. 1b provides the additional advantage of an implicit demodulation of the ESR signal. More specifically, when using current biasing for the LC tank oscillator according to Fig. 2a, the voltage at the center tap of the differential tank inductor (node ![]() in the figure) contains a demodulated version of the oscillation amplitude (Kinget, 2006). This implicit AM demodulation feature of the VCO not only removes the necessity of an external AM demodulation block, but also minimizes the number of high-frequency components because the lock-in amplifier can directly be connected to the inductor center tap voltage; cf. Fig. 1b. This further simplifies the experimental setup compared to the frequency-sensitive detection used by Handwerker et al. (2016). In the approach of Handwerker et al. (2016), the VCO output signal first had to be processed by a chain of frequency dividers to allow for simplified analog-to-digital conversion and subsequent frequency demodulation by a digital phase-locked loop. In the proposed amplitude-sensitive ESR setup, an implicit AM demodulator inside the VCO is used, resulting in the very simple experimental setup of Fig. 1b.
in the figure) contains a demodulated version of the oscillation amplitude (Kinget, 2006). This implicit AM demodulation feature of the VCO not only removes the necessity of an external AM demodulation block, but also minimizes the number of high-frequency components because the lock-in amplifier can directly be connected to the inductor center tap voltage; cf. Fig. 1b. This further simplifies the experimental setup compared to the frequency-sensitive detection used by Handwerker et al. (2016). In the approach of Handwerker et al. (2016), the VCO output signal first had to be processed by a chain of frequency dividers to allow for simplified analog-to-digital conversion and subsequent frequency demodulation by a digital phase-locked loop. In the proposed amplitude-sensitive ESR setup, an implicit AM demodulator inside the VCO is used, resulting in the very simple experimental setup of Fig. 1b.
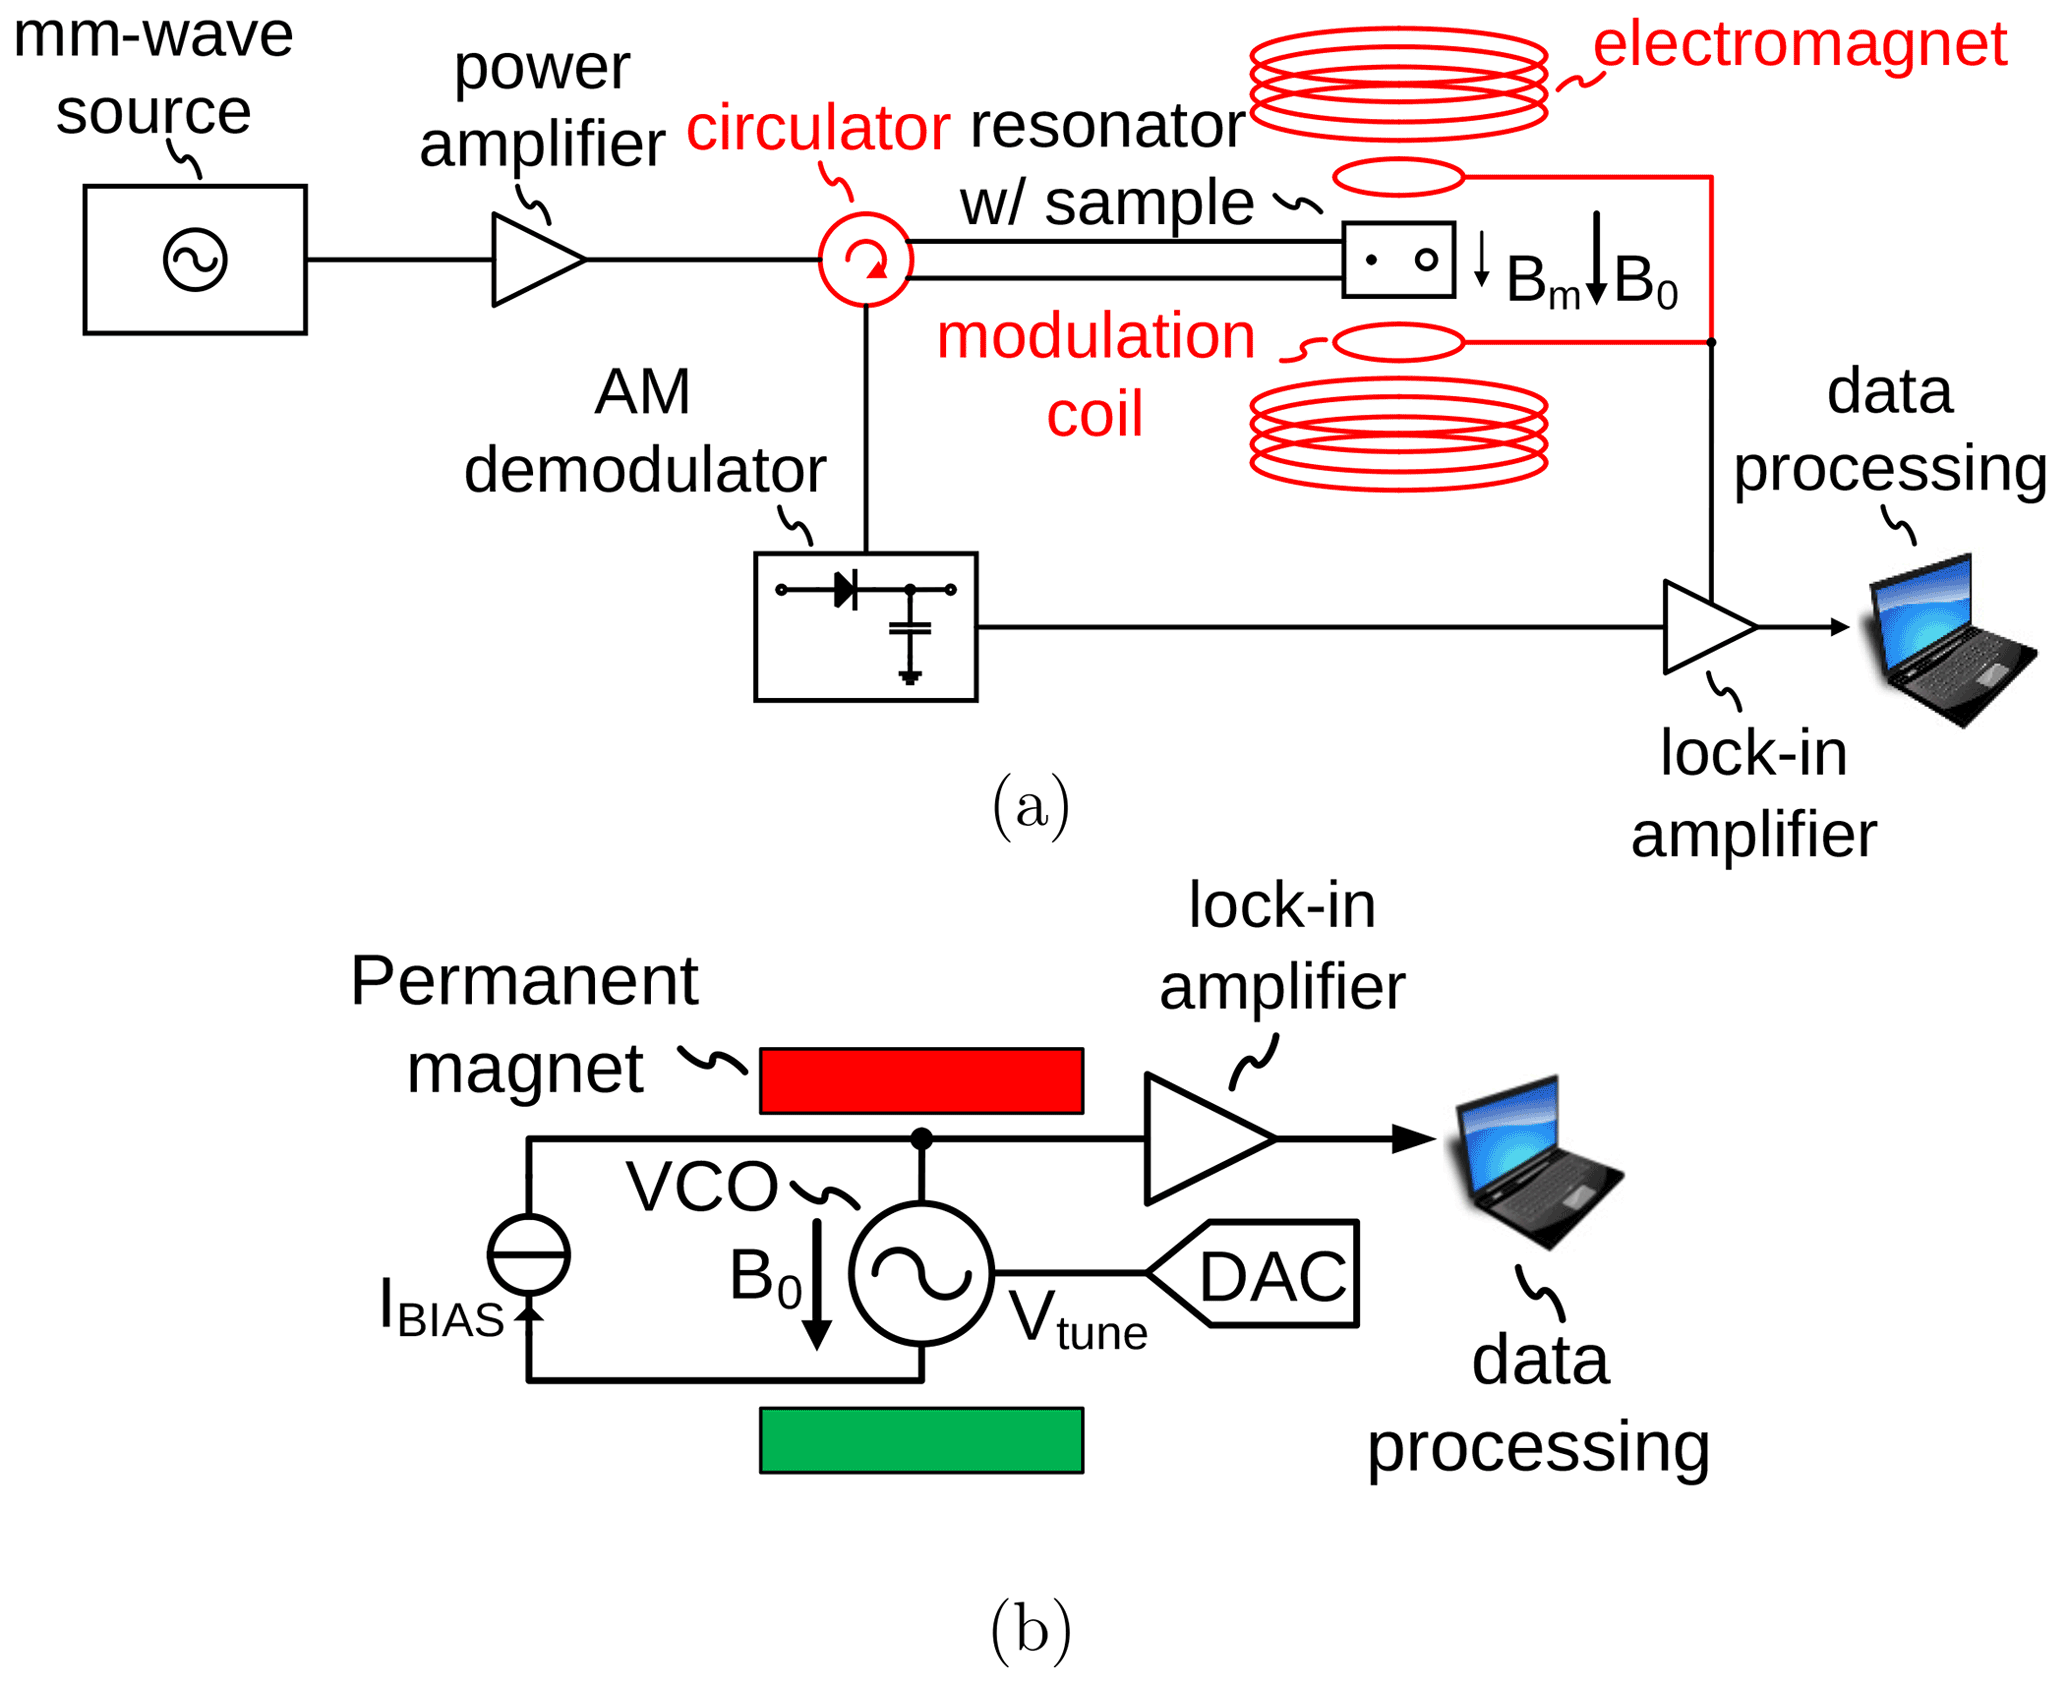
Figure 1(a) Conventional ESR detection setup and (b) proposed ESR detection scheme, which measures the ESR effect as a change in the oscillation amplitude of an integrated LC tank VCO.
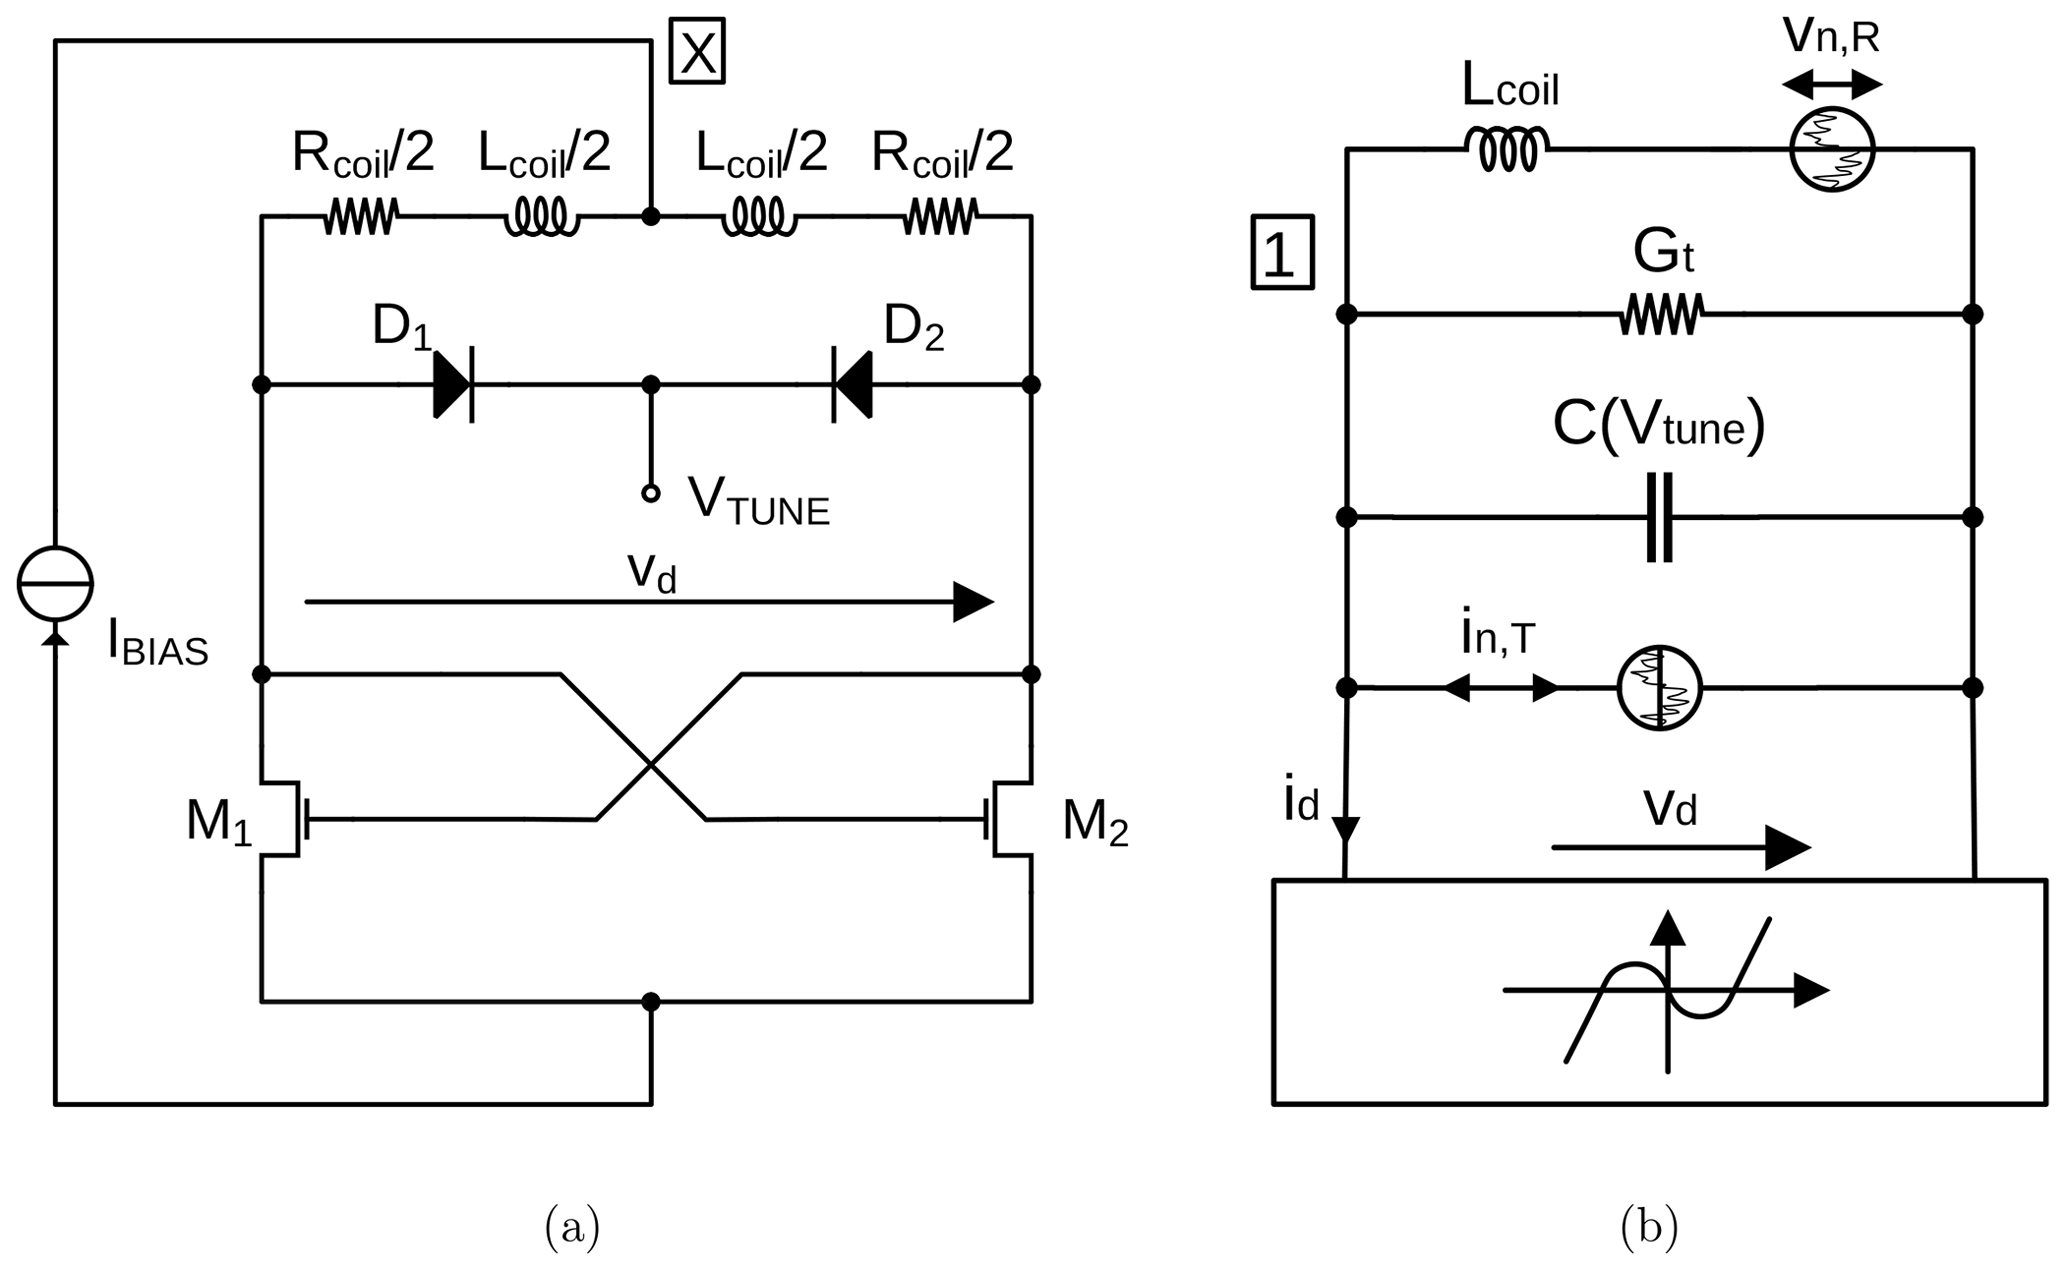
Figure 2(a) Schematic of the CMOS LC tank VCO and (b) equivalent circuit modeling the current starved cross-coupled transistor pair as a static third-order nonlinearity.
In order to be able to derive an analytical expression for the ESR-induced amplitude changes in the oscillation amplitude of an LC tank VCO according to Fig. 2a, we will first derive closed-form expressions for the oscillation amplitude and frequency. As the starting point for our analysis, we will use the equivalent electrical model of the schematic of Fig. 2a shown in Fig. 2b, where is the equivalent tank conductance, Qcoil is the coil quality factor, and vn,R and in,T are noise sources modeling the noise generated in the coil resistance and the cross-coupled transistor pair, respectively. For the following deterministic analysis, the noise source will be set to zero, and they will only be considered for the noisy case discussed in Sect. 5. To obtain an I/V characteristic of the static nonlinearity of Fig. 2b, which models the cross-coupled transistor pair, we have followed the approach proposed by Anders et al. (2012c), resulting in
where is the gate transconductance (Enz and Vittoz, 2006) of a single transistor in the cross-coupled differential pair for vd=0, n≈1.3 is the transistor slope factor (Enz and Vittoz, 2006) and IBIAS is the oscillator bias current. Then, using the differential tank voltage as the state variable x=vd and applying Kirchhoff's current law to node ![]() , we obtain the following ordinary differential equation describing the oscillator behavior:
, we obtain the following ordinary differential equation describing the oscillator behavior:
where , Gm0 is the gate transconductance and n≈1.3 the slope factor, Gt is the equivalent tank conductance, IBIAS is the bias current and is the resonance frequency of the LC tank. Starting from Eq. (2), we can use the so-called Lindstedt method (Jordan and Smith, 2007) to obtain first-order estimates of the oscillation amplitude and frequency according to
where is the overdrive parameter, which needs to be chosen to be greater than 1 to ensure stable oscillation, and all other parameters are defined as above.
As explained by Yalcin and Boero (2008), the effect of ESR on the spin ensemble can be modeled by means of a complex susceptibility according to
where , ωosc is the oscillation frequency and is the electron Larmor frequency (Schweiger and Jeschke, 2001), where γ and B0 are the gyromagnetic ratio of electrons1 and the applied static magnetic field strength, T1 and T2 are the longitudinal and transverse relaxation times, respectively, and χ0 is the static electron susceptibility. Using the complex susceptibility, the effective tank coil impedance in the presence of a resonant electron spin ensemble can be written as , where η is the so-called filling factor (Yalcin and Boero, 2008), which indicates how much of the sensitive coil volume is effectively filled by the ESR active material. Therefore, the effective coil inductance and coil resistance in the presence of ESR, Lχ and Rχ, can be written according to and , respectively, where Qcoil is the coil quality factor. In order to obtain the oscillation voltage and frequency including the effect of ESR, we can start from Eq. (3) and replace the original coil inductance and resistance (i.e., in the absence of ESR), Lcoil and Rcoil, by their effective values in the presence of ESR, i.e., Rχ and Lχ, respectively. Since in this paper, we are only interested in the ESR-induced amplitude changes, in the following, we will only consider the effect of ESR on the oscillation amplitude described by Eq. (3a), yielding
where Gt,χ is the equivalent tank conductance in the presence of ESR. The equivalent tank conductance depends on both the coil resistance Rcoil and – via the coil quality factor Qcoil – on the coil inductance Lcoil according to . Equation (5) can be rewritten accordingly as
Equation (6) can be further simplified by noting that the ESR-induced inductance changes are much smaller than the original coil inductance; that is, . Consequently, the term can be developed into a Taylor series in η around η=0, which can be stopped after the linear term, and Eq. (6) simplifies to
where we have neglected the quadratic term in η2, which originates from the product . To arrive at a closed-form expression for the ESR-induced amplitude changes, we can further develop the right-hand side of Eq. (7) into a first-order Taylors series in η around η=0. Then, the ESR-induced amplitude change can be written as
According to Eq. (8), the ESR-induced amplitude change depends on both the real part of the complex susceptibility, χ′, and its imaginary part, χ′′. However, for moderate coil quality factors with Qcoil≫1, the term Qcoilχ′′ largely dominates, and the ESR-induced amplitude changes mostly depend on the imaginary part of the complex susceptibility according to
Due to the great importance of timing uncertainties on the overall system of modern communication systems, oscillator phase noise is probably one of the most discussed topics in RF circuit theory, and a wide variety of models with different degrees of complexity exist in the literature, ranging from simple linear time-invariant to linear time-varying and more complicated nonlinear models (Kaertner, 1990; Hajimiri and Lee, 1998; Demir, 2002; Nallatamby et al., 2003; Magierowski and Zukotynski, 2004; Andreani et al., 2005; Sancho et al., 2007; Jahanbakht and Farzaneh, 2010; Murphy et al., 2010). One fundamental problem associated with oscillator noise modeling is related to the fact that an oscillator is a nonlinear system away from thermal equilibrium. This leads to a situation where even the most sophisticated models available today, which rely on modeling using stochastic differential equations (SDEs), can be considered as heuristics only. This is because the Langevin approach of introducing additional additive noise sources into the system in general fails for nonlinear dynamical systems, leading to physical inconsistencies (Thiessen and Mathis, 2010). Here, the problem essentially arises from the coupling between the different moments of the stochastic process described by the SDE, which results in a situation where the stochastically averaged SDE is in general not identical to the deterministic system to which the noise sources have been added. Therefore, due to the heuristic nature of even the most advanced models proposed in the literature, a validation against simulations and – even more importantly – against measured data is crucial. While for oscillator phase noise, such experimentally verified heuristic models exist, the field of oscillator amplitude noise is by far less explored, and there is only a very small set of papers which deal with this topic, typically as a side note without experimental verification (Magierowski and Zukotynski, 2004; Jahanbakht and Farzaneh, 2010). This is mostly because the oscillator amplitude noise is of negligible importance for the resulting timing uncertainty and is therefore neglected in analysis papers focusing on oscillator applications in RF systems. However, in sensor systems, which use the oscillator to measure a physical quantity as an amplitude change of the oscillator output voltage, the oscillator amplitude noise determines the achievable limit of detection, and its accurate modeling is of utmost importance. This includes the amplitude-sensitive ESR detection mode discussed in this paper but also eddy-current crack detection sensors for nondestructive testing (NDT) (García-Martín et al., 2011). Due to the lack of existing models on oscillator amplitude noise in the literature, in this section, we will present a model based on the stochastic averaging method proposed by Stratonovich (1963), which takes into account the nonlinearity of the oscillator but still produces a closed-form expression for the autocorrelation and power spectral density of the resulting amplitude noise process.
We have already applied the stochastic averaging method to an LC tank oscillator to obtain analytical expressions for the phase and frequency noise of such circuits and verified its accuracy using measured data (Anders et al., 2012b). Following the method outlined by Anders et al. (2012b) and Anders (2011), one can derive the following SDE governing the behavior of the amplitude noise, δA, of the current starved LC tank oscillator of Fig. 2:
where vn,R and in,T are the noise sources modeling the noise introduced by the coil resistance and the active cross-coupled transistor pair in Fig. 2. Then, introducing the stochastic process into Eq. (10), one obtains
Equation (11) defines a time-dependent Ornstein–Uhlenbeck process (Gardiner, 2009), and its solution, assuming a vanishing initial condition at , is therefore given by
Assuming that vn,R and in,T are Gaussian random processes with a zero mean, δA will also be Gaussian with a vanishing mean. Consequently, the autocorrelation of δA, RδAδA(t,τ), is sufficient to completely characterize the statistics of the amplitude noise. This autocorrelation is given by
where it was further assumed that the initial phase φ0 is a random variable uniformly distributed in the interval [0,2 π]. The double integral of Eq. (13) can be solved in closed form if one assumes that ξn is white, i.e., , using a variable transformation (see Stratonovich, 1963), according to and , yielding
where the noise scaling coefficient of the process ξn was calculated by Anders et al. (2012b) as
where k is Boltzmann's constant, T is absolute temperature and γnD is the thermal noise excess factor (Enz and Vittoz, 2006) of a MOSFET transistor with for a transistor in strong inversion and saturation. The corresponding power spectral density, which is centered around ωosc, is then given by
where , and ωc=λ is the resulting corner frequency.
In this section, the results from the previous two sections will be combined to obtain the limit of detection (LOD), i.e., the minimum number of spins detectable with an SNR of 3 in 1 s of measuring time, of an amplitude-sensitive VCO-based ESR detector. In order to make the results comparable with previously published resonator-based and frequency-sensitive oscillator-based ESR experiments, we will introduce the standard ESR terminology into the LOD expression. To this end, one can recast the result of Eq. (9) by noting that the oscillation amplitude and the B1 field, i.e., the magnetic field produced by the oscillation current in the tank inductor, are related according to , where Bu is the unitary magnetic field of the detection coil, Vdet is the sensitive detector volume and μ0 is the vacuum permeability2. Then, substituting Aosc,0 in Eq. (9) by the above expression, we find
where we have used the notation χ′′(Δω) to emphasize the fact that the imaginary part of the complex susceptibility is a function of the frequency offset between the oscillation frequency ωosc and the Larmor frequency of the electron spins at the static magnetic field strength B0. Using the analytical expression for the oscillator amplitude noise of Eq. (16) evaluated at Δω=0 and assuming a detection bandwidth (BW) of fBW, we can write the SNR of amplitude-sensitive ESR experiments as a function of both ωosc and B1 according to
To find the maximum SNR, we can substitute the imaginary part of the complex susceptibility by the term including saturation in Eq. (4b), then take the partial derivatives of Eq. (18) with respect to B1 and ωosc, equate them to zero and find the following optimum B1 field strength and oscillation frequency ωosc, respectively:
Substituting these values for B1 and ωosc into Eq. (18), we find the following expression for the maximally achievable SNR:
Since the longitudinal relaxation time T1 is always greater than or equal to half the transversal relaxation time T2, i.e., 2 T1≥T2, the SNR of Eq. (21) is maximized for 2 T1=T2. Using the optimum achievable SNR in Eq. (21), we can define the spin sensitivity Nmin according to
where Nspins is the number of spins in the sample that produces the optimum SNR, SNRopt, for a filling factor of η=1 with a detection bandwidth of fBW=1 Hz. Noting that the static electron susceptibility χ0 can be expressed as (Yalcin and Boero, 2008), where N is the spin density of the sample, ℏ is the reduced Planck constant, μ0 is the vacuum permeability, γ is the gyromagnetic ratio, k is Boltzmann's constant and T is absolute temperature, the theoretical spin sensitivity of the proposed amplitude-sensitive ESR detection method can be expressed as
Since the spin sensitivity given by Eq. (23) is identical to the one given by Yalcin and Boero (2008) (except for the factor which accounts for the different condition of T1=T2 used by Yalcin and Boero (2008) and the noise originating in the cross-coupled transistor pair which was not considered there), the theoretically achievable spin sensitivity of an LC tank oscillator is identical for the amplitude and the frequency-sensitive detection modes and also identical to that of a conventional resonator-based ESR detector.
To design CMOS VCO-based ESR detectors with optimum performance, it is important to be able to accurately simulate the achievable sensitivity including all transistor nonidealities. To this end, in this section, we will provide a model which is suitable for simulating the effect of ESR on the frequency and the amplitude of CMOS LC tank VCOs in conventional circuit simulators. The utilized model was first proposed by Boero (2000) in the context of conventional resonator-based nuclear magnetic resonance (NMR) experiments but can also be applied to continuous-wave VCO-based ESR experiments in the nonsaturated case, i.e., for (γ B1)2T1T2≪1, where the expressions for the complex magnetic susceptibility of Eq. (4) simplify to
Then, by comparing the impedance of a coil filled with spins, , whose susceptibility χ behaves according to Eq. (24) with that of the equivalent tank impedance Zeq of Fig. 3, one finds that the analytical and the circuit simulator model are equivalent if the following relations hold:
where it should be noted that according to the conventions used in this paper, γ is a negative number. According to Eq. (25), there are four parameters (Lspin, Cspin, Rspin and Kspin, with Kspin being the coupling coefficient between the tank inductor of the VCO and the LC resonator modeling the spins; see Fig. 3) which model the spin ensemble in the circuit of Fig. 3 but only three parameters in the physical model without saturation ( and ηχ0); therefore one parameter can be chosen at will. Here, one natural choice could be to choose Lspin=Lcoil, which always results in reasonable values for both Lspin and Cspin.
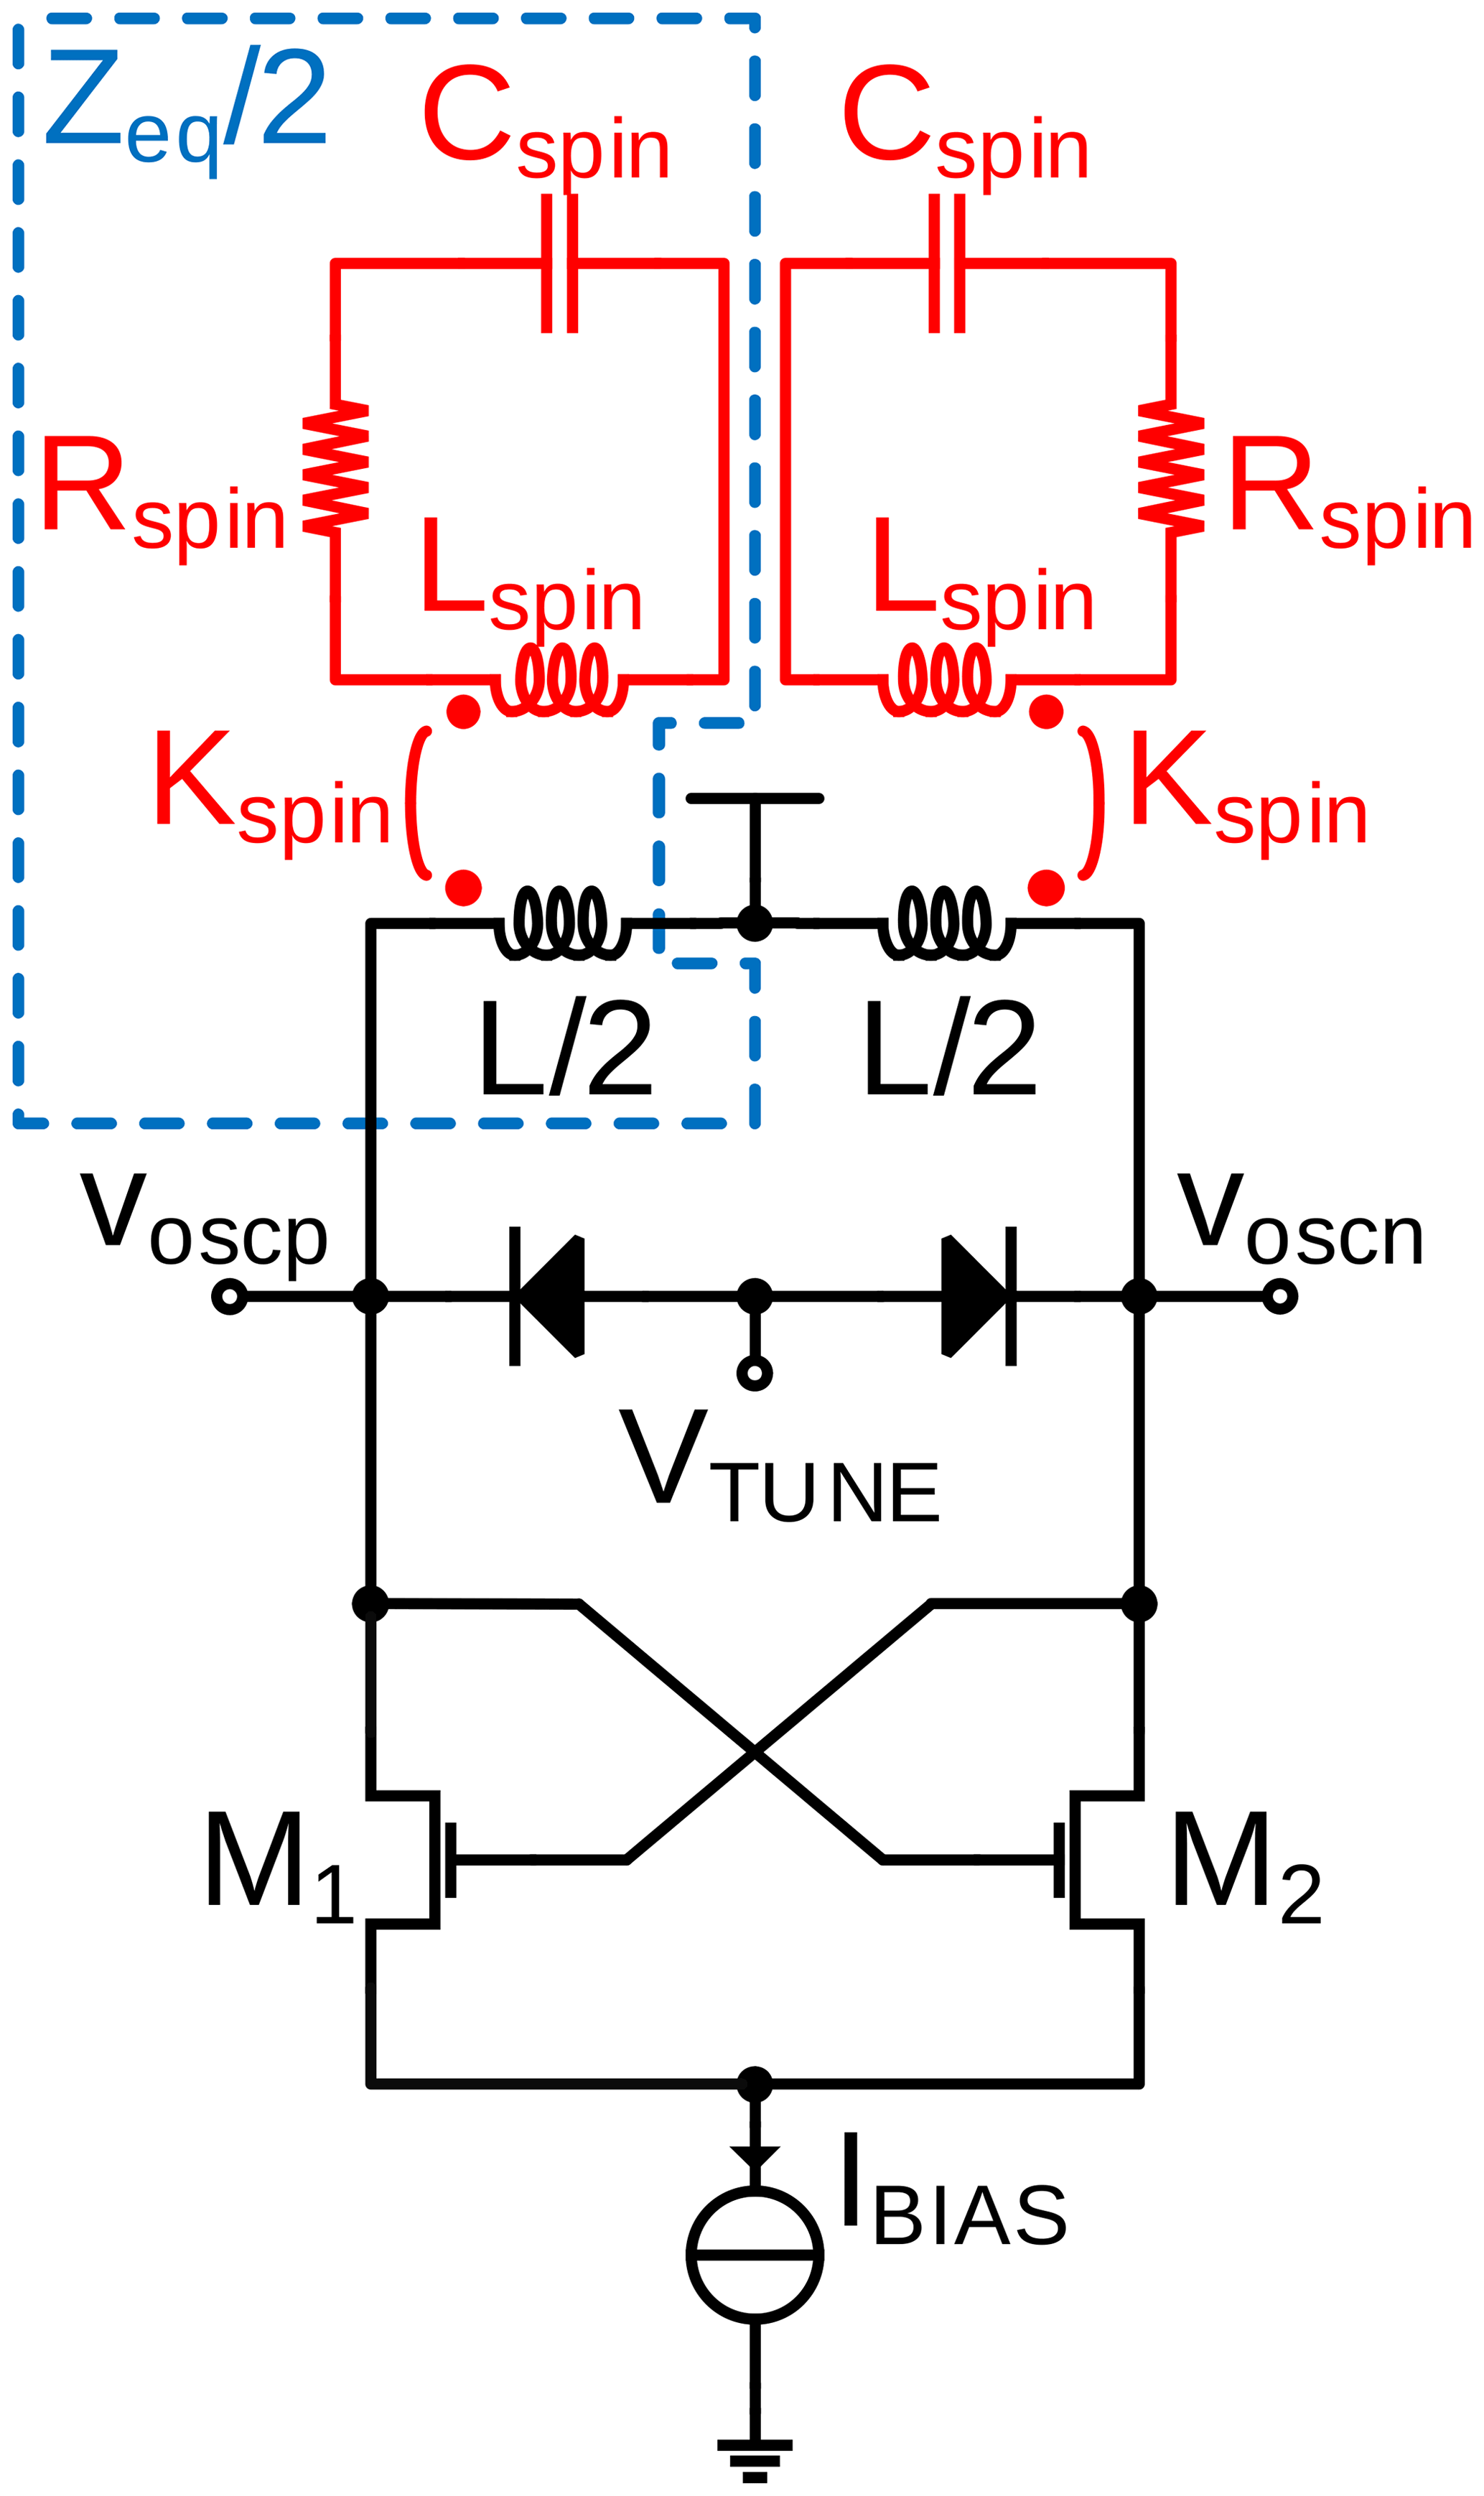
Figure 3Model suitable to simulate VCO-based continuous-wave ESR experiments in a conventional circuit simulator. The effect of the spin ensemble on the oscillator is modeled by an inductive coupling between an RLC circuit (model for the spin ensemble) that couples inductively into the tank inductance of the oscillator circuit, cf. circuitry inside the dashed blue line in the figure.
In this section, we will compare the analytical signal and noise models of Sects. 4 and 5 against circuit simulations performed with Keysight's GoldenGate simulator. Accounting for the periodic nature of the solutions, the CR harmonic balance solver was used, defining the static magnetic field B0 as a sweep variable to compute the field-sweep ESR spectrum numerically. To ensure a smooth transition between adjacent sweep points the corresponding flag was enabled in the CR analysis. The result of one such simulation is shown in Fig. 4. The corresponding simulation parameters are listed in the figure caption. These parameters correspond to the prototype realization discussed in Sect. 9. According to the figure, there is excellent agreement between the analytical model and the circuit simulation. As highlighted by the arrows in the figure, there is a small asymmetry in the line shape, which reflects the fact that the amplitude ESR signal is both sensitive to the real part of the complex susceptibility, which displays a dispersive behavior, and the imaginary part of the susceptibility with its absorption characteristic. However, since the imaginary part is amplified by the (unloaded) coil quality factor (see Eq. 8, Qcoil=10.2, for the simulation and the prototype of Sect. 9), the simulated ESR spectrum is mostly absorptive in nature with the small but visible asymmetry introduced by the real part of χ. Importantly, both the analytical model and the simulation accurately predict this behavior. The peak-to-peak amplitude of the spectrum is virtually unaffected by the real part of χ, justifying the simplified expression of Eq. (9), which was used to derive the LOD in Sect. 6.
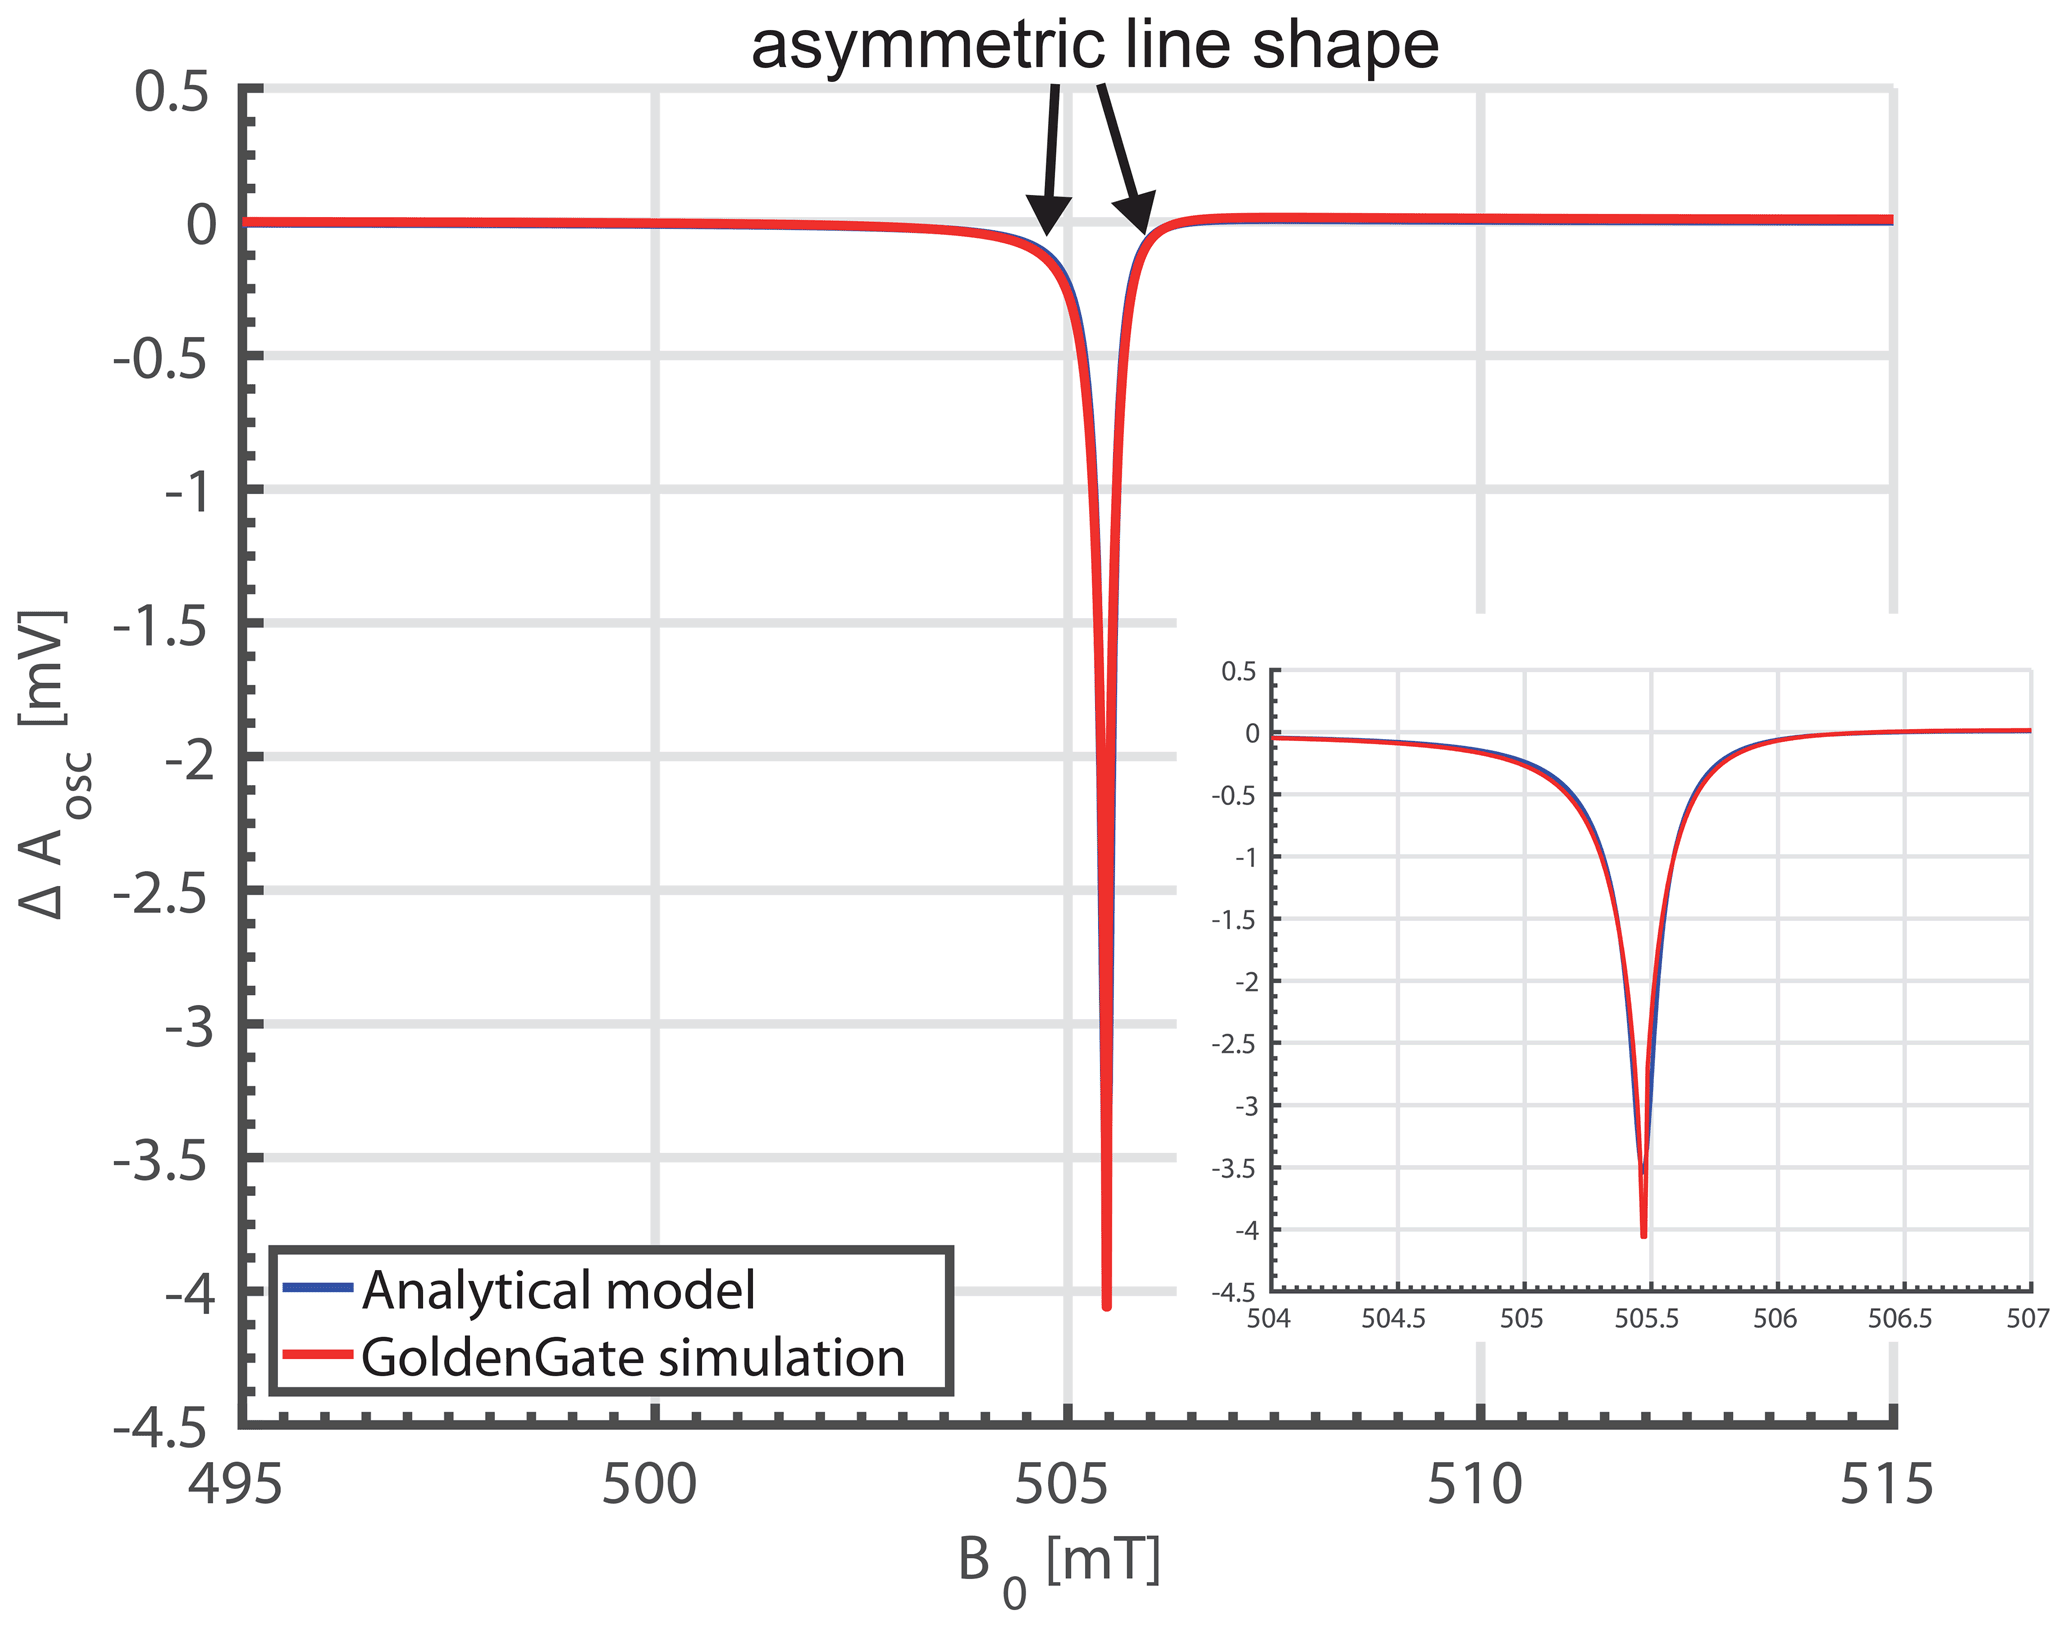
Figure 4Comparison of the proposed analytical model for the amplitude variation in amplitude-sensitive ESR and GoldenGate simulations. The corresponding simulation parameters are fosc=14.209 GHz, Lcoil=582.5 pH, Qcoil=10.2 and VTUNE=2.8 V, corresponding to C(VTUNE)=103 fF. Loading of the previous stage was accounted for by load capacitors of CL=75 fF to ground on both the positive and the negative oscillator output (AC coupled through 700 fF), transistor length L=120 nm, transistor width W=12 µm, 24 fingers, technology: GFUS 130 nm CMOS, IBIAS=1.75 mA, , T2=60 ns, Lspins=100 pH. Cspin and Rspin were automatically calculated for each sweep point from Eq. (25). Furthermore, the condition for a nonsaturated sample, i.e., (γ B1)2T1T2≪1, was ensured. Inset: an enlarged view of the amplitude dip in both models.
In order to validate the analytical noise model of Eq. (16), we have compared it against noise simulations performed using Keysight's GoldenGate simulator (CR analysis with noise enabled). Using the same simulation settings as for the simulations of Fig. 4 except for the bias current, which was varied as a parameter to analyze the range over which the proposed model is valid, we have obtained the results shown in Fig. 5. In the figure, the GoldenGate results are displayed as solid lines, and the corresponding analytical model data are displayed in the same color with dashed lines. According to the figure, there is good agreement between the proposed analytical model and the GoldenGate simulations in the white frequency noise region. Since Flicker noise was not taken into account in the model of Sect. 5, the analytical curves start to deviate from the GoldenGate simulations for lower offset frequencies, where the Flicker noise produced in the cross-coupled transistor pair starts to dominate. The corner frequency at which the white noise floor starts to roll off is predicted by the analytical model within a factor of approximately 2. For larger bias currents, the prediction of the white noise floor starts to deteriorate due to velocity saturation effects in the transistors, which are not taken into account in the simple square law model used to derive Eq. (1).
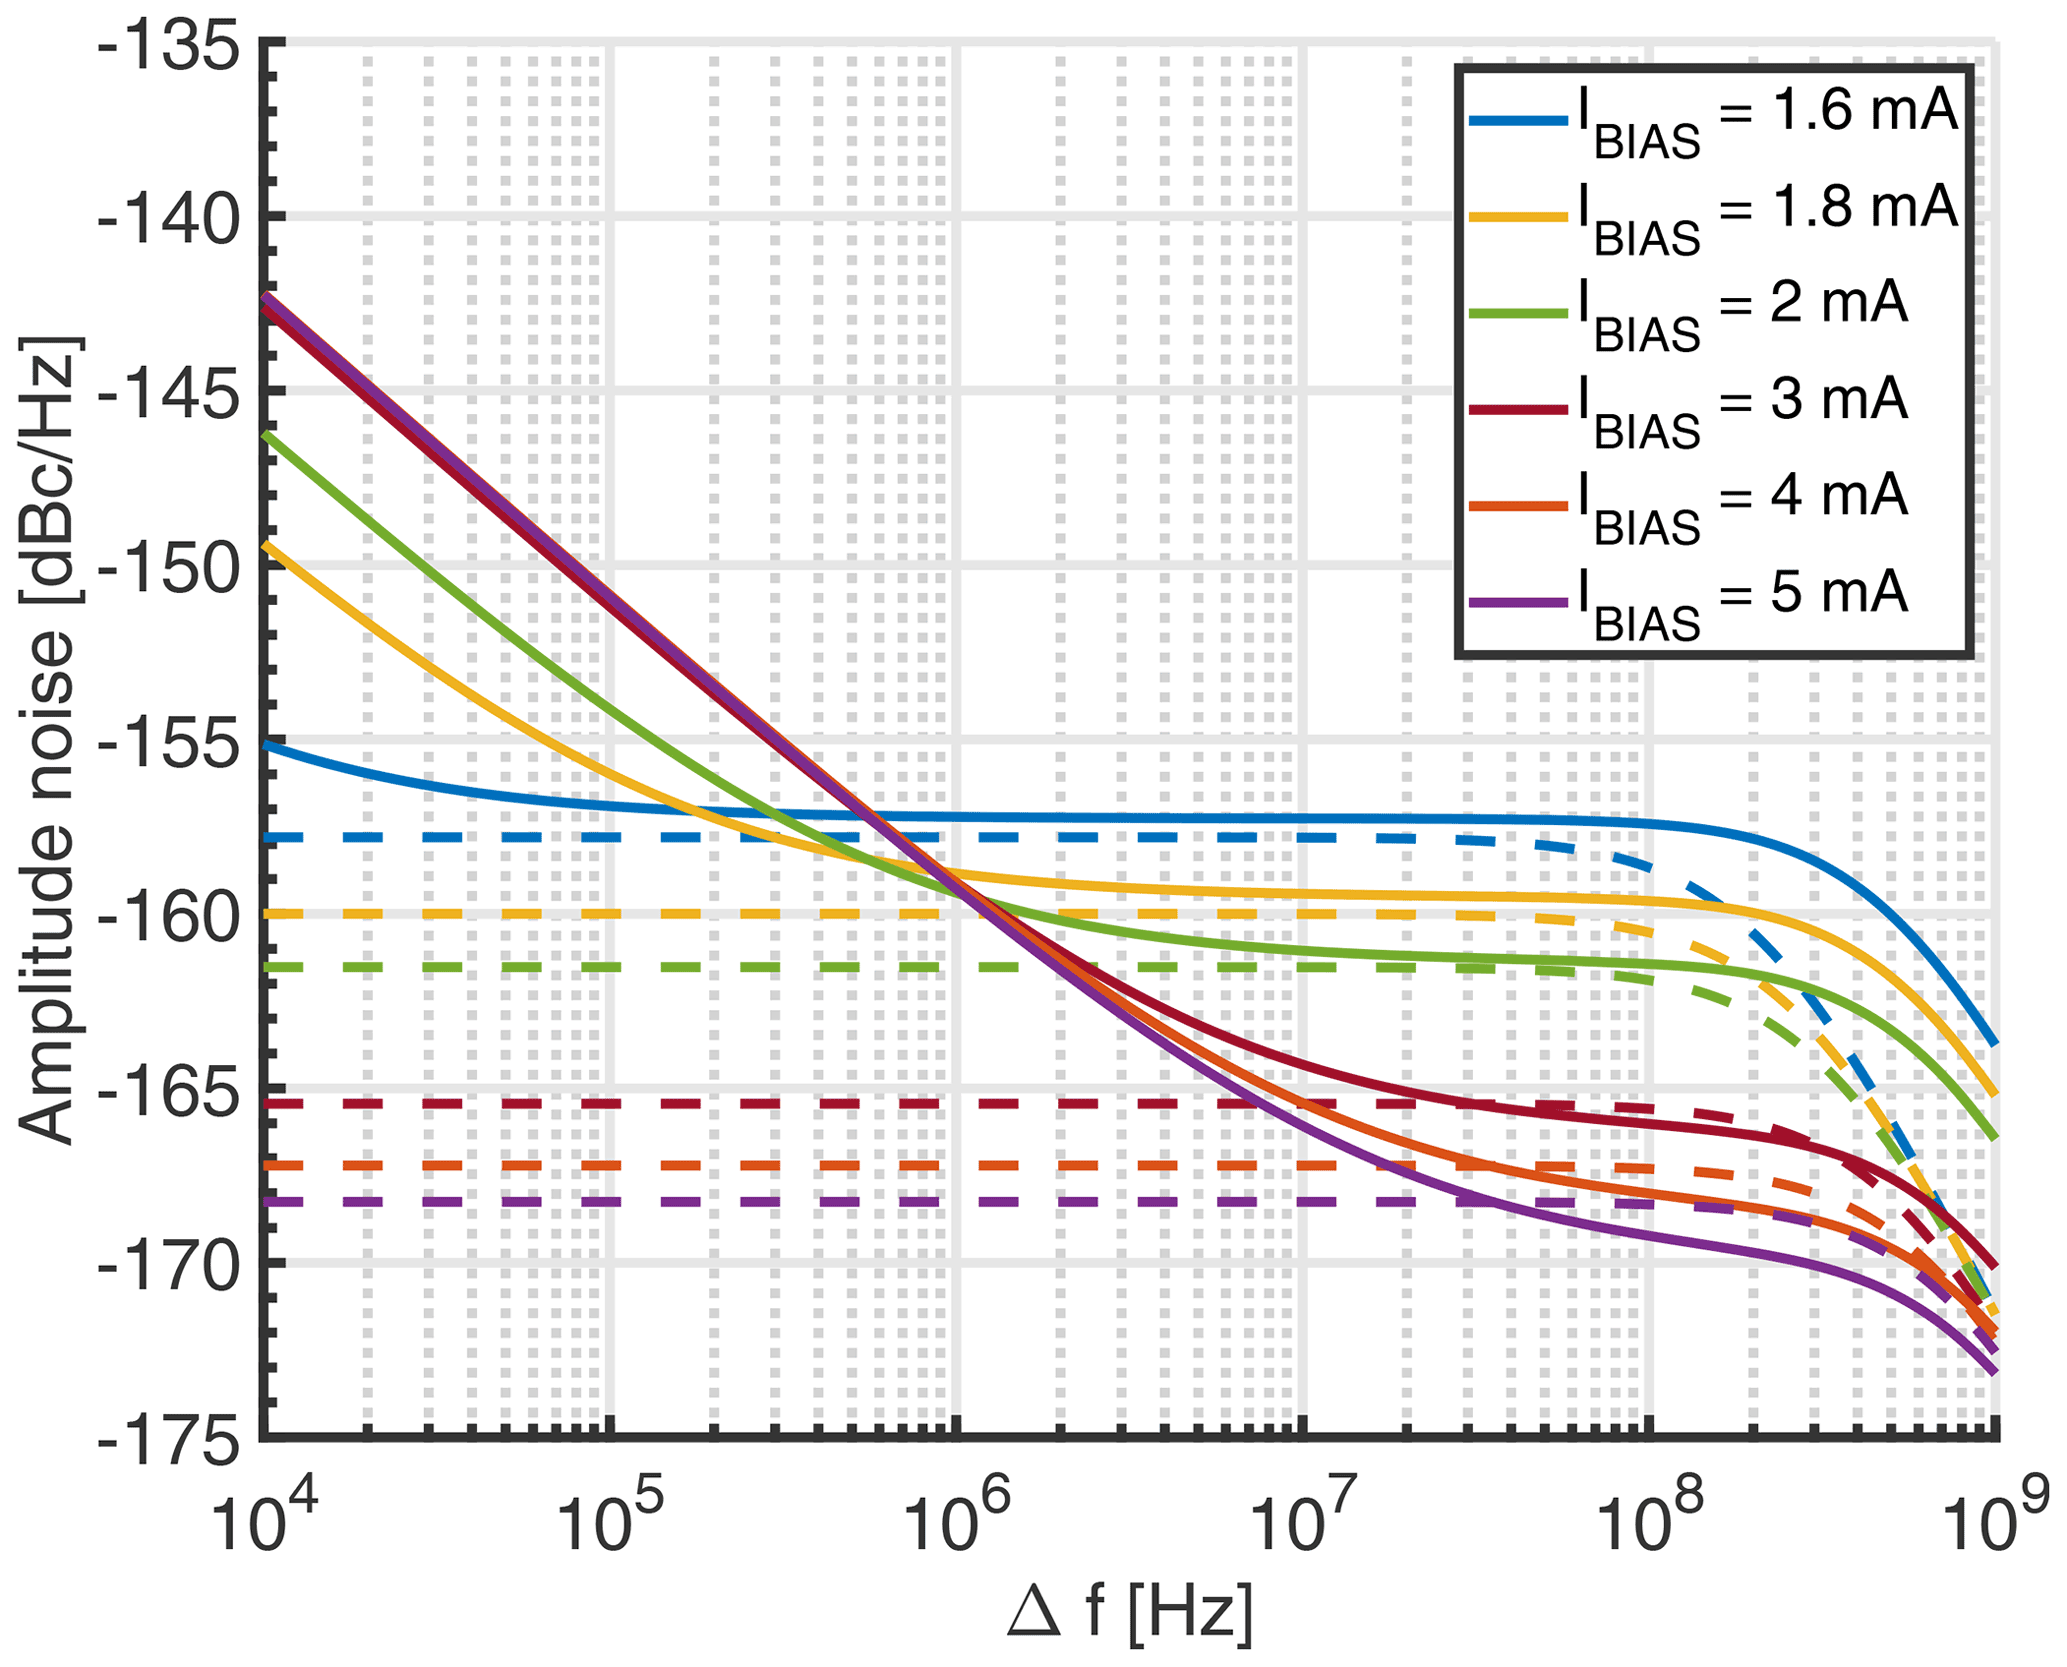
Figure 5Comparison of the proposed analytical model for the amplitude noise of an LC tank VCO and GoldenGate simulations. The simulation parameters are identical to those listed in the caption of Fig. 4 except for the bias current IBIAS, which was varied as a parameter to evaluate the range over which the proposed model is valid. Solid lines correspond to the GoldenGate results and dashed lines to the analytical model.
In this section, we will compare the circuit simulator model of Sect. 7 against measured data from a prototype realization of the proposed amplitude-sensitive VCO-based ESR sensor. To this end, we have used the ASIC, which was already presented by Handwerker et al. (2016), in the experimental setup of Fig. 6, using an off-chip low noise current source. Here, we have initially not used the setup of Fig. 1b because the comparison between the model and measured data turned out to be much simpler for field sweeps where the GoldenGate simulations take only a fraction of the time of frequency sweeps, where the oscillation frequency varies over a wide range with only very small ESR-induced changes on top of these large electrical variations. Since there is, in principle, a one-to-one correspondence between field and frequency sweeps and we use VTUNE to introduce a frequency modulation via a DAC, i.e., additional noise via the tuning port is considered in the experiments, these field sweeps display the same SNRs but make the comparison with the model much simpler. This being said, we also validated the proposed simplified setup of Fig. 1b experimentally.
Since according to the simulation results of Fig. 5, the noise power spectral density around Δf=0 is heavily plagued by noise3, we have introduced a lock-in detection scheme (off-chip lock-in amplifier), by modulating the oscillation frequency at a frequency of fmod=10 kHz using a sine wave voltage applied to the VCO tuning voltage VTUNE. In this way, we have measured the ESR spectrum of a small DPPH (2,2-diphenyl-1-picrylhydrazyl, Sigma Aldrich) sample with a volume of approximately 14 pL, shown in red in Fig. 7. The solid blue line in Fig.7 corresponds to a GoldenGate simulation using a filling factor corresponding precisely to the estimated sample volume of 14 pL, and the two dashed blue lines indicate two additional simulations with filling factors corresponding to an error in the estimation of the sample volume of ±25 %. Here, we have taken into account the demodulation sensitivity from the oscillator output voltage to node ![]() in Fig. 2a (simulated to be V/V), and the simulated lock-in detection spectra were computed from the direct detection spectra in MATLAB using the same modulation amplitude (frequency modulation with an amplitude of 1.5 mVrms, which together with the VCO slope of 0.8 GHz V−1 corresponds to an equivalent peak-to-peak field modulation of 120 µT) that was used in the measurement. According to the figure, when taking into account the modeling uncertainty due to difficulties in precisely determining the sample volume, there is an excellent agreement between the proposed circuit simulator model and the measured data.
in Fig. 2a (simulated to be V/V), and the simulated lock-in detection spectra were computed from the direct detection spectra in MATLAB using the same modulation amplitude (frequency modulation with an amplitude of 1.5 mVrms, which together with the VCO slope of 0.8 GHz V−1 corresponds to an equivalent peak-to-peak field modulation of 120 µT) that was used in the measurement. According to the figure, when taking into account the modeling uncertainty due to difficulties in precisely determining the sample volume, there is an excellent agreement between the proposed circuit simulator model and the measured data.
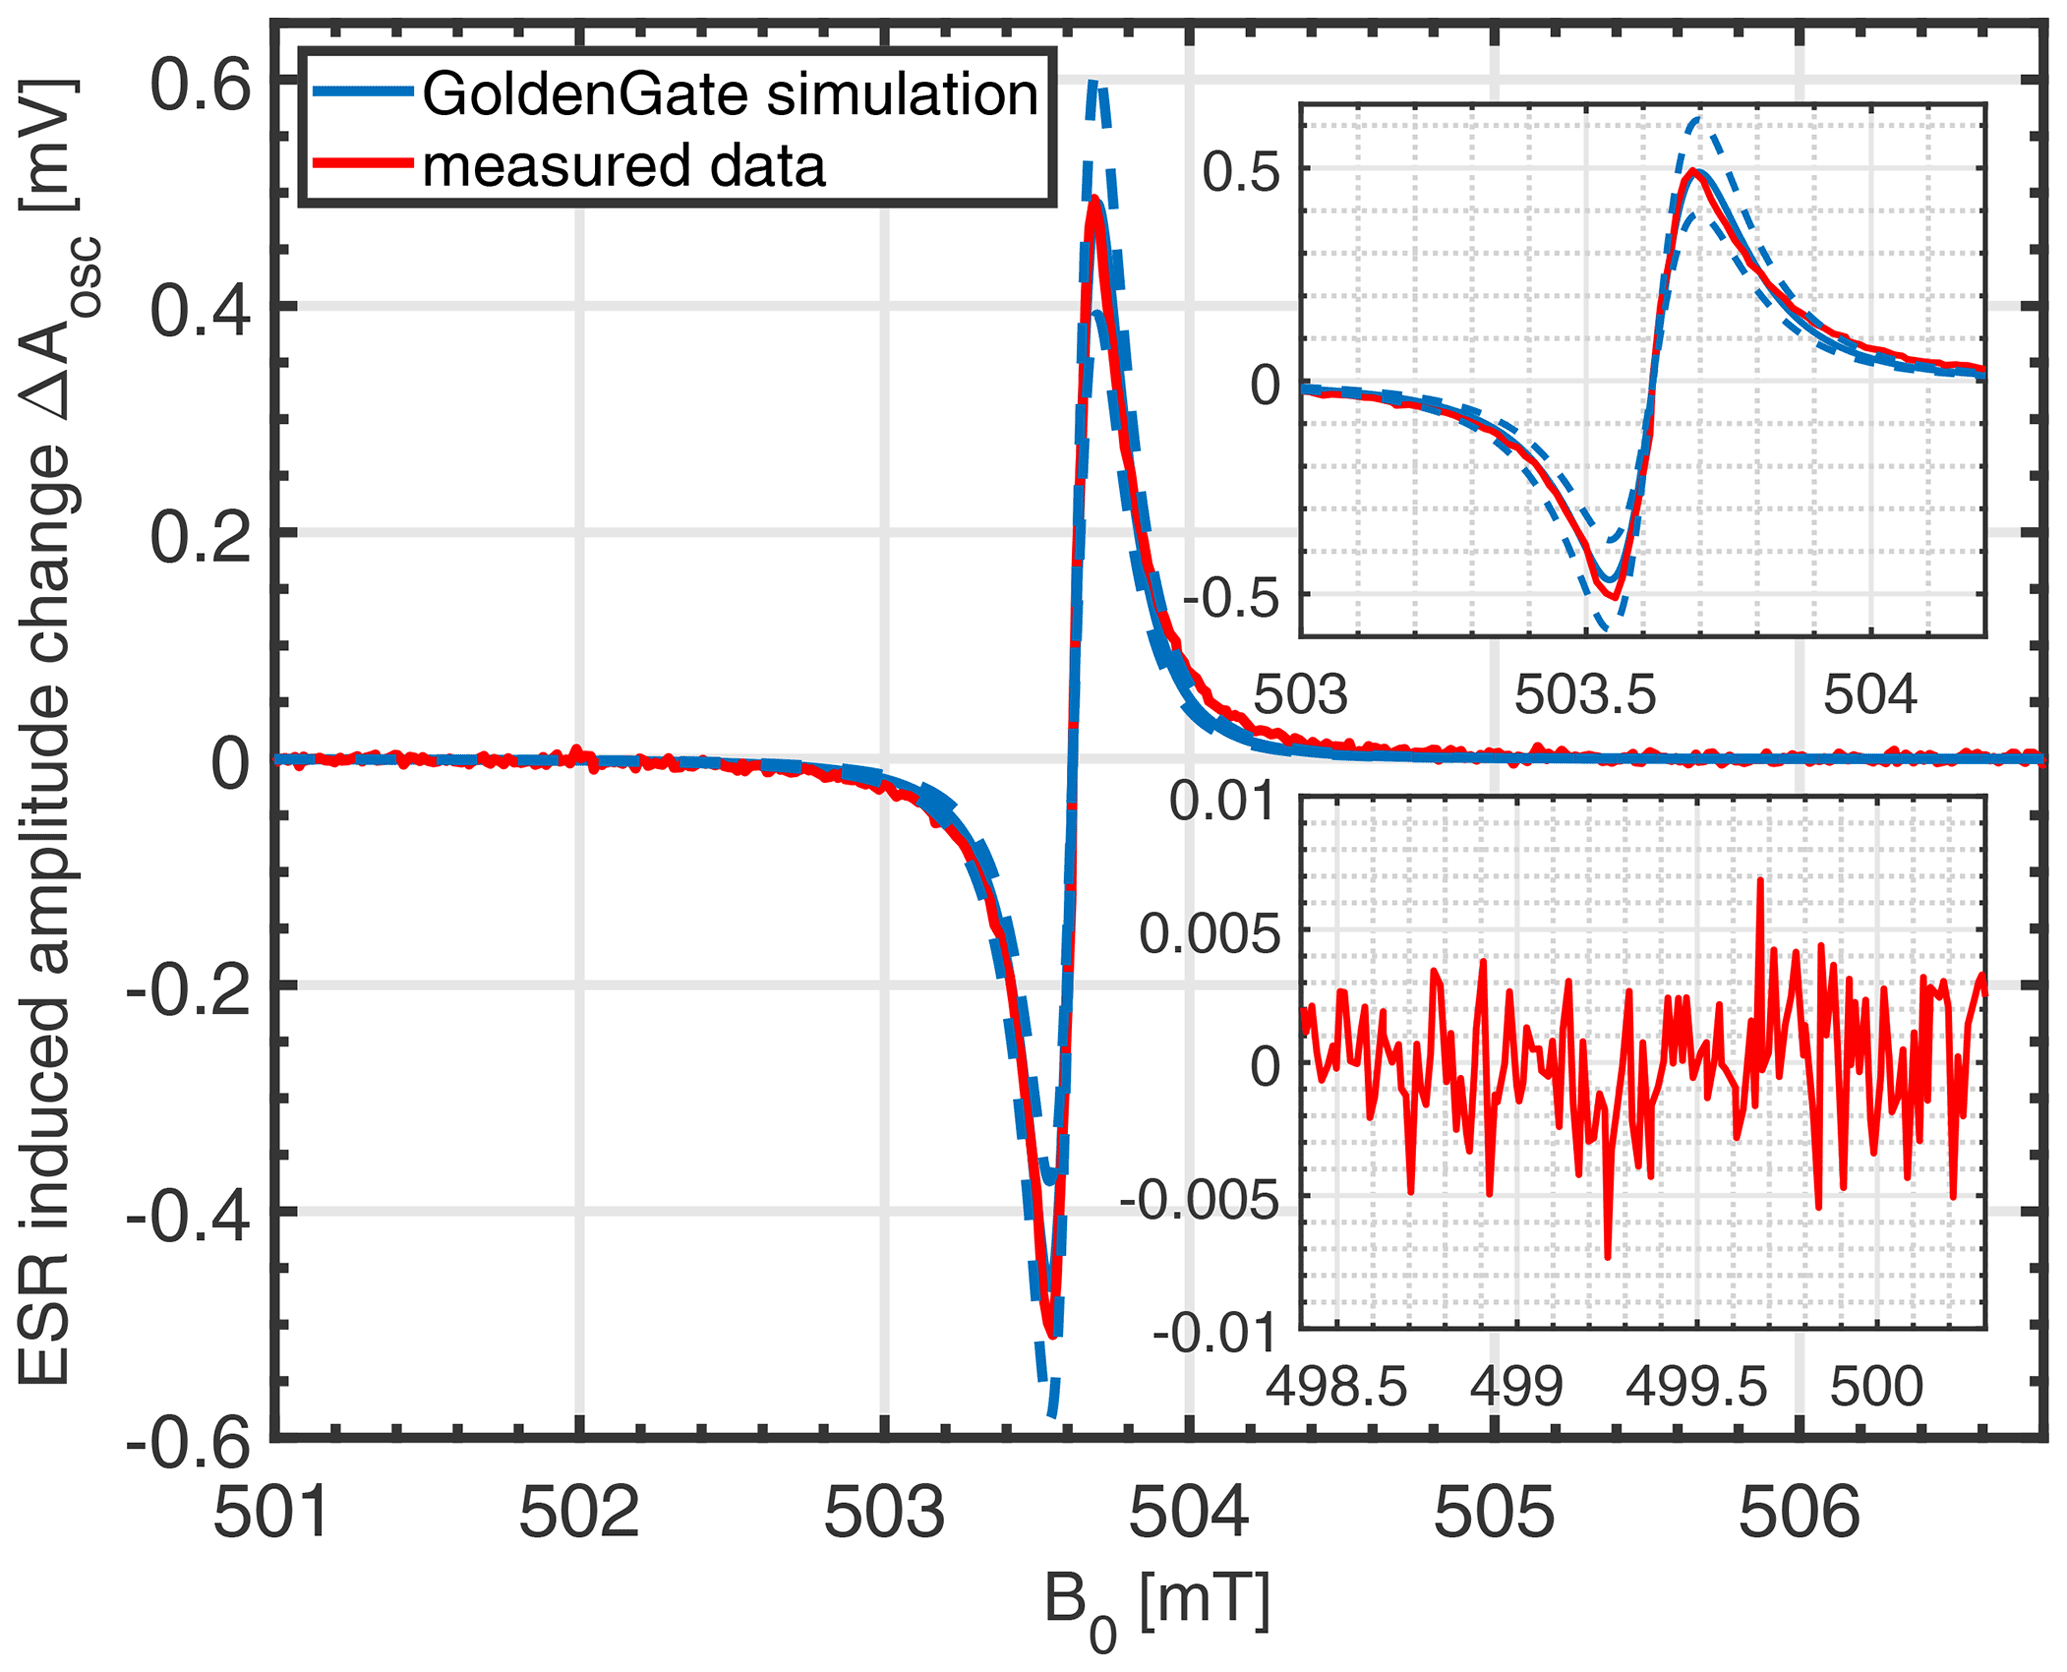
Figure 7Comparison of the circuit simulator model of Sect. 7 for the ESR-induced amplitude shift with measured data of a 14 pL DPPH sample obtained using the VCO prototype presented in Handwerker et al. (2016) used in the setup of Fig. 1b. For comparison, the measured results are referred to the oscillator output by dividing them by the lock-in gain and the demodulation sensitivity of the built-in AM demodulator. Top inset: zoomed-in view of the simulated and measured signals. Bottom inset: zoomed-in view of the measured signal used for the noise calculation. Measurement conditions: VTUNE=2.8 V, IBIAS=1.7 mA, simulated AC current in coil mA corresponding to B1≈16.8 µT.
To estimate the spin sensitivity of our system, we have used the measured data presented in Fig. 7. With the calculation detailed in Appendix A, we have estimated a spin sensitivity of approximately spins (G )−1, which is 445 times worse than the theoretically predicted value of spins (G )−1. This is in part due to the B1 used in the measurements, µT, being approximately 8 times less than µT to avoid any line broadening, leading to a reduction of approximately 2.5 times in Nmin, according to Eq. (18). Here B1,opt is calculated from Eq. (19) using ns, as extracted from the measured peak-to-peak linewidth of 1.4 G (see Fig. 7, equivalent to a full width at half maximum (FWHM) of about 3 G), while IBIAS and αod used in the measurement and in the optimum SNR condition are extracted from simulations, to be 1.7 mA and 1.25 (measurement) and 27.2 mA and 5 (optimum SNR condition). This large αod,opt of 5 leads to a higher amplitude noise in the optimum SNR condition (Eq. 16), explaining the Nmin reduction of 2.5× mentioned above. To investigate the remaining discrepancy of , we have also simulated the amplitude noise at node ![]() in Fig. 2a, which is depicted together with the simulated AM noise in the oscillator output voltage and the analytical noise model in Fig. 8. According to the figure, although the demodulation sensitivity between the oscillator output voltage and node
in Fig. 2a, which is depicted together with the simulated AM noise in the oscillator output voltage and the analytical noise model in Fig. 8. According to the figure, although the demodulation sensitivity between the oscillator output voltage and node ![]() is less than unity, the noise floor is significantly larger, leading to a greatly reduced SNR in the demodulated output. More quantitatively, the demodulation sensitivity of V/V, together with the 30 dB increased noise floor (an 8 dB increase due to the noise, which is not accounted for in Eq. (23), and another 22 dB increase in the demodulated output at node
is less than unity, the noise floor is significantly larger, leading to a greatly reduced SNR in the demodulated output. More quantitatively, the demodulation sensitivity of V/V, together with the 30 dB increased noise floor (an 8 dB increase due to the noise, which is not accounted for in Eq. (23), and another 22 dB increase in the demodulated output at node ![]() ), predicts a factor of 250 difference between the theoretically predicted value of Nmin and the measured value. This agrees well with the discrepancy of 180 mentioned above. Moreover, the corner frequency between the noise and the white noise parts of the spectrum occurs at significantly larger frequencies, effectively preventing an operation in the white noise region because at such high modulation rates rapid scan effects that perturb the spectra (Tseitlin et al., 2011) would already become visible. To verify the accuracy of the GoldenGate noise simulations, we have used the simulated noise floor at node
), predicts a factor of 250 difference between the theoretically predicted value of Nmin and the measured value. This agrees well with the discrepancy of 180 mentioned above. Moreover, the corner frequency between the noise and the white noise parts of the spectrum occurs at significantly larger frequencies, effectively preventing an operation in the white noise region because at such high modulation rates rapid scan effects that perturb the spectra (Tseitlin et al., 2011) would already become visible. To verify the accuracy of the GoldenGate noise simulations, we have used the simulated noise floor at node ![]() of −129.5 dBc Hz−1 and the simulated oscillator amplitude of approximately 820 mV to predict the rms noise in the measured data of Fig. 7. Taking into account the lock-in gain of 100 and the lock-in bandwidth of 2.5 Hz, the simulated noise floor predicts an rms noise of 3.5 µ Vrms, which corresponds approximately to the measured rms noise of 2.3 µ Vrms4.
of −129.5 dBc Hz−1 and the simulated oscillator amplitude of approximately 820 mV to predict the rms noise in the measured data of Fig. 7. Taking into account the lock-in gain of 100 and the lock-in bandwidth of 2.5 Hz, the simulated noise floor predicts an rms noise of 3.5 µ Vrms, which corresponds approximately to the measured rms noise of 2.3 µ Vrms4.

Finally, we have also performed frequency scan ESR experiments, where instead of sweeping the static magnetic field B0, the tuning voltage VTUNE is ramped in and out of resonance. An example spectrum of a DPPH sample with a volume of approximately 3 pL obtained using this method is shown in Fig. 9. In these frequency sweep experiments, we have achieved the same sensitivity as in the field sweep experiments. Similar to previous experiments, the VCO gain was 0.8 GHz V−1, and a noise floor of ≈ 0.1 mVrms can be observed, in accordance with our models. Performing frequency sweeps allows for the use of the simplified experimental setup of Fig. 1b, which is ideally suited for future point-of-care ESR spectrometers, without performance degradation. This being said, care has to be taken that no additional noise is introduced into the system via the tuning voltage input VTUNE. At this point, it is convenient that the amplitude-sensitive detection setup is much more immune against such additional noise from VTUNE than the frequency-sensitive setup, where the well-known AM-to-PM conversion in the varactor makes the setup much more prone to an increase in the noise floor due to DAC noise in VTUNE.
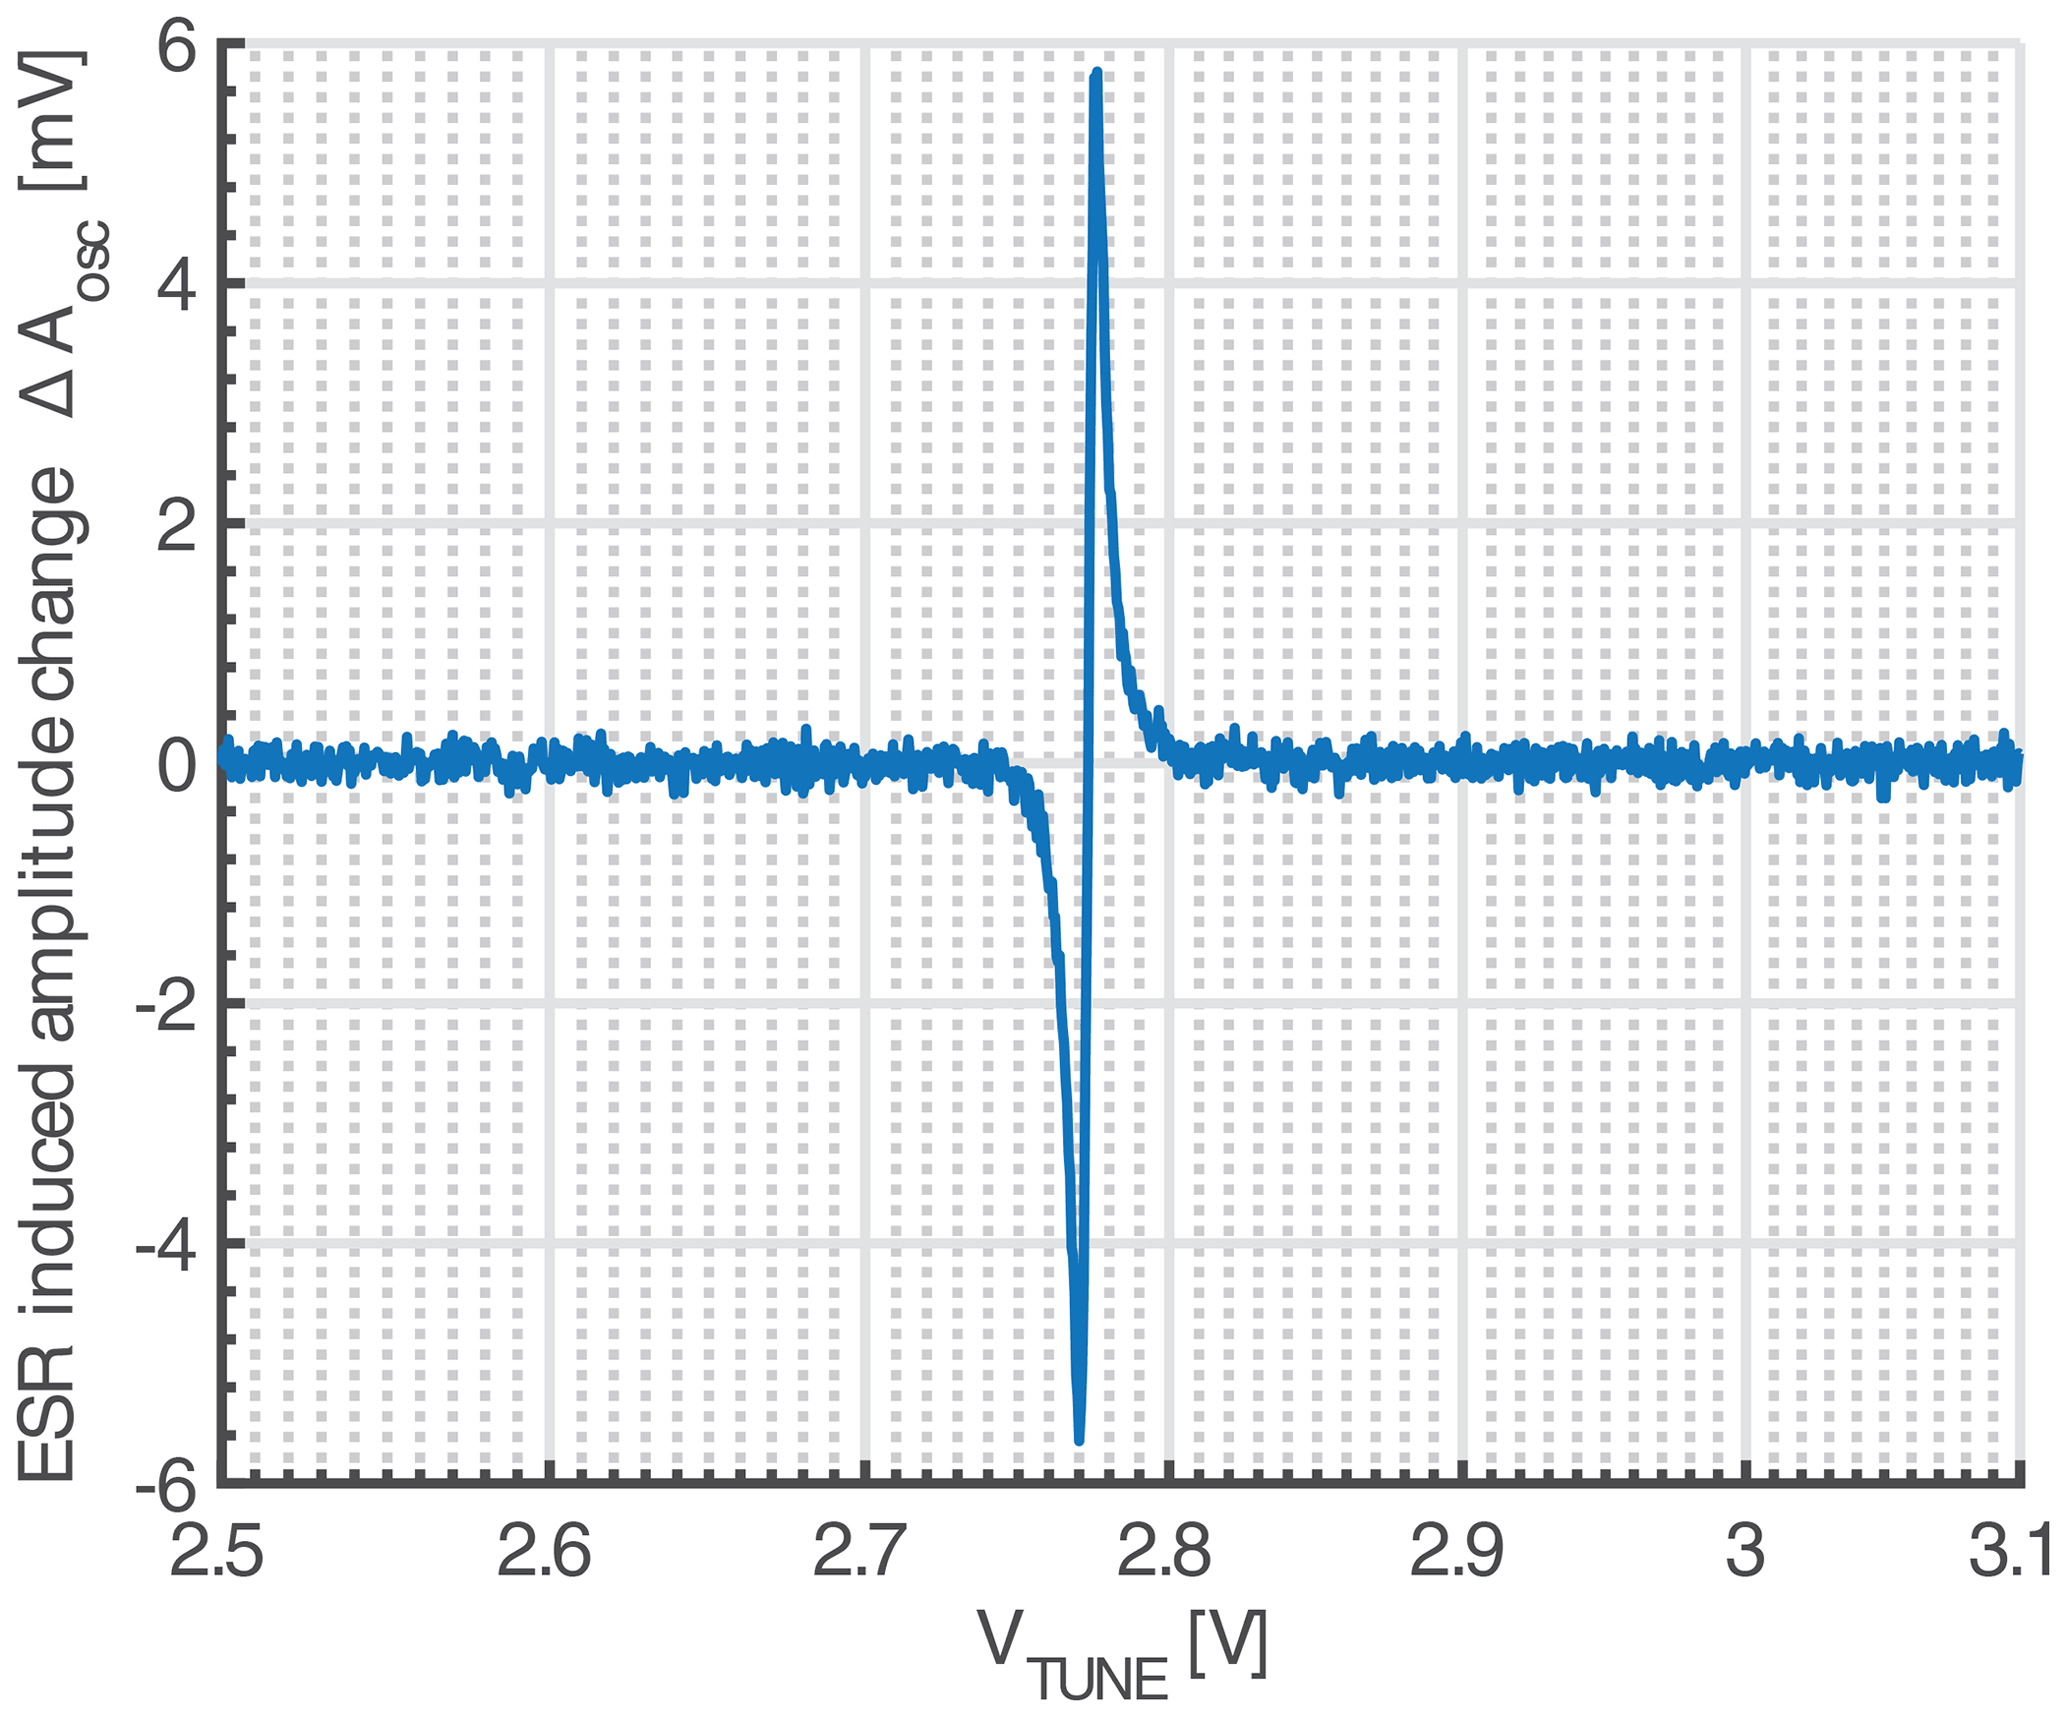
Figure 9Measured spectrum of a DPPH sample of a volume of approximately 3 pL. The spectrum was acquired using the setup of Fig. 1b by sweeping the tuning voltage of the VCO through the resonance frequency and simultaneously applying a small sinusoidal signal for a subsequent lock-in detection.
In this paper, we have introduced a new ESR detection method, which senses the ESR effect as changes of the amplitude of an integrated VCO. Together with the proposed setup, we have presented analytical models for both the ESR-induced amplitude changes and the AM noise floor of the VCO-based detector. The analytical models were then used to predict the limit of detection of the proposed method, which was shown to be identical to that of the previously presented frequency-sensitive VCO detection approach presented by Handwerker et al. (2016). The analytical models were then verified against circuit simulations, including an RLC tank model for the ESR effect. Finally, we have validated the circuit simulator model against measured data obtained from a VCO prototype operating around 14 GHz. When taking into account the increased noise floor at the intrinsic AM demodulation point inside the VCO, we have achieved very good agreement between the model and measured data, clearly showing that the circuit model can be used to optimize the detector performance already early on in the design phase, thereby removing the need for costly and time-consuming hardware iterations. Moreover, the presented results serve as proof of concept that with the proposed approach good sensitivities can be achieved already at moderate ESR frequencies. Since the proposed method scales very advantageously with frequency, it can fully benefit from the current ESR trend of going to higher and higher fields (and therefore also operating frequencies) to further improve sensitivity. With its very simple experimental setup (cf. Fig. 1b) and the availability of permanent magnets with field strengths up to approximately 2 T, the proposed approach is ideally suited for the design of the future generation of portable ESR spectrometers, which can play a crucial role in emerging fields such as on-site food quality control, manufacturing process control or potentially personalized medicine and home diagnostics.
We used the measured data shown in Fig. 7 to calculate the spin sensitivity. For the mass density of DPPH, we used the mean value of densities for the various DPPH crystal forms reported by Kiers et al. (1976), Williams (1967) and Wang et al. (1991b, a) as 1.4 g cm−3. As pointed out by Matsumoto and Itoh (2018), the number of radicals per unit mass can vary between different manufacturers due to the different purities and solvents used up to almost 20 %, with a mean value from their three samples of approximately 1.4×10²¹ spins g−1. Combining the two numbers, we arrived at a spin density of approximately 2×10¹² spins pL−1. Our DPPH sample has a volume of approximately 14 pL, resulting in a total number of 2.8×10¹³ spins. From the measurement data, the rms noise floor is calculated from the first 140 samples (the bottom inset in Fig. 7) to be 2.35 µV, while the signal amplitude is approximately 1 mV, leading to an SNR of 426. Since we used a lock-in BW of 2.5 Hz, the SNR per unit measurement time is 673.6 . Using this value together with the above-mentioned number of spins, the measured DPPH linewidth of 1.4 G, and Eq. (22), we calculated the spin sensitivity to be 8.9×10¹⁰ spins (G )−1.
Code and data are available upon request.
AC designed the chip, ran simulations, designed the measurement setup and conducted measurements. BS designed the measurement setup and conducted measurements. MK ran simulations, designed the measurement setup and conducted measurements. JLG designed the measurement setup and conducted measurements. AA and KL conceived the experiments. JA conceived the idea and experiments, derived the analytical models, designed the measurement setup and conducted experiments. All authors contributed to the manuscript.
The contact author has declared that neither they nor their co-authors have any competing interests.
Publisher’s note: Copernicus Publications remains neutral with regard to jurisdictional claims in published maps and institutional affiliations.
The authors gratefully acknowledge fruitful discussions with Klaus Peter Dinse and Silvio Künstner.
This research has been supported by the Deutsche Forschungsgemeinschaft (grant nos. AN 984/16-1 and AN 984/8-1), the Bundesministerium für Bildung und Forschung (grant no. 01186916/1 (EPRoC)) and the University of Florida (DSR Opportunity Fund).
This open-access publication was funded by the University of Stuttgart.
This paper was edited by Thomas Prisner and reviewed by two anonymous referees.
Abhyankar, N., Agrawal, A., Shrestha, P., Maier, R., McMichael, R. D., Campbell, J., and Szalai, V.: Scalable microresonators for room-temperature detection of electron spin resonance from dilute, sub-nanoliter volume solids, Sci. Adv., 6, eabb0620, https://doi.org/10.1126/sciadv.abb0620, 2020. a
Anders, J.: Fully-integrated CMOS Probes for Magnetic Resonance Applications, PhD thesis, EPFL, Lausanne, Switzerland, https://doi.org/10.5075/epfl-thesis-5154, 2011. a
Anders, J., Angerhofer, A., and Boero, G.: K-band single-chip electron spin resonance detector, J. Magn. Reson., 217, 19–26, 2012a. a, b, c
Anders, J., Ortmanns, M., and Boero, G.: Noise in Frequency-Sensitive ESR Detectors, in: Proceedings of the MATHMOD 2012, 14–17 February 2012, Vienna, Austria, 2012b. a, b, c
Anders, J., Ortmanns, M., and Boero, G.: Frequency noise in current-starved CMOS LC tank oscillators, Nonlinear Dynamics of Electronic Systems, Proceedings of NDES 2012, 11–13 July 2012, Wolfenbuettel, Germany, 1–4, 2012c. a
Andreani, P., Wang, X., Vandi, L., and Fard, A.: A study of phase noise in colpitts and LC-tank CMOS oscillators, IEEE J. Solid-St. Circ., 40, 1107–1118, 2005. a
Azarkh, M., Singh, V., Oklre, O., Seemann, I. T., Dietrich, D. R., Hartig, J. S., and Drescher, M.: Site-directed spin-labeling of nucleotides and the use of in-cell EPR to determine long-range distances in a biologically relevant environment, Nat. Protoc., 8, 131–147, 2013. a
Boero, G.: Integrated NMR Probe for Magnetometry, vol. 9 of Series in Microsystems, Hartung-Gorre, Konstanz, Germany, 2000. a
Chauhan, S. K., Kumar, R., Nadanasabapathy, S., and Bawa, A.: Detection Methods for Irradiated Foods, Compr. Rev. Food Sci. F., 8, 4–16, https://doi.org/10.1111/j.1541-4337.2008.00063.x, 2009. a
Chu, A., Schlecker, B., Lips, K., Ortmanns, M., and Anders, J.: An 8-channel 13 GHz ESR-on-a-Chip injection-locked vco-array achieving 200 µM-concentration sensitivity, in: 2018 IEEE International Solid-State Circuits Conference (ISSCC), 11–15 February 2018, San Francisco, USA, 354–356, https://doi.org/10.1109/ISSCC.2018.8310330, 2018. a
Cristea, D., Wolfson, H., Ahmad, R., Twig, Y., Kuppusamy, P., and Blank, A.: Compact electron spin resonance skin oximeter: Properties and initial clinical results, MAGN. RESON. MED., 85, 2915–2925, https://doi.org/10.1002/mrm.28595, 2021. a
Dayan, N., Ishay, Y., Artzi, Y., Cristea, D., Reijerse, E., Kuppusamy, P., and Blank, A.: Advanced surface resonators for electron spin resonance of single microcrystals, Rev. Sci. Instrum., 89, 124707, https://doi.org/10.1063/1.5063367, 2018. a
Demir, A.: Phase noise and timing jitter in oscillators with colored-noise sources, IEEE T. Circuits-I, 49, 1782–1791, 2002. a
Elias, R. J., Andersen, M. L., Skibsted, L. H., and Waterhouse, A. L.: Identification of Free Radical Intermediates in Oxidized Wine Using Electron Paramagnetic Resonance Spin Trapping, J. Agri. Food Chem., 57, 4359–4365, https://doi.org/10.1021/jf8035484, pMID: 19358607, 2009. a, b
Enz, C. and Vittoz, E. A.: Charge-based MOS transistor modeling: the EKV model for low-power and RF IC design, John Wiley, Chichester, UK, Hoboken, NJ, USA, 2006. a, b, c
Fehr, M., Schnegg, A., Rech, B., Lips, K., Astakhov, O., Finger, F., Pfanner, G., Freysoldt, C., Neugebauer, J., Bittl, R., and Teutloff, C.: Combined multifrequency EPR and DFT study of dangling bonds in a-Si:H, Phys. Rev. B, 84, 245203, https://doi.org/10.1103/PhysRevB.84.245203, 2011. a, b
Fehr, M., Schnegg, A., Rech, B., Lips, K., Astakhov, O., Finger, F., Freysoldt, C., Bittl, R., and Teutloff, C.: Dangling bonds in amorphous silicon investigated by multifrequency EPR, J. Non-Cryst. Solids, 358, 2067–2070, 2012. a
García-Martín, J., Gómez-Gil, J., and Vázquez-Sánchez, E.: Non-Destructive Techniques Based on Eddy Current Testing, Sensors, 11, 2525–2565, 2011. a
Gardiner, C. W.: Stochastic methods : a handbook for the natural and social sciences, Springer series in synergetics, 4th edn., Springer, Berlin, Germany, 2009. a
Gualco, G., Anders, J., Sienkiewicz, A., Alberti, S., Forró, L., and Boero, G.: Cryogenic single-chip electron spin resonance detector, J. Magn. Reson., 247, 96–103, 2014. a
Haag, S. F., Taskoparan, B., Darvin, M. E., Groth, N., Lademann, J., Sterry, W., and Meinke, M. C.: Determination of the antioxidative capacity of the skin in vivo using resonance Raman and electron paramagnetic resonance spectroscopy, Exp. Dermatol., 20, 483–487, https://doi.org/10.1111/j.1600-0625.2010.01246.x, 2011. a
Hajimiri, A. and Lee, T. H.: A general theory of phase noise in electrical oscillators, IEEE J. Solid-St. Circ., 33, 179–194, 1998. a
Handwerker, J., Schlecker, B., Wachter, U., Radermacher, P., Ortmanns, M., and Anders, J.: A 14 GHz battery-operated point-of-care ESR spectrometer based on a 0.13 µm CMOS ASIC, in: 2016 IEEE International Solid-State Circuits Conference (ISSCC), 31 January–4 February 2016, San Francisco, USA, 476–477, 2016. a, b, c, d, e, f, g
Jahanbakht, S. and Farzaneh, F.: Computation of the phase and amplitude noise in microwave oscillators and a simplified calculation method for far enough from the carrier offsets, IET Microw. Antenna. P., 4, 2031–2041, 2010. a, b
Jordan, D. W. and Smith, P.: Nonlinear ordinary differential equations ; an introduction for scientists and engineers, 4th edn., Oxford University Press, Oxford, UK, New York, USA, 2007. a
Kaertner, F. X.: Analysis of white and f-α noise in oscillators, Int. J. Circ. Theor. App., 18, 485–519, 1990. a
Kiers, C. T., De Boer, J. L., Olthof, R., and Spek, A. L.: The crystal structure of a 2,2-diphenyl-1-picrylhydrazyl (DPPH) modification, Acta Crystallogr. B, 32, 2297–2305, https://doi.org/10.1107/S0567740876007632, 1976. a
Kinget, P.: Amplitude detection inside CMOS LC oscillators, in: 2006 IEEE International Symposium on Circuits and Systems, 21–24 May 2006, Kos, Greece, p. 4, 2006. a
Kopani, M., Celec, P., Danisovic, L., Michalka, P., and Biro, C.: Oxidative stress and electron spin resonance, Clin. Chim. Acta, 364, 61–66, 2006. a
Magierowski, S. K. and Zukotynski, S.: CMOS LC-oscillator phase-noise analysis using nonlinear models, IEEE T. Circuits-I, 51, 664–677, 2004. a, b
Matheoud, A. V., Gualco, G., Jeong, M., Zivkovic, I., Brugger, J., Rønnow, H. M., Anders, J., and Boero, G.: Single-chip electron spin resonance detectors operating at 50 GHz, 92 GHz, and 146 GHz, J. Magn. Reson., 278, 113–121, 2017. a, b, c
Matheoud, A. V., Sahin, N., and Boero, G.: A single chip electron spin resonance detector based on a single high electron mobility transistor, J. Magn. Reson., 294, 59–70, 2018. a, b
Matsumoto, N. and Itoh, N.: Measuring Number of Free Radicals and Evaluating the Purity of Di(phenyl)-(2,4,6-trinitrophenyl)iminoazanium [DPPH] Reagents by Effective Magnetic Moment Method, Anal. Sci., 34, 965–971, https://doi.org/10.2116/analsci.18P120, 2018. a
Murphy, D., Rael, J. J., and Abidi, A. A.: Phase Noise in LC Oscillators: A Phasor-Based Analysis of a General Result and of Loaded Q, IEEE T. Circuits-I, 57, 1187–1203, 2010. a
Nallatamby, J. C., Prigent, M., Camiade, M., and Obregon, J.: Phase noise in oscillators – Leeson formula revisited, IEEE T. Microw. Theory, 51, 1386–1394, 2003. a
Ottaviani, M. F., Spallaci, M., Cangiotti, M., Bacchiocca, M., and Ninfali, P.: Electron Paramagnetic Resonance Investigations of Free Radicals in Extra Virgin Olive Oils, J. Agr. Food Chem., 49, 3691–3696, https://doi.org/10.1021/jf001203+, 2001. a, b
Qi, M., Gross, A., Jeschke, G., Godt, A., and Drescher, M.: Gd(III)-PyMTA Label Is Suitable for In-Cell EPR, J. Am. Chem. Soc., 136, 15366–15378, 2014. a
Qin, P. Z. and Warncke, K.: Electron Paramagnetic Resonance Investigations of Biological Systems by Using Spin Labels, Spin Probes, and Intrinsic Metal Ions Part B, vol. 564 of Methods in Enzymology, Academic Press, London, UK, 2015. a
Romanyukha, A., Trompier, F., Reyes, R. A., Christensen, D. M., Iddins, C. J., and Sugarman, S. L.: Electron paramagnetic resonance radiation dose assessment in fingernails of the victim exposed to high dose as result of an accident, Radiat. Environ. Bioph., 53, 755–762, https://doi.org/10.1007/s00411-014-0553-6, 2014. a
Sancho, S., Suarez, A., and Ramirez, F.: Phase and Amplitude Noise Analysis in Microwave Oscillators Using Nodal Harmonic Balance, IEEE T. Microw. Theory, 55, 1568–1583, https://doi.org/10.1109/TMTT.2007.900213, 2007. a
Schweiger, A. and Jeschke, G.: Principles of pulse electron paramagnetic resonance, Oxford University Press, Oxford, UK, New York, USA, 2001. a
Stratonovich, R. L.: Topics in the theory of random noise, Mathematics and its applications, Gordon and Breach, New York, USA, rev. english edn., 1963. a, b
Thiessen, T. and Mathis, W.: On Noise Analysis of Oscillators Based on Statistical Mechanics, International Journal of Electronics and Telecommunications, 56, 357–366, 2010. a
Tseitlin, M., Rinard, G. A., Quine, R. W., Eaton, S. S., and Eaton, G. R.: Rapid frequency scan EPR, J. Magn. Reson., 211, 156–161, 2011. a
Twahir, U. T., Stedwell, C. N., Lee, C. T., Richards, N. G. J., Polfer, N. C., and Angerhofer, A.: Observation of superoxide production during catalysis of Bacillus subtilis oxalate decarboxylase at pH 4, Free Radical Bio. Med., 80, 59–66, 2015. a
Twahir, U. T., Ozarowski, A., and Angerhofer, A.: Redox Cycling, pH Dependence, and Ligand Effects of Mn(III) in Oxalate Decarboxylase from Bacillus subtilis, Biochemistry, 55, 6505–6516, 2016. a
Twig, Y., Dikarov, E., and Blank, A.: Ultra miniature resonators for electron spin resonance: Sensitivity analysis, design and construction methods, and potential applications, Mol. Phys., 111, 2674–2682, 2013. a
Wang, H., Barton, R. J., Robertson, B. E., and Weil, J. A.: Structural studies of 2,2-Diphenyl-1-picrylhydrazine: A clathrate forming compound, J. Inclus. Phenom. Mol., 10, 203–217, https://doi.org/10.1007/BF01066204, 1991a. a
Wang, H., Barton, R. J., Robertson, B. E., Weil, J. A., and Brown, K. C.: Crystal and molecular structures of two polymorphs of 2,2-di(p-nitrophenyl)-1-picrylhydrazine dichloromethane, C18H11N7O10 ⋅ CH2Cl2, Can. J. Chem., 69, 1306–1314, https://doi.org/10.1139/v91-194, 1991b. a
Williams, D. E.: Crystal structure of 2,2-diphenyl-1-picrylhydrazyl free radical, J. Am. Chem. Soc., 89, 4280–4287, https://doi.org/10.1021/ja00993a005, 1967. a
Wolfson, H., Ahmad, R., Twig, Y., Kuppusamy, P., and Blank, A.: A Miniature Electron Spin Resonance Probehead for Transcutaneous Oxygen Monitoring, Appl. Magn. Reson., 45, 955–967, https://doi.org/10.1007/s00723-014-0593-8, 2014. a
Yalcin, T. and Boero, G.: Single-chip detector for electron spin resonance spectroscopy, Rev. Sci. Instrum., 79, 094105, https://doi.org/10.1063/1.2969657, 2008. a, b, c, d, e, f, g
Zhang, L. and Niknejad, A. M.: An Ultrasensitive 14-GHz 1.12-mW EPR Spectrometer in 28-nm CMOS, IEEE Microw. Wirel. Co., 31, 819–822, https://doi.org/10.1109/LMWC.2021.3060730, 2021. a
For a free electron, we have GHz T−1.
The coil inductance Lcoil can be computed from the unitary field according to . Moreover, according to standard ESR terminology, the B1 field is the circularly polarized field produced by the coil current in resonance with the spin ensemble; i.e., .
Parts of the spectrums with a slope of −10 dB per decade.
- Abstract
- Introduction
- Performing amplitude-sensitive ESR experiments using LC tank VCOs
- Deterministic model of the amplitude and frequency of an LC tank VCO
- ESR-induced amplitude shifts
- Model of amplitude noise in LC tank VCOs
- Limit of detection
- Simulating ESR experiments using circuit simulators
- Comparison between the analytical model and circuit simulations
- Measurements
- Conclusions
- Appendix A: Spin sensitivity calculation
- Code and data availability
- Author contributions
- Competing interests
- Disclaimer
- Acknowledgements
- Financial support
- Review statement
- References