the Creative Commons Attribution 4.0 License.
the Creative Commons Attribution 4.0 License.
 | 01 Aug 2022
An improved, time-efficient approach to extract accurate distance restraints for NMR2 structure calculation
Aditya Pokharna
Felix Torres
Harindranath Kadavath
Julien Orts
Roland Riek
Exact nuclear Overhauser enhancement (eNOE) yields highly accurate, ensemble averaged 1H–1H distance restraints with an accuracy of up to 0.1 Å for the multi-state structure determination of proteins as well as for nuclear magnetic resonance molecular replacement (NMR2) to determine the structure of the protein–ligand interaction site in a time-efficient manner. However, in the latter application, the acquired eNOEs lack the obtainable precision of 0.1 Å because of the asymmetrical nature of the filtered nuclear Overhauser enhancement spectroscopy (NOESY) experiment used in NMR2. This error is further propagated to the eNOE equations used to fit and extract the distance restraints.
In this work, a new analysis method is proposed to obtain inter-molecular distance restraints from the filtered NOESY spectrum more accurately and intuitively by dividing the NOE cross peak by the corresponding diagonal peak of the ligand. The method termed diagonal-normalised eNOEs was tested on the data acquired by Torres et al. (2020) on the complex of PIN1 and a small, weak-binding phenylimidazole fragment. NMR2 calculations performed using the distances derived from diagonal-normalised eNOEs yielded the right orientation of the fragment in the binding pocket and produced a structure that more closely resembles the benchmark X-ray structure (2XP6) (Potter et al., 2010) with an average heavy-atom root-mean-square deviation (RMSD) of 1.681 Å with respect to it, when compared to the one produced with traditional NMR2 with an average heavy atom RMSD of 3.628 Å. This is attributed to the higher precision of the evaluated distance restraints.
- Article
(2713 KB) - Full-text XML
- BibTeX
- EndNote


Nuclear magnetic resonance molecular replacement (NMR2) is a hybrid approach to determine the structure of protein–ligand complexes, utilising a previously determined structure (for example, a X-ray structure or a structure from a protein homolog) of the target protein and combining it with the spatial information extracted by solution-state NMR to identify the binding pocket of the protein and the orientation of the ligand inside it (Wälti and Orts, 2018). The major strength of the method is that one does not need to carry out protein resonance assignment to obtain the complex structure. Using NMR2, Orts et al. were able to solve the structure of various complexes (Orts et al., 2016; Torres et al., 2020; Wälti and Orts, 2018) accurately (up to 1 Å) within a few days of measurement and analysis. The NMR2 structure calculation workflow is detailed in Orts and Riek (2020) and relies on acquiring precise inter-molecular distance restraints.
In NMR2, the 13C, 15N-labelled protein and non-labelled ligand are mixed and measured together using the F1-[15N,13C]-filtered [1H,1H] nuclear Overhauser enhancement spectroscopy (NOESY) experiment (Zwahlen et al., 1997) to extract the inter-molecular NOE rates and the corresponding distances. This analysis is performed in an in-built module within CYANA structure calculation software (Güntert and Buchner, 2015) called eNORA (Strotz et al., 2017). eNORA fits the NOE build-up curves obtained at multiple mixing times to extract exact cross-relaxation rates (exact nuclear Overhauser enhancements, eNOEs), which produces semi-accurate distance restraints with both upper and lower limit (Vögeli et al., 2009).
However, the precision of these inter-molecular distance restraints is much lower (∼ 20 % higher tolerance needed) (Strotz et al., 2015) than the bidirectional intra-molecular eNOEs, usually measured inside the protein, from a series of 15N, 13C-resolved [1H,1H] NOESY experiments that have a precision of 0.1 Å. The lower precision is attributed to the imbalanced magnetisation pathway within the F1-15N, 13C-filtered [1H,1H] NOESY experiment, the lack of a clean steady-state magnetisation at the beginning of the experiment, the unknown spin diffusion contribution (Kalk and Berendsen, 1976), and the complexity involved in extracting distances within eNORA, which further propagates errors arising from the NOESY spectrum.
In this work, we present an alternative approach for extracting cross-relaxation rates from the filtered 2D NOESY spectra that forgoes the need for the sophisticated and time-intensive eNORA calculations and produces more accurate distances. The complex used in this study is that of cis/trans-isomerase PIN1 with a low-molecular-weight fragment, 2-(3-chlorophenyl)-5-methyl-1H-imidazole-4-carboxylic acid, drawn in Fig. A1, whose structure of the interaction site was solved by Torres et al. (2020), in order to test the NMR2 method for weak binding small molecules. This fragment called Compound 2 in the paper by Torres et al. (2020) produces very few inter-molecular eNOEs to PIN1, due to its small size (comprising only a few protons) and low binding affinity (760 µM). This makes the de novo determination of the right pose of the ligand in the binding pocket using NMR2 very challenging.
As we shall see, our approach has been successful in producing better restraints for the PIN1–Compound 2 complex than the standard procedure thereby predicting the right orientation of the ligand in the binding pocket when compared with the X-ray structure of this complex (2XP6) (Potter et al., 2010), which serves as a benchmark to ascertain the accuracy of the NMR2 structures.
Following the standard NMR theory of the NOESY experiment (Keepers and James, 1984), the proposed analysis arises out of simple approximations made on the fundamental equations used to calculate eNOEs. Every spin pair that produces a cross peak can be assumed to form a two-spin system. The cross-relaxation rate for a two-spin system (i and j) can be analytically given as (Macura et al., 1986; Boelens et al., 1988; Vögeli, 2014)
where Iii(t) and Iij(t) represent the peak intensity of the diagonal and the cross peak in the NOESY spectrum respectively. The cross-relaxation rate, σij, further depends on λ±, which are a function of auto-relaxation rates of the two spins, ρi and ρj.
The diagonal intensities can be approximated by a single-exponential decay, completely independent of the auto- and cross-relaxation rates of the other spin:
Furthermore, under the assumption that ρi≈ρj=ρ, which holds true for small- to medium-sized proteins, the exponential terms in Eq. (1) can be expanded to the second order as follows:
Combining Eqs. (1), (3), and (4), the following expression can be obtained:
This straightforward expression relates the cross peak and diagonal intensities at mixing time, t, to the cross-relaxation rate. These quantities can be directly extracted from NOESY spectra recorded at multiple mixing times and fitted with a simple linear model to compute the cross-relaxation rate. This forgoes the need for invoking the eNORA module to fit the NOE build-ups. More importantly, it produces more accurate rates as it only involves directly fitting the experimentally derived peak build-up intensities once. With the standard approach used in eNORA, the diagonal intensities are fitted in accordance with Eq. (3) to extrapolate the auto-relaxation rate, ρi and the initial magnetisation, Iii(0). The error introduced to these quantities by imprecise fitting of Eq. (3) and low signal-to-noise ratio (SNR) of diagonal peaks is propagated to Eqs. (1) and (2), which are used to determine σij. Furthermore, the imbalance inherent to the F1-[15N,13C]-filtered [1H,1H] NOESY experiment and the missing ρi contributes to the relative error. This error is also compounded in the eNORA approach as the peak intensity data are transformed and used in multiple fitting equations.
The rates determined with the new method proposed here using Eq. (5) are termed diagonal-normalised NOEs. The conversion from the obtained cross-relaxation rates to distances can be made via the equations reported in the previous NMR2 publications (Wälti and Orts, 2018). Please note that in the case of the PIN1–Compound 2 complex, the effective correlation time used to convert rates to distances was derived from steric distances found in the fragment (Torres et al., 2020).
However, there is a level of uncertainty still attached to the distance restraints extracted via this method because of the assumption, ρi=ρj, especially for large ligand–protein complexes with weak binding affinities, as ρj might be an order of magnitude above ρi. A simple test was performed to quantify the uncertainty introduced by the above assumption to the extracted distances. It involved taking artificial distances (3 and 5 Å) between spin pairs followed by back-calculating the value of the respective cross-relaxation rates. The obtained rates were fed to Eqs. (1) and (2) with varying assumptions of the values of the auto-relaxation rates (ρj and ρi). The ratios of magnetisation transfer were obtained at identical mixing times [40, 60, 90, and 120 ms], as used by Torres et al. (2020), and fitted according to the Eq. (5) in an attempt to reproduce the artificial distances.
The results of the test are detailed in Fig. A2 in the Appendix. At the ratio of , the highest measured ratio generally expected for the complex of a large protein and a small ligand, our method was able to reproduce the inter-molecular distance with an accuracy of 12.45 % for both 3 and 5 Å. Hence, we propose a distance accuracy of 10 % for our approach. This distance accuracy lies between distances derived from bidirectional eNOEs (0 %) and unidirectional eNOEs (20 %) (Strotz et al., 2015). It is noted that the CYANA software uses a harmonic potential for a its target function (TF) to accommodate the distance restraints, and as such 0 % means that only harmonic potential is involved, whereas 20 % distance tolerance indicates the presence of a flat potential from 0 %–20 % distance followed by the harmonic potential beyond it (Güntert and Buchner, 2015).
In order to evaluate the accuracy of the distance extraction method of diagonal-normalised NOEs, the PIN1–Compound 2 complex introduced above is used. All the NMR experiments on the PIN1–Compound 2 complex were conducted and the subsequent resonance assignments were performed by Torres et al. (2020) (co-authors in this study). They resolved the structure of the binding pocket using NMR2 on the inter-molecular, unidirectional, eNOE-derived distance restraints which have an expected accuracy of 20 % (Strotz et al., 2015). In this work, we have used their data, recorded on 15N,13C-filtered [1H,1H] NOESY spectra, to evaluate the performance of the diagonal-normalised eNOE analysis as compared to the standard eNOE approach (Vögeli et al., 2009; Vögeli, 2014).
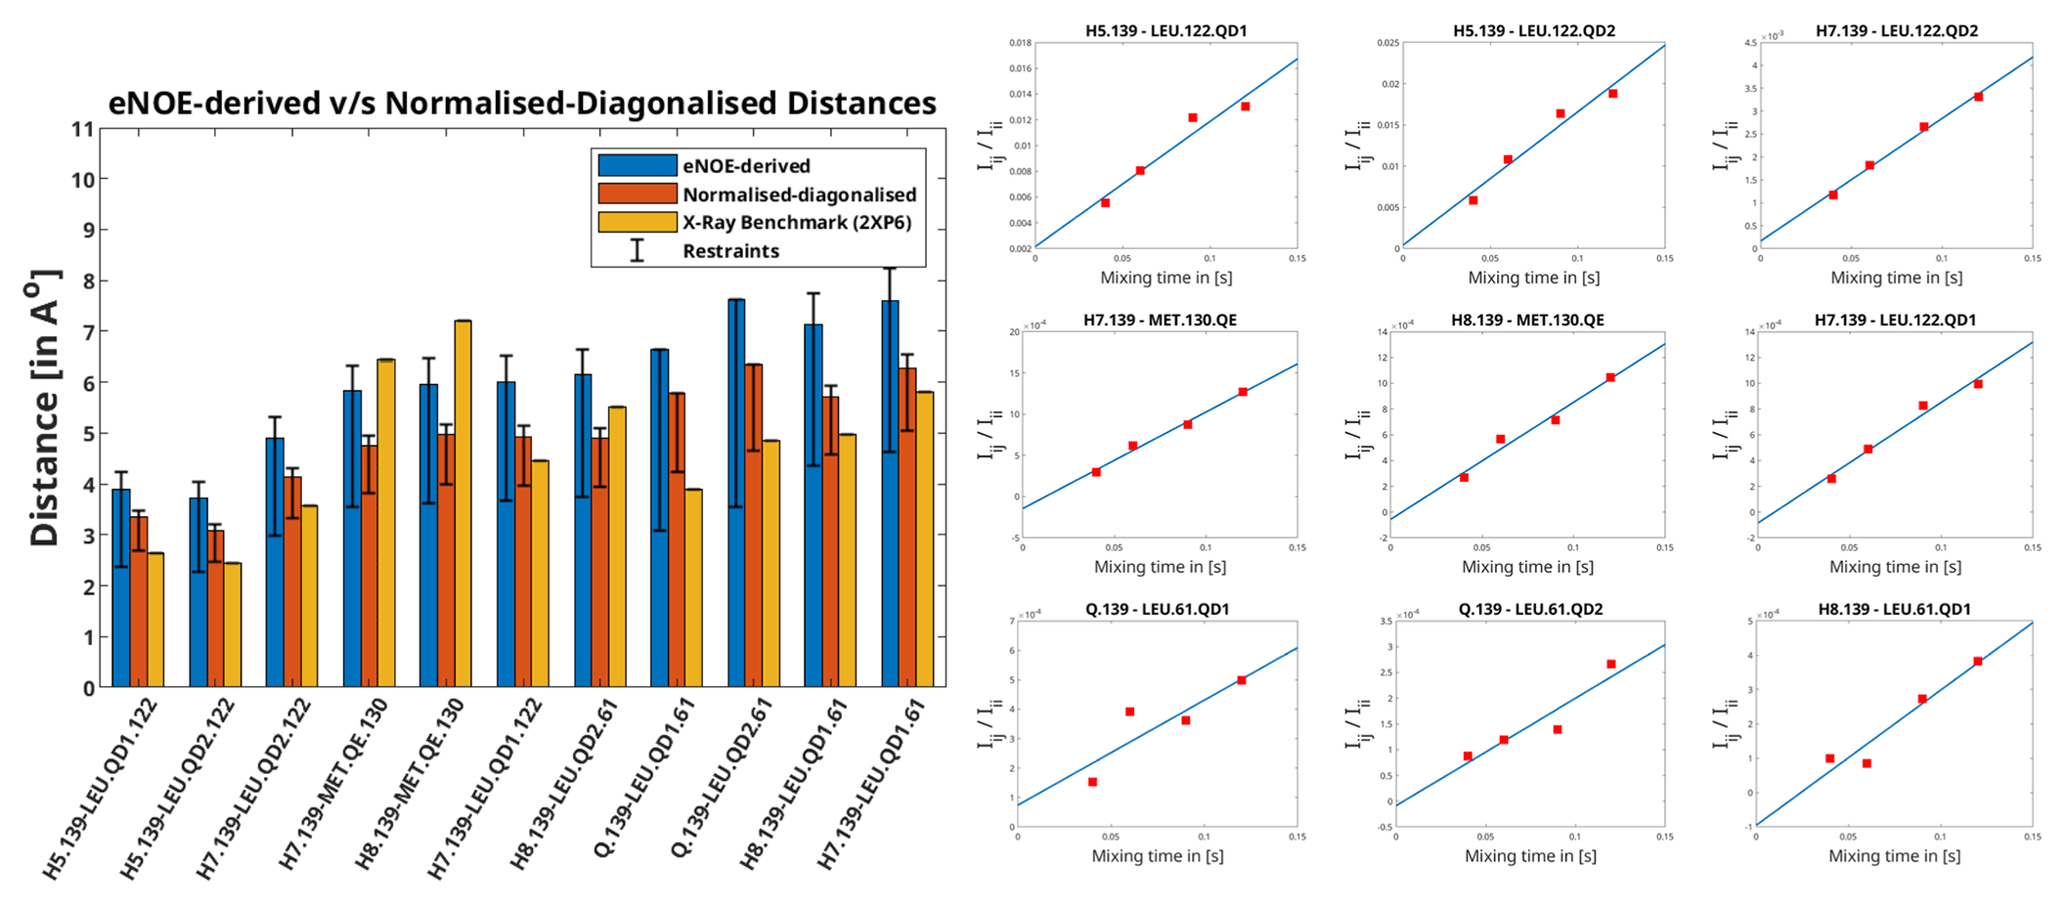
Figure 1Left: distances extracted from F1-[15N,13C]-filtered [1H,1H] NOESY using the eNOE (blue) and diagonal-normalised approach (red) compared to the benchmark X-ray structure. The bars denote the distances that arise from the cross-relaxation rates from the complex of PIN1 with Compound 2, as given in Torres et al. (2020). The bars in yellow represent the distances back-calculated from the X-ray structure (2XP6) (Potter et al., 2010). The error bars denote the upper and lower limit restraints produced in CYANA (Güntert and Buchner, 2015) for the extracted distances. A tolerance of 20 % and 10 % was taken and for the eNOE and the diagonal-normalised approach extracted distances respectively. Right: the ratio of NOE build-ups to the corresponding diagonal peak intensities plotted against mixing time for the PIN1–Compound 2 complex for the diagonal-normalised approach. The data points were fitted using a linear least square fitting model in MATLAB (MATLAB, 2018). The slope denotes the cross-relaxation rate of the given peak, as per Eq. (5).
Apart from being more time-efficient and intuitive, this method should also provide more accurate distances, as discussed in the Theory section. The NOE build-up plots, fitted linearly according to Eq. (5), are depicted in Fig. 1 (right). The linear fits mostly tend to zero when mixing time is zero, and the experimental data fit well, even at longer mixing times for all cross peaks. This indicates a lack of significant spin diffusion contribution. Moreover, it is easier to detect spin diffusion with this method compared to the standard approach using eNORA, as it manifests itself as non-linearity in the fitted data. This difference is illustrated in Fig. A3 in the Appendix.
The derived distance restraints are also plotted against the conventional eNOE-derived distance restraint and the distances back-calculated from the benchmark X-ray structure (2XP6) (Potter et al., 2010) in Fig. 1 (left). (The protons were added to the X-ray structure in CYANA; Güntert and Buchner, 2015.) Indeed, the diagonal-normalised distance restraints better resemble the ones from the X-ray structure (mean difference in the distances being 1.04 ± 0.65 Å) than the ones from the standard approach (mean difference in the distances being 1.57 ± 0.73 Å), the only exceptions being the distances that include the protons from the solvent-exposed Methionine 130.
The inter-molecular distances obtained from the PIN1–Compound 2 complex through the conventional eNORA-based method and the diagonal-normalised approach are plotted in Fig. 1. The plots illustrate that the restraints obtained via the latter are tighter by 0.4–1.2 Å. The source of this difference, as discussed in the Theory section, arises from the inherent complexity involved in extracting distances from a filtered 2D NOESY spectrum.
Table 1Table detailing the results of NMR2 calculations with distance restraints extracted from eNOE and diagonal-normalised method with varying values of errUni in CYANA.

a A precision of x % dictates the value of upper limit and lower limit distance restraints with the upper limit distance restraint being (1+x %) × (extracted distance) and the lower limit distance restraint being (1−x %) × (extracted distance). b A target function (TF) of less than 2 Å2 within NMR2 is considered a successful structure determination (Orts and Riek, 2020). c The total number of degenerate lowest energy conformers is the number of distinct orientations of the ligand within the binding pocket that were obtained with a CYANA target function (TF) of 0 Å2 from NMR2 calculations.
To evaluate the 10 % error estimate deduced in the Theory section further and to study the impact of the diagonal-normalised distance restraints on NMR2 structure determination, NMR2 structures of the complex PIN1–Compound 2 were calculated with varying degree of precision of the diagonal-normalised distance restraints (i.e. 0 %, 5 %, 10 %, and 20 %) (Table 1). The restraints were input in the NMR2 algorithm, and the output structures were compared to the structure determined in Torres et al. (2020) using standard eNOEs.
The NMR2 program screens all potential combinations of methyl groups in protein and protons on the ligand and calculates the complex structure for all of the possibilities without needing protein assignment. The success of an NMR2 run lies in it being able to discriminate between all the possible structures and pinpoint the right pose of ligand in the binding pocket. This is especially difficult for small fragments like Compound 2, with only five distinct protons/methyl groups.
Table 1 outlines the details of the structure calculation test. The restraints obtained through the eNORA-based method were not good enough and gave rise to more than 10 degenerate structures with a target function (TF) of 0 Å2, meaning that all experimental distance restraints were fulfilled without inconsistency/error in any of the 10 degenerate structures. The structure in which the ligand has the same orientation inside the binding pocket as the benchmark X-ray structure (2XP6) (Potter et al., 2010) has a root-mean-square deviation (RMSD) of 3.63 Å with respect to the X-ray structure (2XP6). Using the diagonal-normalised distance determination procedure with a precision of 20 %, a better performance is observed with only five degenerate structures with a TF of 0 Å2, which included the complex structure with Compound 2 in the right pose (RMSD of 2.17 Å). For the anticipated precision of the distance restraints of 10 %, the calculation produced only one structure with a TF = 0.03 Å2, coloured in purple in Fig. 2, which shows the same orientation as the crystal structure with an RMSD of 1.68 Å. This structure was superimposed onto the benchmark structure, coloured in cyan in Fig. 2. A visual inspection of the binding pocket illustrated in Fig. 2 shows that the ligand appears deeper in the binding pocket and better aligned with the crystal structure compared to the structure obtained by traditional, eNORA-based NMR2. For a distance precision of 5 % and below, the calculations did not converge to structures that fulfil the experimental restraints and produce structures below the hard limit of TF < 20 Å2. This is expected since the distance restraints are not of the quality of bidirectional restraints due to the assumption ρi=ρj, the lack of spin diffusion correction, and other restrictions inherent to the NMR2 protocol, such as the use of a previously determined protein structure and the combination of X-ray and NMR data.

Figure 2Surface representation of the binding pocket of PIN1 with Compound 2 from two different perspectives. Coloured in cyan is the surface representation of the protein alongside a stick representation of ligand determined by X-ray crystallography studies (2XP6) (Potter et al., 2010). Coloured in brown is the stick representation of the structure of the ligand inside the binding pocket determined by Torres et al. (2020) with a distance precision of 20 % using the standard eNORA approach. Coloured in purple is the structure determined by NMR2 calculations using the distances extracted via the diagonal-normalised approach with a precision of 10 % (refer to Row 3 in Table 1). The nitrogen, oxygen, and chlorine atoms on the ligand are coloured blue, red, and green respectively.
The strength of this approach lies in distinguishing the correct pose of a weak-binding, low-molecular-weight ligand which gives very few inter-molecular NOEs inside the binding pocket of a larger protein. Nevertheless, this approach was also tested on the protein–ligand complex of HDM2, a human oncogenic protein, with caylin-1, which presents abundant inter-molecular NOEs. The traditional eNORA-based NMR2 was successful in characterising the structure of protein–ligand interaction site (7QDQ), as shown in the work of Mertens et al. (2022). With the diagonal-normalised approach at 10 % precision, we obtained the same pose of caylin-1 in the HDM2 binding site as Mertens et al. (2022), with a TF of 1.52 Å2 and RMSD between the two structures of 0.81 Å (refer to Fig. A4 in the Appendix). Furthermore, the calculations made with 15 % and 20 % precision also matched the predictions of traditional NMR2 in identifying the right structure. This is further evidence that our approach can at least match the predictions of traditional NMR2 in the case of strong binders and possibly exceed them in the case of weak binders with less NOEs. It is noted that the presence of multiple configurations/conformations of the ligand in the binding pocket will require detailed eNOE-based multi-state structure calculations (Vögeli et al., 2013; Ashkinadze et al., 2022).
To sum up, this work proposes an intuitive and time-efficient, alternative method to extract precise distance restraints from a series of filtered NOESY spectra, that gives, in the system studied, an accurate NMR2 structure of the protein–ligand interaction site.
No new material was prepared for the sake of this work. The protocol to express and purify the protein and the ligand and to mix them afterwards is detailed in Torres et al. (2020).
No new NMR experiments were conducted for this work either. The peak intensities from the spectra acquired by Torres et al. (2020) were extracted via ccpNMR (Skinner et al., 2016). The intensities were later fitted to acquire the rates in the MATLAB software suite (MATLAB, 2018). The structure calculations were performed by the NMR2 program through CYANA (Güntert and Buchner, 2015). All the structures were displayed and overlaid each other using the Chimera molecular visualisation tool (Pettersen et al., 2004).

Figure A1A line representation of Compound 2 (2-(3-chlorophenyl)-5-methyl-1H-imidazole-4-carboxylic acid) from Torres et al. (2020). The figure was obtained from ChemSpider (ID:25056681).
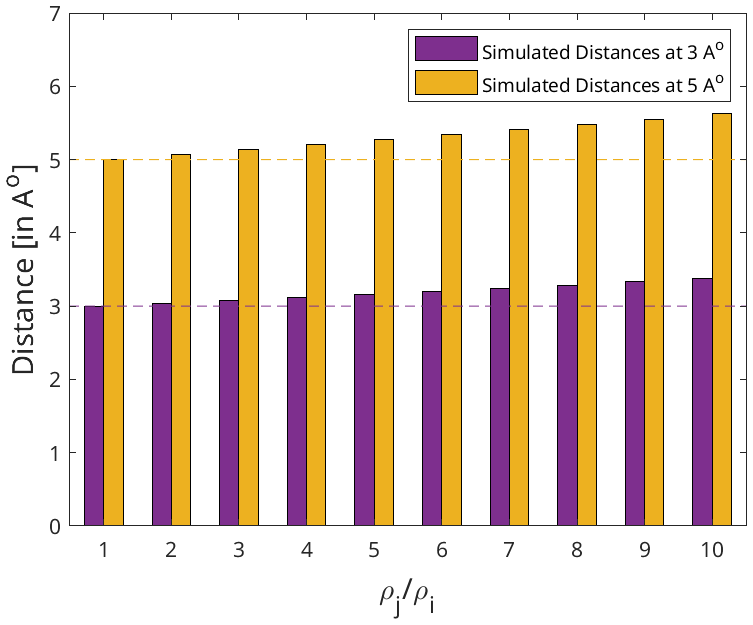
Figure A2The effect of the relative auto-relaxation rates of the protein and the ligand on the distances extracted via the diagonal-normalised approach. The dotted lines represent the artificial distances 3 and 5 Å in purple and yellow respectively. The corresponding bars denote the distances back-calculated using the diagonal-normalised approach from the artificial distances depending on the relative auto-relaxation rates, ρi and ρj. Each set of distances (bars) are derived through varying assumptions of the values of ρi and ρj with respect to each other ranging from = [1 to 10].
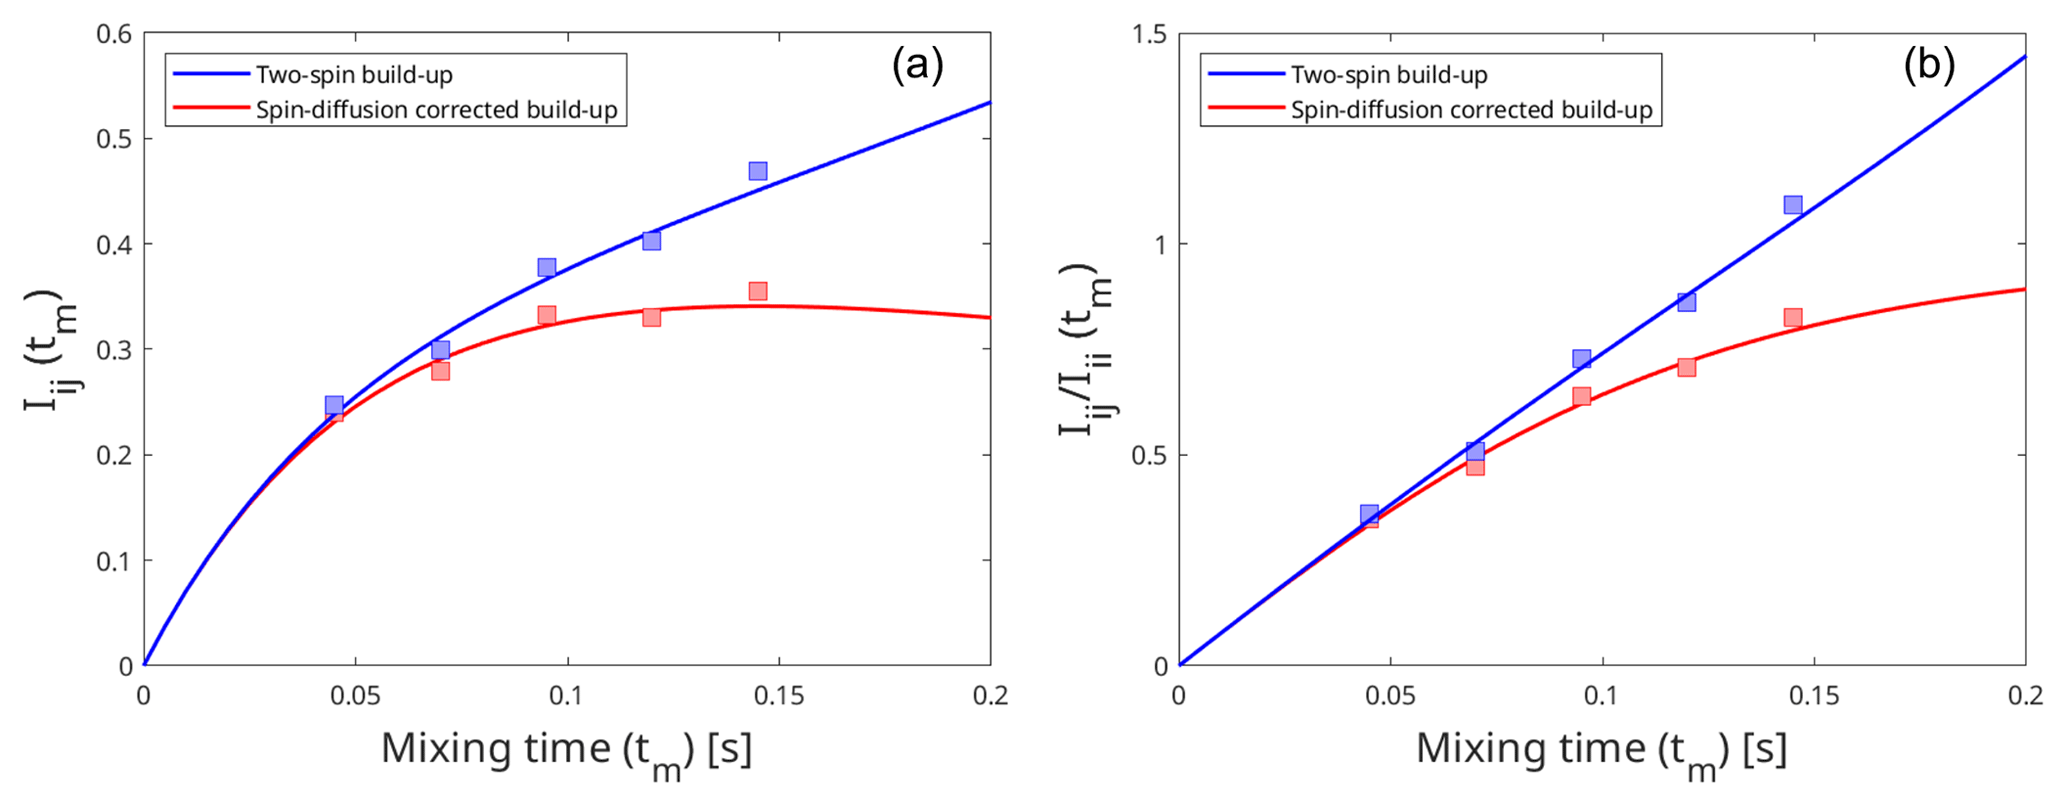
Figure A3Effect of spin diffusion on the intensity build-up curves produced by the eNORA-based approach (a) and the diagonal-normalised approach (b). The build-up curves were fitted using artificially simulated peak intensities in a model system, third immunoglobulin-binding domain of protein G (GB3), which has been extensively studied using eNOE spectroscopy (Vögeli et al., 2012, 2013). The blue curve represents the intensity build-up in an isolated two-spin system, with an inter-proton distance of 3.83 Å, and the red curve represents the same two spins experiencing spin diffusion due to the presence of other spins in the system. The comparison between the plots highlight that it is easier to detect the influence of spin diffusion with the diagonal-normalised approach (b), as it induces deviation from the expected linear fit.
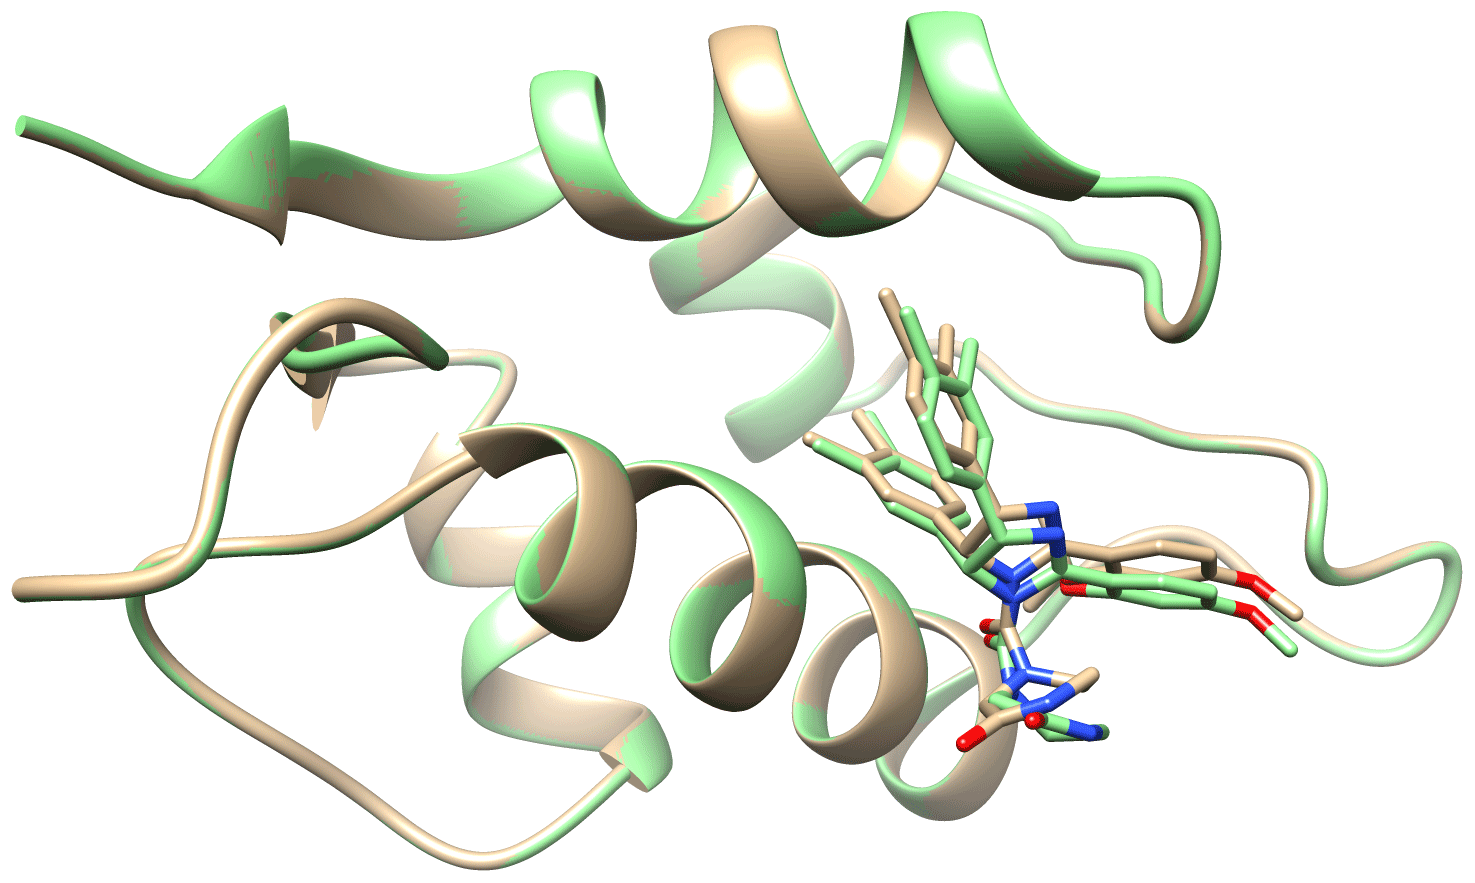
Figure A4Ribbon representation of the protein, HDM2, with the stick representation of caylin-1 present in the binding pocket. Coloured in brown is the surface of the structure determined by traditional NMR2 (7QDQ) by Mertens et al. (2022). Coloured in green is the structure determined by NMR2 calculations using the diagonal-normalised approach with a precision of 10 %. The nitrogen and oxygen atoms on the ligand are coloured blue and red respectively.
All relevant data and analysis scripts can be obtained upon request.
AP and RR contributed to the conception and design of the experiment. FT, JO, and RR provided the experimental data from their previous work (Torres et al., 2020). AP wrote the MATLAB scripts used for simulation and analysis of the data. AP, FT, JO, HK, and RR interpreted the data. AP wrote the original draft of the manuscript, and all authors reviewed and edited the article.
The contact author has declared that none of the authors has any competing interests.
Publisher’s note: Copernicus Publications remains neutral with regard to jurisdictional claims in published maps and institutional affiliations.
This research has been supported by the Schweizerischer Nationalfonds zur Förderung der Wissenschaftlichen Forschung (grant no. 182800).
This paper was edited by Geoffrey Bodenhausen and reviewed by two anonymous referees.
Ashkinadze, D., Kadavath, H., Riek, R., and Güntert, P.: Optimization and validation of multi-state NMR protein structures using structural correlations, J. Biomol. NMR, 76, 39–47, https://doi.org/10.1007/s10858-022-00392-2, 2022. a
Boelens, R., Koning, T. M. G., and Kaptein, R.: Determination of biomolecular structures from proton-proton NOE's using a relaxation matrix approach, J. Mol. Struct., 173, 299–311, https://doi.org/10.1016/0022-2860(88)80062-0, 1988. a
Güntert, P. and Buchner, L.: Combined automated NOE assignment and structure calculation with CYANA, J. Biomol. NMR, 62, 453–471, https://doi.org/10.1007/s10858-015-9924-9, 2015. a, b, c, d, e
Kalk, A. and Berendsen, H. J. C.: Proton magnetic relaxation and spin diffusion in proteins, J. Magn. Reson., 24, 343–366, https://doi.org/10.1016/0022-2364(76)90115-3, 1976. a
Keepers, J. W. and James, T. L.: A theoretical study of distance determinations from NMR. Two-dimensional nuclear overhauser effect spectra, J. Magn. Reson., 57, 404–426, https://doi.org/10.1016/0022-2364(84)90257-9, 1984.fcro a
Macura, S., Farmer, B. T., and Brown, L. R.: An improved method for the determination of cross-relaxation rates from NOE data, J. Magn. Reson., 70, 493–499, https://doi.org/10.1016/0022-2364(86)90143-5, 1986. a
MATLAB: 9.7.0.1190202 (R2018b), The MathWorks Inc., Natick, Massachusetts, 2018. a, b
Mertens, V., Abi Saad, M. J., Coudevylle, N., Wälti, M. A., Finke, A., Marsh, M., and Orts, J.: Elucidation of a nutlin-derivative–HDM2 complex structure at the interaction site by NMR molecular replacement: A straightforward derivation, Journal of Magnetic Resonance Open, 10–11, 100032, https://doi.org/10.1016/j.jmro.2022.100032, 2022. a, b, c
Orts, J. and Riek, R.: Protein–ligand structure determination with the NMR molecular replacement tool, NMR2, J. Biomol. NMR, 74, 633–642, https://doi.org/10.1007/s10858-020-00324-y, 2020. a, b
Orts, J., Wälti, M. A., Marsh, M., Vera, L., Gossert, A. D., Güntert, P., and Riek, R.: NMR-Based Determination of the 3D Structure of the Ligand–Protein Interaction Site without Protein Resonance Assignment, J. Am. Chem. Soc., 138, 4393–4400, https://doi.org/10.1021/jacs.5b12391, 2016. a
Pettersen, E. F., Goddard, T. D., Huang, C. C., Couch, G. S., Greenblatt, D. M., Meng, E. C., and Ferrin, T. E.: UCSF Chimera – A visualization system for exploratory research and analysis, J. Comput. Chem., 25, 1605–1612, https://doi.org/10.1002/jcc.20084, 2004. a
Potter, A., Oldfield, V., Nunns, C., Fromont, C., Ray, S., Northfield, C. J., Bryant, C. J., Scrace, S. F., Robinson, D., Matossova, N., Baker, L., Dokurno, P., Surgenor, A. E., Davis, B., Richardson, C. M., Murray, J. B., and Moore, J. D.: Discovery of cell-active phenyl-imidazole Pin1 inhibitors by structure-guided fragment evolution, Bioorg. Med. Chem. Lett., 20, 6483–6488, https://doi.org/10.1016/j.bmcl.2010.09.063, 2010. a, b, c, d, e, f
Skinner, S. P., Fogh, R. H., Boucher, W., Ragan, T. J., Mureddu, L. G., and Vuister, G. W.: CcpNmr AnalysisAssign: a flexible platform for integrated NMR analysis, J. Biomol. NMR, 66, 111–124, https://doi.org/10.1007/s10858-016-0060-y, 2016. a
Strotz, D., Orts, J., Minges, M., and Vögeli, B.: The experimental accuracy of the uni-directional exact NOE, J. Magn. Reson., 259, 32–46, https://doi.org/10.1016/j.jmr.2015.07.007, 2015. a, b, c
Strotz, D., Orts, J., Chi, C. N., Riek, R., and Vögeli, B.: eNORA2 Exact NOE Analysis Program, J. Chem. Theory Comput., 13, 4336–4346, https://doi.org/10.1021/acs.jctc.7b00436, 2017. a
Torres, F., Ghosh, D., Strotz, D., Chi, C. N., Davis, B., and Orts, J.: Protein–fragment complex structures derived by NMR molecular replacement, RSC Medicinal Chemistry, 11, 591–596, https://doi.org/10.1039/D0MD00068J, 2020. a, b, c, d, e, f, g, h, i, j, k, l, m
Vögeli, B.: The nuclear Overhauser effect from a quantitative perspective, Prog. Nucl. Mag. Res. Sp., 78, 1–46, https://doi.org/10.1016/j.pnmrs.2013.11.001, 2014. a, b
Vögeli, B., Segawa, T. F., Leitz, D., Sobol, A., Choutko, A., Trzesniak, D., van Gunsteren, W., and Riek, R.: Exact Distances and Internal Dynamics of Perdeuterated Ubiquitin from NOE Buildups, J. Am. Chem. Soc., 131, 17215–17225, https://doi.org/10.1021/ja905366h, 2009. a, b
Vögeli, B., Orts, J., Strotz, D., Güntert, P., and Riek, R.: Discrete Three-dimensional Representation of Macromolecular Motion from eNOE-based Ensemble Calculation, CHIMIA, 66, 787–787, https://doi.org/10.2533/chimia.2012.787, 2012. a
Vögeli, B., Güntert, P., and Riek, R.: Multiple-state ensemble structure determination from eNOE spectroscopy, Mol. Phys., 111, 437–454, https://doi.org/10.1080/00268976.2012.728257, 2013. a, b
Wälti, M. A. and Orts, J.: The NMR2 Method to Determine Rapidly the Structure of the Binding Pocket of a Protein–Ligand Complex with High Accuracy, Magnetochemistry, 4, 12, https://doi.org/10.3390/magnetochemistry4010012, 2018. a, b, c
Zwahlen, C., Legault, P., Vincent, S. J. F., Greenblatt, J., Konrat, R., and Kay, L. E.: Methods for Measurement of Intermolecular NOEs by Multinuclear NMR Spectroscopy: Application to a Bacteriophage λ N-Peptide/boxB RNA Complex, J. Am. Chem. Soc., 119, 6711–6721, https://doi.org/10.1021/ja970224q, 1997. a