the Creative Commons Attribution 4.0 License.
the Creative Commons Attribution 4.0 License.
 | 01 Jul 2022
The effect of spin polarization on double electron–electron resonance (DEER) spectroscopy
Sarah R. Sweger
Vasyl P. Denysenkov
Lutz Maibaum
Thomas F. Prisner
Double electron–electron resonance (DEER) spectroscopy measures the distribution of distances between two electron spins in the nanometer range, often on doubly spin-labeled proteins, via the modulation of a refocused spin echo by the dipolar interaction between the spins. DEER is commonly conducted under conditions where the polarization of the spins is small. Here, we examine the DEER signal under conditions of high spin polarization, thermally obtainable at low temperatures and high magnetic fields, and show that the signal acquires a polarization-dependent out-of-phase component both for the intramolecular and intermolecular contributions. For the latter, this corresponds to a phase shift of the spin echo that is linear in the pump pulse position. We derive a compact analytical form of this phase shift and show experimental measurements using monoradical and biradical nitroxides at several fields and temperatures. The effect highlights a novel aspect of the fundamental spin physics underlying DEER spectroscopy.
- Article
(2107 KB) - Full-text XML
-
Supplement
(738 KB) - BibTeX
- EndNote


Double electron–electron resonance (DEER) spectroscopy is a pulse electron paramagnetic resonance (EPR) technique utilized for determining distances between spin centers on a nanometer scale (Milov et al., 1981; Larsen and Singel, 1993; Milov and Tsvetkov, 1997). The technique has seen use with studies of organic polymers but is most commonly used for structural studies in large biomolecules, such as proteins and nucleic acids (Schiemann and Prisner, 2007; Tavenor et al., 2014; Duss et al., 2014; Manglik et al., 2015; Verhalen et al., 2017; Barth et al., 2018; Dastvan et al., 2019; Evans et al., 2020; Born et al., 2021). DEER resolves the full distribution of distances in an ensemble of proteins, making it possible to directly quantify protein conformational ensembles (Larsen and Singel, 1993; Jeschke and Polyhach, 2007; Jeschke, 2012).
DEER measures the amplitude of a spin echo as a function of the position of one or more pump pulses. The magnetic dipole–dipole coupling between spins leads to a modulation of the echo amplitude whose frequency is dependent on the magnitude of the coupling. The majority of DEER experiments are conducted on samples of dilute and uniformly distributed spin pairs on doubly labeled molecules or complexes. These samples give rise to an overall signal that is a product of an oscillatory intramolecular signal and an exponentially decaying intermolecular signal (Fig. 1a). The latter is often referred to as the background signal.
The behavior of the spins depends upon the temperature and magnetic field, which together determine the magnitude of thermal polarization (Fig. 1b). DEER spectroscopy using nitroxide radicals is often conducted at 50–70 K and 0.3–1.2 T. Under these experimental conditions, the Zeeman interactions are smaller than the thermal energy, and consequently the thermal spin polarization is small. Larger-than-thermal polarization can be generated utilizing photo-excited molecular triplet states (Di Valentin et al., 2016; Dal Farra et al., 2020; Krumkacheva et al., 2019) or optical pumping in NV centers, which have a triplet ground state (Takahashi et al., 2008; Stepanov and Takahashi, 2016; Sushkov et al., 2014; Shi et al., 2015). Non-thermal spin polarizations are known to lead to out-of-phase electron spin echo amplitude modulation (OOP-ESEEM) in spin-correlated radical pairs (Salikhov et al., 1992; Tang et al., 1994).
This work considers DEER signals under significant thermal spin polarization as obtainable at low temperatures and high magnetic fields. Expanding on previous work (Marko et al., 2013), we show theoretically that the out-of-phase components of both the intramolecular and intermolecular signals are polarization-dependent. In particular, we derive a closed-form analytical expression for the intermolecular signal that reveals a polarization-dependent phase factor. We demonstrate this experimentally with monoradical and biradical nitroxide samples at several fields and temperatures.
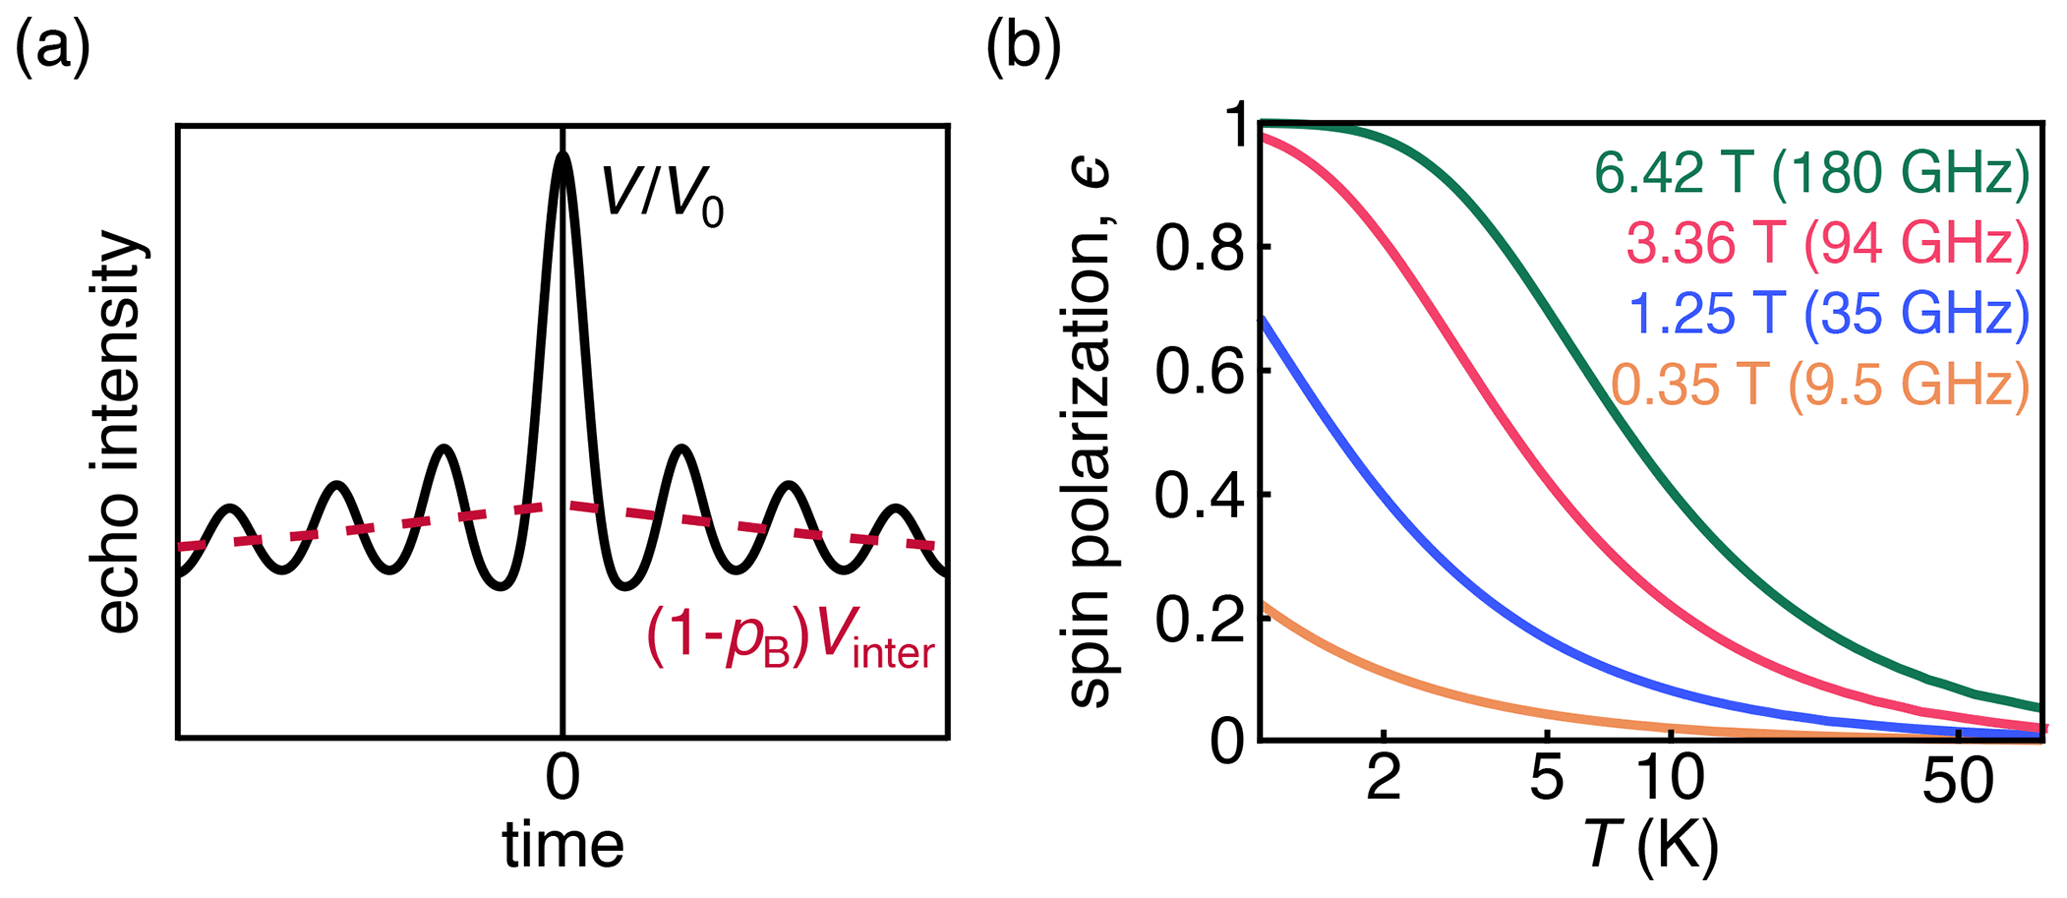
Figure 1(a) DEER signal (black) with the oscillatory intramolecular signal; the contribution from the exponentially decaying intermolecular signal is shown in pink. (b) Dependence of thermal spin polarization ϵ on magnetic field and temperature.
The paper is structured as follows. Section 2 steps through the analytical spin dynamics model showing the polarization-dependent echo phase, beginning from a two-spin system and then expanding to a uniform spatial distribution of spins. Section 3 describes experimental details, and Sect. 4 presents and discusses the experimental results. Section 5 concludes.
In this section, we derive the analytical form of the intermolecular DEER signal, without the usual assumption of the high-temperature limit. The derivation within the high-temperature limit and the initial analytical expression for the intramolecular DEER signal of an isolated spin pair beyond the high-temperature limit has previously been reported (Milov et al., 1973; Marko et al., 2013; Dal Farra et al., 2019; Maryasov et al., 1982) and is derived in Sect. S1 in the Supplement. Section S1 in the Supplement derives the three-pulse DEER signal, the result of which is identical to the four-pulse DEER model, and thus the rest of the discussion will refer to the four-pulse DEER model to remain consistent with the experimental results.
The analysis is based on the standard model for four-pulse DEER of a frozen dilute solution of doubly spin-labeled molecules. We define two spectrally non-overlapping and separately addressable subsets of electron spins, A and B. (The sample also contains spins not affected by any pulses due to the broad EPR spectrum, particularly at high fields; we denote them as C spins.) The A spins are manipulated via pulses at the probe frequency, ωA, while the B spins are inverted via a pulse at the pump frequency, ωB. DEER measures the amplitude V(t) of the refocused electron spin echo as a function of the position in time of the pump pulse, t. It is given by
The echo amplitude is a product of an overall amplitude, V0, a modulation function due to the intramolecular spin pairs, Vintra(t), and an intermolecular modulation function, Vinter(t), containing the contributions from spin pairs with spins on different molecules.
For an individual pair of one A spin located at position rA and one B spin located at rB (not necessarily on the same molecule), the DEER signal is (Marko et al., 2013)
Here, is the inter-spin distance vector, and ω is the dipolar coupling frequency
with the dipolar constant
where μ0 is the magnetic constant, μB is the Bohr magneton, ge is g value of the free electron, ℏ is the reduced Planck constant, and z is the unit vector along the direction of the applied magnetic field. For systems with g values differing from ge, the respective g values can be used instead (Abdullin et al., 2019; Bowen et al., 2016). In Eq. (2), pB is the inversion efficiency of the pump pulse, and ϵ is the polarization of the B spins, ranging between 0 and 1. For a spin-, the polarization at thermal equilibrium is
where Nβ and Nα are the populations of the ground and excited states, respectively, B is the magnetic field strength, kB is the Boltzmann constant, and T is the temperature. The dependence of the thermal polarization on B and T is shown in Fig. 1b. Equation (2) is derived under the assumption that the dipolar coupling frequency is small compared to the difference in resonance frequencies between the two spins. Equation (2) is the standard in-phase DEER signal with an additional polarization-dependent out-of-phase sin term that is proportional to ϵ and therefore significant at low temperatures and high magnetic fields or in the presence of spin hyperpolarization.
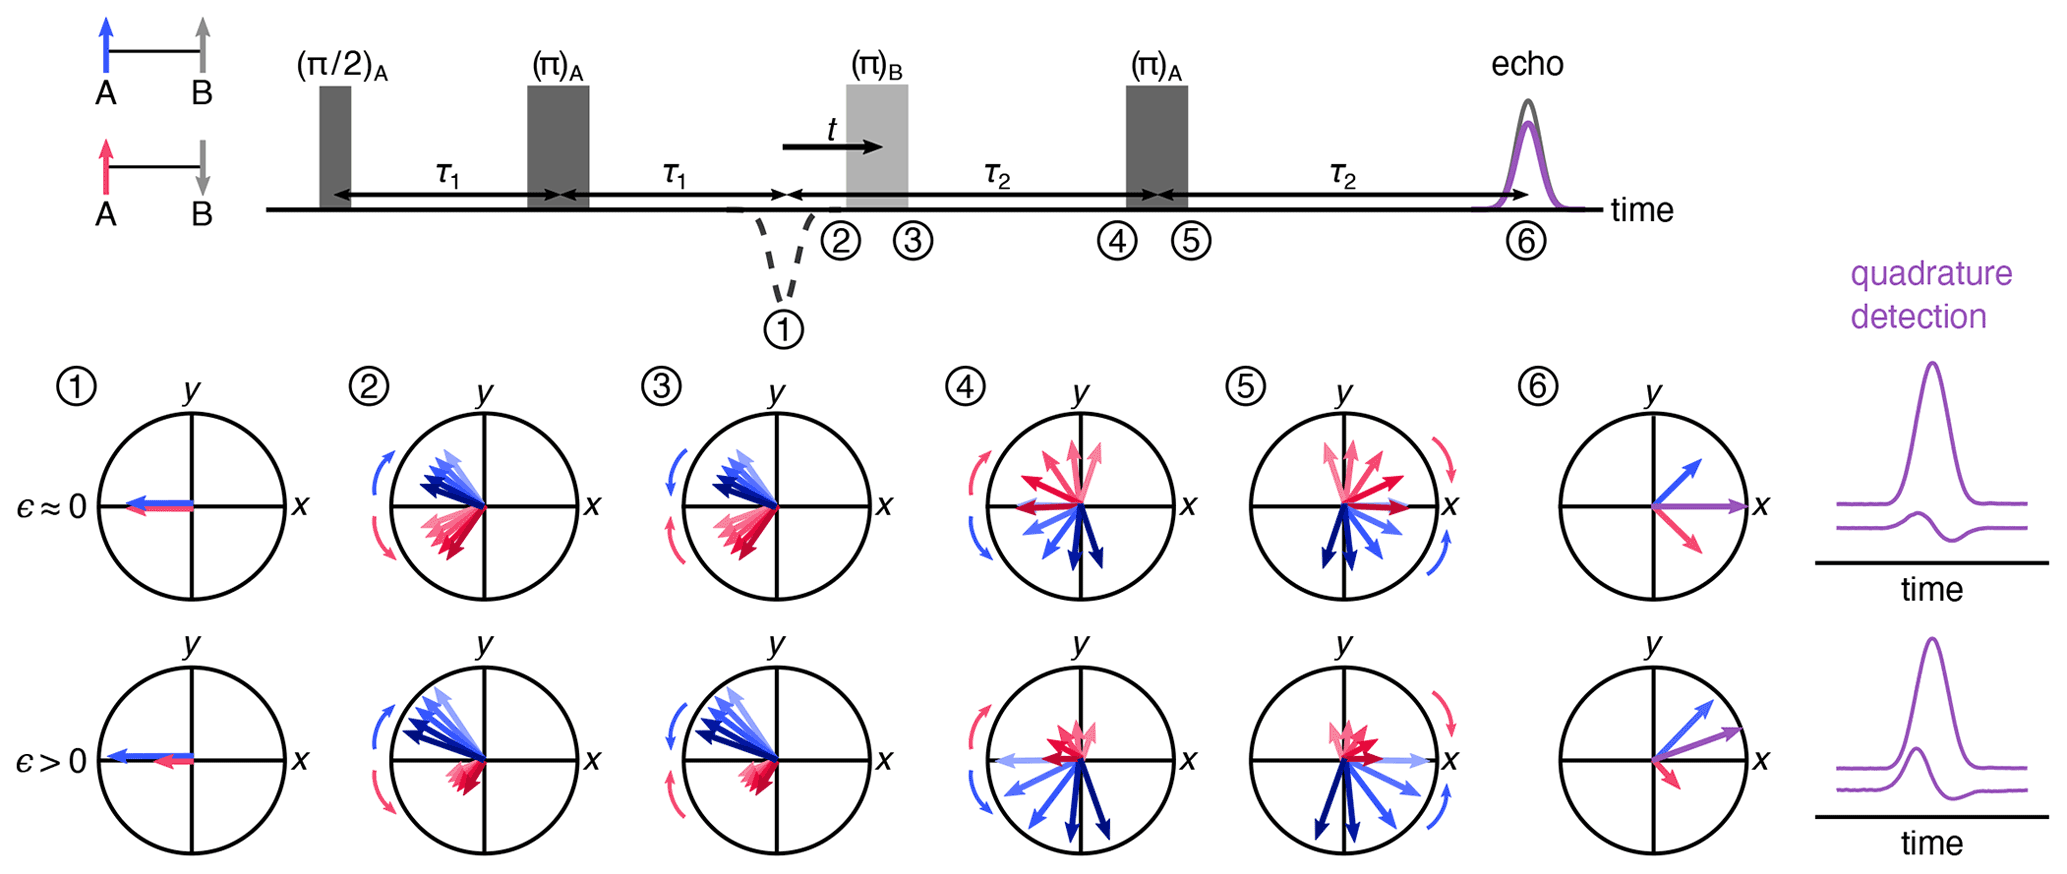
Figure 2Vector model of the spin movement along the four-pulse DEER sequence. Cases of low- and high-polarization values are shown where the numbers indicate the vector picture at a given point in time during the pulse sequence. The vectors indicate the two sub-populations of A spins where those next to up B spins are colored blue and those next to down B spins are pink. The length of the arrows indicates the population. The overall magnetization is a sum of the two sub-populations, shown in purple. The respective echoes for low and high spin polarization values are shown on the right.
Figure 2 uses a vector model in the rotating frame to visualize the dynamics of A spins through the four-pulse DEER sequence, illustrating how the polarization affects the echo phase. The vectors indicate the two sub-ensembles of A spins, one where the neighboring B spin is in the state (blue) and the other where it is in the state (pink). The lengths of the arrows indicate the respective populations. The first two pulses of the sequence form an A-spin echo at time point 1, with both A-spin sub-ensembles refocused with −x phase. As time passes, the spins precess and de-phase due to a distribution of precession frequencies. This distribution is indicated by a set of arrows in varying shades, darker indicating higher frequency. The mean precession frequencies of the two sub-ensembles differ by the dipolar coupling frequency ω. The pump pulse flips the B spins. This leaves all A-spin phases unaffected but shifts the frequencies of the two A-spin sub-ensembles in opposite directions by ±ω, so that the two sub-ensembles now accumulate phase in reversed directions while continuing to de-phase as before the pulse. The final π pulse on the A spins rotates both sub-ensembles around the y axis, and after evolution for τ2, they refocus to give two echoes with opposite phases. The measured echo is proportional to the vector sum of these two sub-echoes. In the high-temperature regime (ϵ≈0, top), the populations of the two sub-ensembles are equal, and therefore the echo has a pure x phase (in-phase), with the quadrature component (y phase) integrating to zero. In the presence of significant polarization (ϵ>0), the two sub-echoes have significantly different amplitudes, and the overall echo phase is rotated from x, yielding a non-zero quadrature (out-of-phase) component.
The average of VAB over a uniform orientational distribution of A–B spin pairs with fixed r is
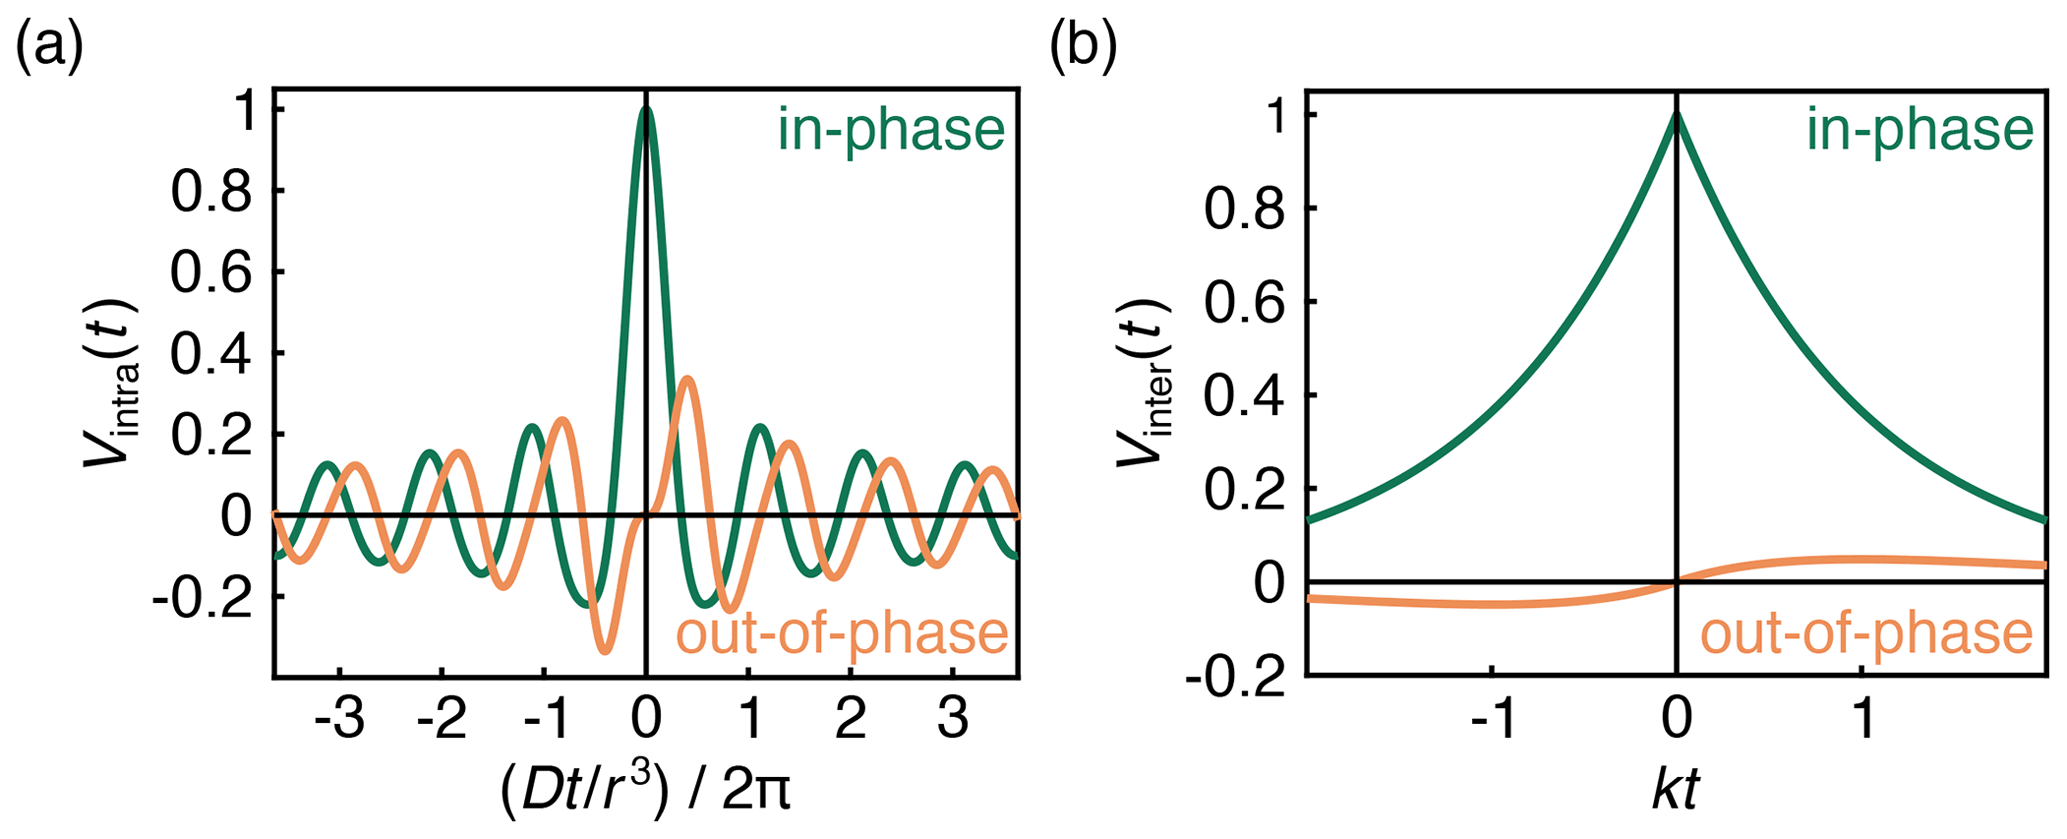
with and . FC and FS are the Fresnel cosine and sine integral functions, respectively, which for imaginary arguments (z is imaginary for t<0) have the properties FC(ai)=i FC(a) and . The in-phase (real) and out-of-phase (imaginary) components of this signal are shown in Fig. 3a.
For a uniform, random, spatial distribution of B spins in a sample, the signal is a product of all individual VAB signals starting from Eq. (2), additionally averaged over all B-spin configurations:
Here, NB is the number of B spins in a configuration, and rb is the vector from the A spin to the bth B spin. To arrive at the product form, the dipolar couplings among B spins are neglected. A somewhat involved derivation (spelled out in Sect. S2) shows that Eq. (7) evaluates to
where
The first factor in Eq. (8) is an exponential decay function, as has been derived and observed before. The decay rate constant k depends on the B-spin concentration cB and on the inversion efficiency pB. The second factor is an additional hitherto unappreciated phase factor with a phase that grows linearly with t and is proportional to the spin polarization ϵ. This phase factor leads to a non-zero out-of-phase signal for t≠0 as long as the spin polarization ϵ is large enough. The signal is plotted in Fig. 3b. Equation (8) was also confirmed numerically using Monte Carlo simulations (Fig. S1 in the Supplement).
The extrema in the out-of-phase part of Vinter(t) are located at
At these points, the magnitude of Vinter has decayed to . These time points depend only on concentration and inversion efficiency, not on polarization. Numerically, these quantities are related via
At t=tOOP, the out-of-phase amplitude of the intermolecular signal is
At high temperatures and low fields, ϵ≈0, and the out-of-phase component vanishes. The slope around t=0 is dictated by the degree of polarization. Even at full polarization, the amplitude of the out-of-phase component is small (Fig. 3b), in contrast to that of an isolated A–B pair (Fig. 3a), where the out-of-phase signal reaches ≈0.335ϵ at .
The Fourier transform of Eq. (8) is a Lorentzian lineshape
centered at angular frequency and a full width at half maximum of fwhm=2k. The frequency ω is proportional to the polarization, the spin concentration, and the inversion efficiency. For cB=1 mM, pB=1, and ϵ=1, this gives a frequency of MHz and a line width of MHz.
3.1 Q-band DEER
2,2,6,6-Tetramethylpiperidine-1-oxyl (TEMPO) was obtained from Sigma-Aldrich and used to create an approximately 1 mM solution in 50:50 (w:w) D2O and d8-glycerol. For measurements at Q-band, 30–50 µL of sample was syringed into 1.50 mm outer diameter (O.D,) and 1.1 mm inner diameter (I.D.) quartz tubes (Sutter Instrument). Q-band experimental data were measured on a Bruker Elexsys E580 spectrometer equipped with a Bruker D2 dielectric resonator at 33.9 GHz, 1.21 T, at 11 and 40 K. The microwave power was amplified with a 390 W Applied Systems Engineering TWT amplifier. For both temperatures, the measurements were conducted at the field value that gave the maximum echo amplitude at the pump frequency. Optimal pulse lengths were determined using a Rabi nutation experiment. For the 11 K data, a standard four-pulse DEER sequence was used with rectangular observer pulses at 33.842 GHz, the and π pulses being 22 and 44 ns and a sech/tanh pump pulse applied at 33.922 GHz with a 200 ns length and 80 MHz bandwidth. For the 40 K data, rectangular observer pulses with 22 and 44 ns lengths were applied at 33.828 GHz, and a sech/tanh pump pulse was applied at 33.908 GHz with a 200 ns length and 80 MHz bandwidth. Experiments at both temperatures utilized a 64-step phase cycle (Tait and Stoll, 2016). The values for τ1 and τ2 were 4000 and 4200 ns, respectively, for the 11 K data and 3000 and 3200 ns for the 40 K data. To keep the sample at thermal equilibrium for each echo, the spectrum was collected with one shot per point and a 1 s shot repetition time (SRT) at 11 K. At 40 K, the data were collected with 10 shots per point and a 3 ms repetition time.
3.2 G-band DEER
4-Hydroxy-2,2,6,6-tetramethylpiperidine-1-oxyl (TEMPOL) was obtained from Sigma-Aldrich Chemie GmbH and used to create an approximately 1.0 mM solution with 45:55 D2O : d8-glycerol. The homo-biradical nitroxide was synthesized according to the procedure previously published (Bode et al., 2007), and 0.16 mg was dissolved in 0.61 mL of deuterated toluene, giving a final concentration of 0.25 mM, corresponding to 0.5 mM total spin concentration. The solution was placed in a 0.55 mm O.D. 0.4 mm I.D. quartz sample capillary that resulted in 250 nL of sample volume inside the TE011 cylindrical cavity resonator. Samples were frozen after insertion into the cryostat. The G-band experiment were performed on a home-built pulse EPR spectrometer operating at 180 GHz, 6.42 T, and temperatures of 5, 40, and 50 K (Rohrer et al., 2001; Hertel et al., 2005). For the monoradical experiments, a standard four-pulse DEER sequence with rectangular pulses was used with the observer and π pulses being 36 and 58 ns, respectively, while the pump pulse was 58 ns with a frequency offset of +50 MHz. The values for τ1 and τ2 were 4000 and 5000 ns, respectively. Each DEER trace has 80 points and was recorded with 10 shots per point with 500 ms SRT for 5 K and 100 shots per point with 6 ms SRT for 40 K. This repetition time value was chosen as a 4-fold longer time with respect to the T1 value for nitroxide radicals in deuterated glycerolD2O solution at 6.4 T and 40 K. For the experiments at 5 K, the repetition time was chosen according to the saturation recovery experiment (Fig. S5). Each trace was phased individually. For the biradical experiments, a standard four-pulse DEER sequence with rectangular pulses was used with the observer and π pulses being 48 and 90 ns, respectively, while the pump pulse was 80 ns with a frequency offset of +80 MHz. The values for τ1 and τ2 were 500 and 5000 ns, respectively. Each DEER trace has 80 points and was recorded with 10 shots per point with repetition times of 6 ms at 50 K and 500 ms at 5 K.
To experimentally observe the polarization-dependent phase of the DEER signal, we performed DEER experiments on a 1 mM TEMPO sample in D2O : d8-glycerol at several magnetic fields and temperatures. The results are shown in Fig. 4. To fit the model from Eq. (8) to these data, we extended the model to
where the fit parameters are the overall signal amplitude V0, the decay rate constant k, the zero-time shift t0, and an additional phenomenological fit factor qB discussed below. ϵ was calculated from the temperature and magnetic field using Eq. (5) and is given in Fig. 4.
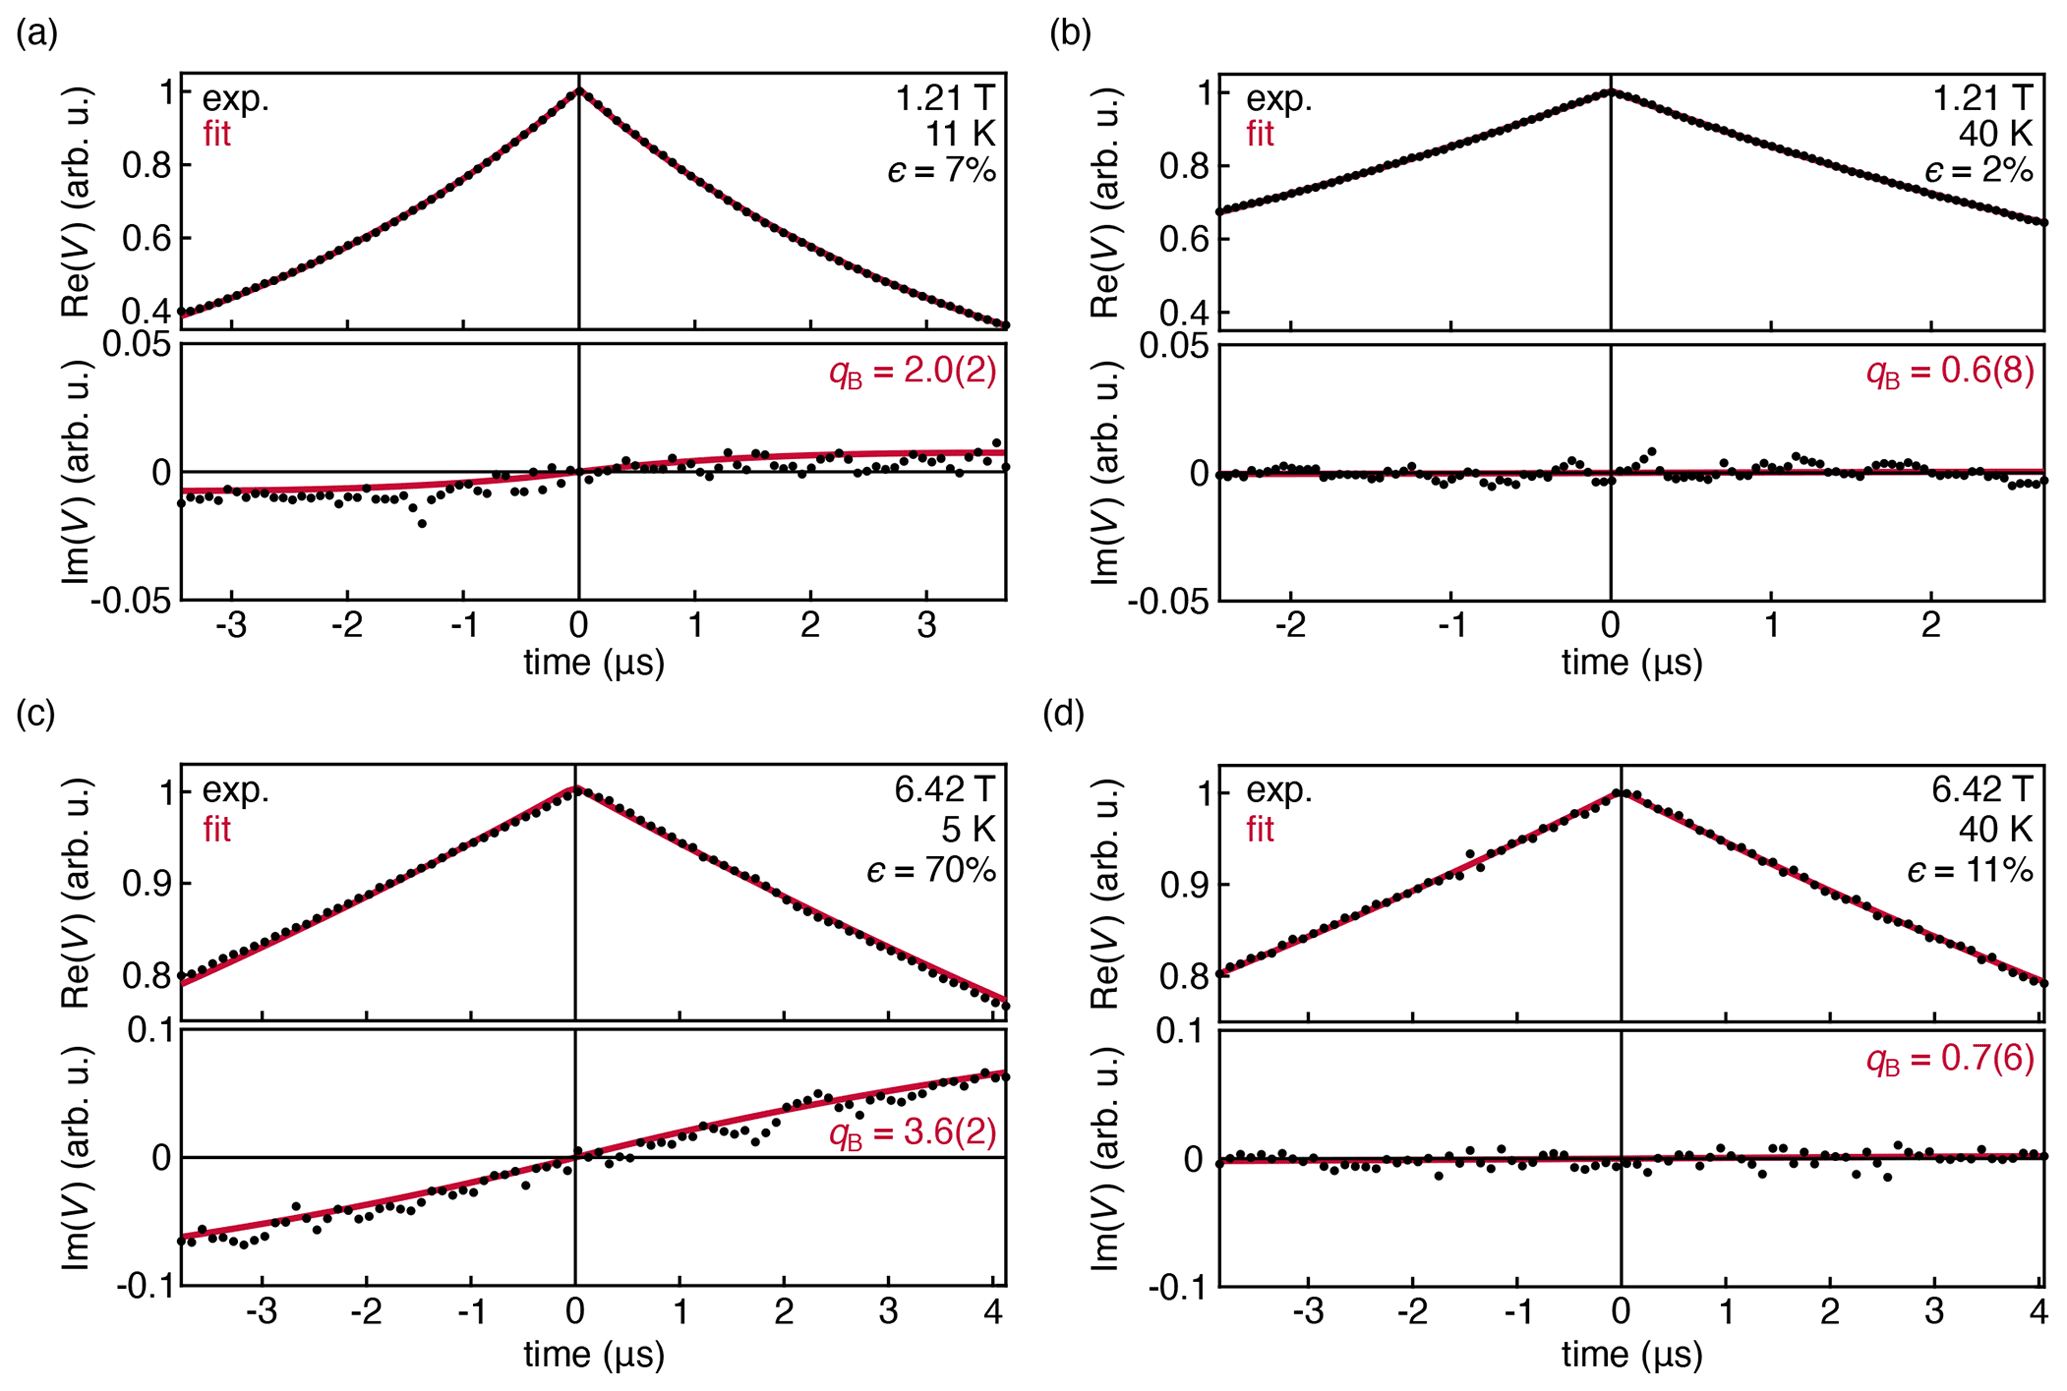
Figure 4Experimental DEER traces for a 1.0 mM solution of TEMPO in 50:50 D2O : d8-glycerol, measured at 33.9 GHz at 11 K (a) and 40 K (b). Experimental DEER traces for a 1.0 mM solution of TEMPOL in 45:55 D2O : d8-glycerol, measured at 180 GHz and 6.42 T at 5 K (c) and 40 K (d). The data were fit with Eq. (14) and are shown with their 95 % confidence interval in parentheses. All fit parameters are shown in Table S1 in the Supplement.
Figure 4a shows the DEER decay measured at 33.9 GHz, 1.21 T, and 11 K, where the thermal polarization is about 7 %. The out-of-phase signal is small but observable. The shape of the observed out-of-phase signal is reproduced by the fit. However, it grows with t, more quickly than predicted by theory. This is indicated by the fitted value qB≈2.0(2), whereas we expect qB=1 from theory (Eq. (8). When the temperature is raised to 40 K, Fig. 4b, thermal polarization is reduced significantly to 2 %, and the out-of-phase signal flattens and is not observable as expected.
Figure 4c and d show the DEER decays measured at 180 GHz and 6.42 T at 5 and 40 K, where the thermal polarization is 70 % and 11 %, respectively. Again, the model of Eq. (14) was fit to the data. In the 5 K data, the out-of-phase signal is now clearly visible, and the experiment again confirms the shape predicted by the model, with a discrepancy in the phase rotation rate (qB≈3.6(2)). There is also a very slight asymmetry in the in-phase signal that is not captured by the model. At 40 K, the amplitude of the out-of-phase signal is negligible and the in-phase signal is symmetric, consistent with the theoretical prediction.
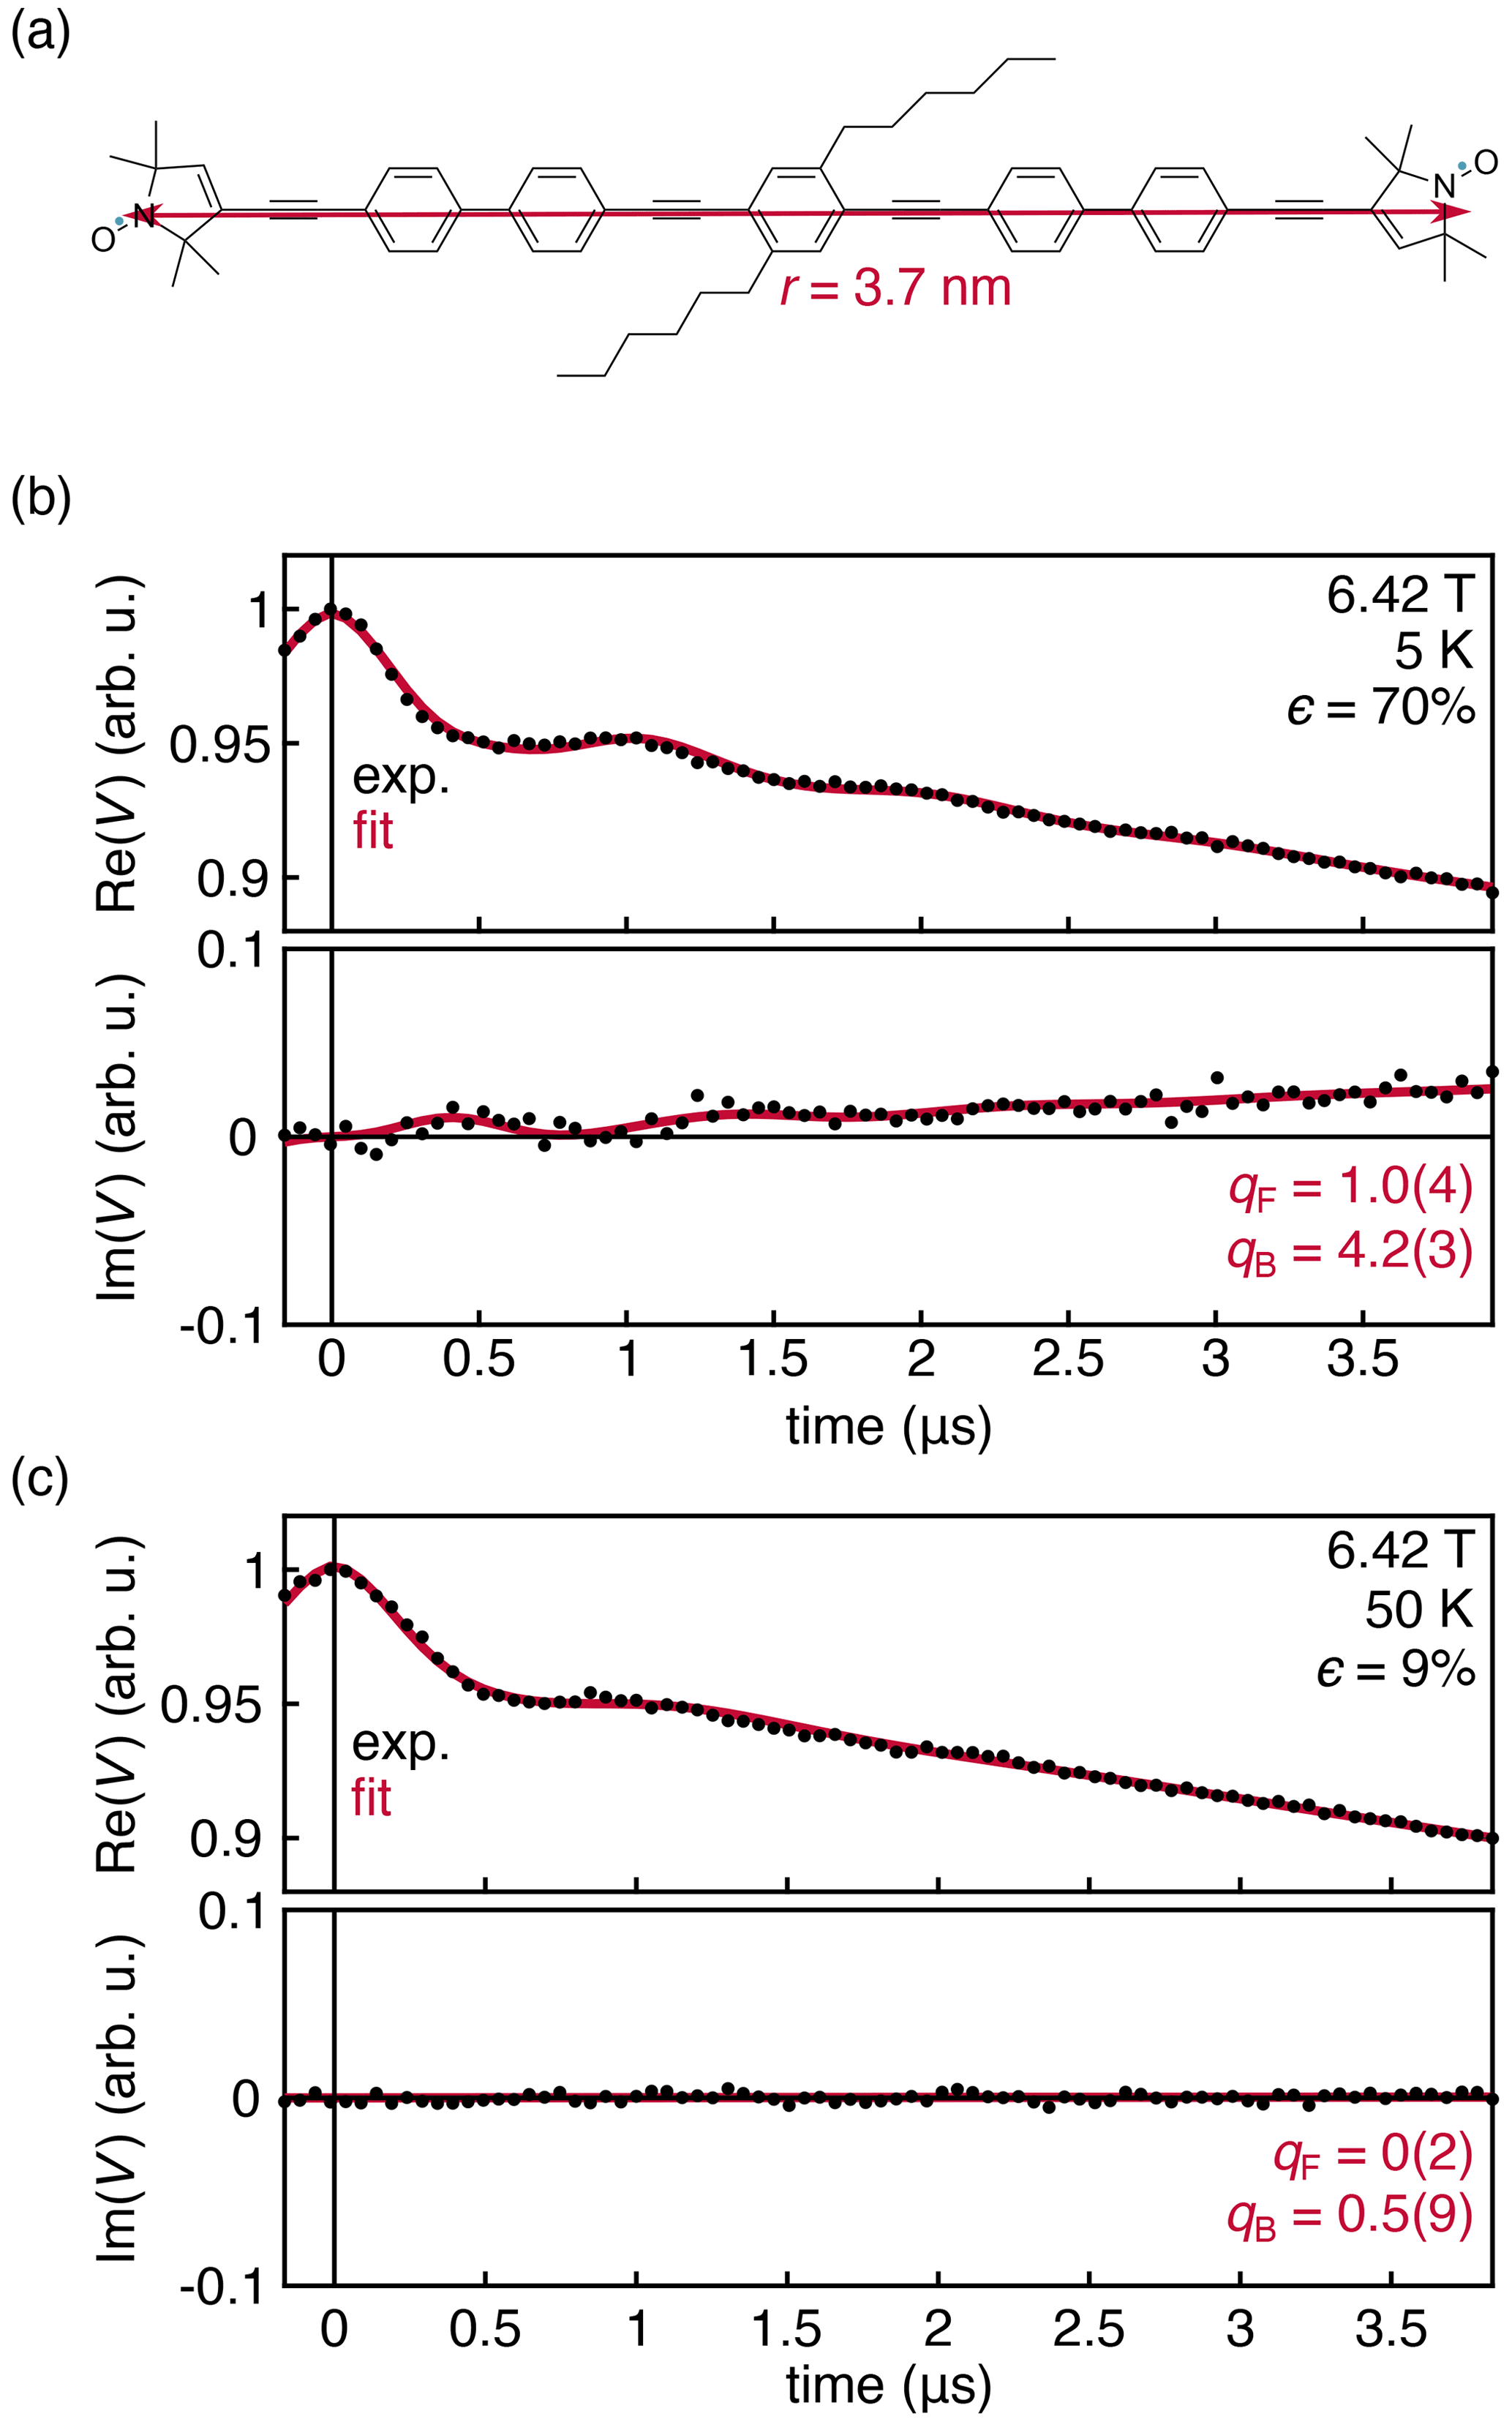
Figure 5(a) Nitroxide biradical with an inter-spin distance of 3.7 nm (Schöps et al., 2015, 2016). Experimental DEER traces for a 0.25 mM solution of the biradical in deuterated toluene, measured at 180 GHz and 6.42 T at 5 (b) and 50 K (c). The data were fit with Eqs. (14)–(16). Fit parameters are shown with their 95 % confidence interval. All fit parameters are listed in Table S2.
The experimental results in Fig. 4 were obtained with a monoradical solution. To further investigate the origins of the observed deviation of the intermolecular contribution from the theoretical prediction, we measured a frozen solution of the nitroxide biradical shown in Fig. 5a at 180 GHz, 6.42 T, and 5 and 50 K. Under these conditions, the thermal polarization is 70 % and 9 %, respectively. The results are shown in Fig. 5. The intermolecular signal was fit according to Eq. (14), and the intramolecular signal was fit using an adaptation of Eq. (6) that incorporates an additional phenomenological factor qF, analogous to qB in Eq. (14).
This was added to verify experimental temperature and to test whether the observed discrepancy in the intermolecular background signals (qB≠1) is also present in the intramolecular signal. The intra-biradical distance distribution was modeled as a Gaussian distribution
with the peak position r0 and the standard deviation w as fit parameters.
The experimental data are shown in Fig. 5. The dipolar oscillations are clearly resolved, and the theory once again matches the overall shape of the experimental data with a discrepancy for the intermolecular signal captured by the fit factor qB=4.2(3). However, this discrepancy does not appear for the intramolecular signal, where the fit factor of qF=1.0(4) confirms both that the sample temperature is 5 K ± 0.1 K and that the theoretical expression in Eq. (6) is correct. As the temperature is raised to 40 K and the polarization value drops significantly, the out-of-phase component disappears, consistent with theory.
Together, the experiments reveal that the theory predicts the out-of-phase component of the intramolecular signal quantitatively but underpredicts it for the intermolecular contribution. Experiments also show a very slight polarization-dependent asymmetry in the intermolecular signal that is not captured by theory.
A range of experimental and theoretical factors was taken into consideration to potentially explain the origin of the observed discrepancy, the results of which are provided in the SI. Many instrumental factors can be excluded based on control experiments and on the data from the biradical. Pump–probe pulse excitation band overlap for the experimental conditions used (observer frequency 180 000 GHz, pump frequency 180 050 GHz, pulse widths 40–80 ns) is no more than approximately 2.7 % (Fig. S3). This overlap is too small to create significant shifts in the data. Gain imbalance between in-phase and out-of-phase detectors was determined to be insignificant, as the experiment run with the detector phase rotated by 90∘ yielded no visible changes in the data (Fig. S4). Experiments were run with detection both on and off the echo to verify that the observed signal arises from the echo and not the background of the resonator (Fig. S5). The detector phase was shown to drift slowly over the course of the experiments. This was accounted for by running the traces with as short of an acquisition time as possible and phasing each trace individually. However, it appears that this is not the origin of the observed discrepancy as traces with backwards and forward sweeps of t give approximately the same result (Fig. S6). Temperature drifts were found to be insignificant, as an temperature sensor near the resonator indicated temperature stability within ±0.1 K during the experiment. The fact that theory fits the out-of-phase component of the intramolecular signal in Fig. 5b well excludes many potential instrumental origins of the discrepancy between theory and the intermolecular signal.
Samples were run at sufficient cryoprotectant levels to eliminate aggregation as a source of error, at least for the experiments utilizing a monoradical sample (Canarie et al., 2020). For all 180 GHz data, samples were not frozen rapidly outside the spectrometer but rather after being placed into the resonator. For the biradical data, field sweeps of a sample frozen outside and one frozen in the resonator showed little difference (Fig. S8), further indicating that aggregation is not likely a major source of error.
Possible saturation effects were tested by running a saturation recovery experiment showing that a 500 ms repetition time is sufficiently slow so as to not saturate the A spins (Fig. S7). One interesting possibility could be the occurrence of selective saturation. If the saturation is selective with respect to the A-spin sub-populations, then, if the less populated A-spin sub-population is saturated more, the echo phase shift would increase.
The possibility of spectral diffusion of the A spins can be excluded from consideration as the cause of the discrepancy, as it would decrease the overall signal equally in both the in-phase and out-of-phase signals. Spectral diffusion of the B spins is expected to have no effect on DEER. One possibility is that there is selective spectral diffusion, affecting the two sub-populations of A spins differently, though this is unlikely given the excitation profiles of the pulses shown in Fig. S3.
The discrepancy may be due to flip–flop terms of the A–B or B–B spin coupling Hamiltonians that are neglected in the current theory. Inclusion of the A–B flip–flop term has been found to be important for the correct description of DEER signals from Gd(III)–Gd(III) spin pairs with short distances (Dalaloyan et al., 2015; Manukovsky et al., 2017). For a spin concentration c=0.1 mM cm−3 (obtained from 1 mM total concentration and 10 % excitation), the modal nearest-neighbor distance between spins is about 13 nm (Fig. S2), which corresponds to a dipolar coupling frequency of less than 0.05 MHz. The flip–flop term only matters if the dipolar coupling frequency between two adjacent spins is on the same order as or larger than their resonance frequency difference Δω. Since A and B spins are frequency-separated by at least 50 MHz (see Materials and methods), the A–B flip–flop terms are negligible. In addition, the accurate model fit of the intramolecular signal in Fig. 5b (with qF=1) confirms that A–B flip–flop terms are irrelevant. Since in the G-band experiments the excitation bandwidth of the pump pulse is about MHz, two adjacent B spins have a typical Δω on the order of a few megahertz. Therefore, the B–B flip–flop terms are likely of minor relevance, although it is not certain that they are negligible.
It is possible that demagnetization effects play a role in the observed discrepancy. In samples with high bulk concentrations of polarized spins, the resonance frequencies of individual spins are shifted due to the presence of a non-negligible dipolar field due to spins that are not excited by either the observer or the pump pulses. This field leads to frequency shifts (Edzes, 1990; Marion et al., 2007). Frequency shifts up to 11 MHz have been observed in a crystal of the organic radical 1,3-bisdiphenylene-2-phenylallyl with EPR at 240 GHz and 8.56 T (Wilson et al., 2020). In our samples, the concentration of these spins (which might be termed C spins) is about 1 mM, so the demagnetization field and any associated effects are likely negligible.
Low temperatures and high fields lead to substantial thermal spin polarization. We showed theoretically that this leads to a hitherto unappreciated and unobserved additional phase factor in the DEER signal from a background of a uniform three-dimensional distribution of spins, resulting in a non-zero out-of-phase signal whose amplitude is proportional to the spin polarization. Experimental data, over a range of thermal spin polarizations, i.e., at several temperatures and magnetic fields, for both monoradical and biradical samples confirm the theoretical model describing this polarization-dependent phase factor.
The theory quantitatively matches the experiments for the intramolecular DEER signal from a biradical, and the observed amplitude of the out-of-phase component of the intermolecular signal contribution is more intense than predicted by current theory. The origin of this discrepancy is unclear. One possibility is that B–B flip–flop terms are responsible. To test this experimentally, spin concentration must be lowered. However, it is unfeasible with current instruments to collect data at much lower concentrations than those shown here, since this would also necessarily require much longer trace lengths to capture a majority of the signal decay. Beyond the reduced number of spins, the signal-to-noise ratio would be additionally degraded by de-coherence. Extending the model beyond the dilute limit to a fully coupled spin network to examine the impact of B–B spin coupling would be the next step in narrowing down the origin of the discrepancy.
Although derived for the case of two spins-, the model is also applicable to high-spin systems as long as only one transition of the pump spin is excited by the pump pulse.
The polarization-phase factor is negligible for DEER experiments performed at 50–80 K and 0.35–1.25 T, temperatures and fields typically used for DEER experiments of nitroxide-labeled proteins, since the spin polarization is at most 1.6 % under these conditions. However, the results are potentially relevant for measurements at lower temperatures and higher fields (such as for Gd spin labels measured at 10 K and the W band) and for situations with strong non-thermal polarization such as photo-induced excited-state triplets and optically pumped ground-state triplets.
The EPR data used in the main text and Supplement are available at https://doi.org/10.5281/zenodo.6537282 (Sweger et al., 2022).
The supplement related to this article is available online at: https://doi.org/10.5194/mr-3-101-2022-supplement.
SRS, TFP, and StS designed the research. SRS and VPD performed all the experiments. SRS analyzed the data. SRS, LM, and StS developed the theory. SRS and StS wrote the manuscript.
At least one of the authors is a member of the editorial board of Magnetic Resonance. The peer-review process was guided by an independent editor, and the authors also have no other competing interests to declare.
Publisher’s note: Copernicus Publications remains neutral with regard to jurisdictional claims in published maps and institutional affiliations.
We thank Thomas Stoll (University of Lorraine, France) for advice on handling the divergence in the sin integral (see Supplement).
This research has been supported by the National Science Foundation (grant nos. CHE-1452967 and CHE-2154302) and the National Institutes of Health (grant nos. R01 GM125753 and S10 OD021557).
This paper was edited by Kong Ooi Tan and reviewed by Nino Wili and one anonymous referee.
Abdullin, D., Brehm, P., Fleck, N., Spicher, S., Grimme, S., and Schiemann, O.: Pulsed EPR dipolar spectroscopy on spin pairs with one highly anisotropic spin center: the low-spin FeIII case, Eur. J. Chem., 25, 14388–14398, https://doi.org/10.1002/chem.201902908, 2019. a
Barth, K., Hank, S., Spindler, P. E., Prisner, T. F., Tampé, R., and Joseph, B.: Conformational coupling and trans-inhibition in the human antigen transporter ortholog TmrAB resolved with dipolar EPR spectroscopy, J. Am. Chem. Soc., 140, 4527–4533, https://doi.org/10.1016/0009-2614(94)87059-4, 2018. a
Bode, B. E., Margraf, D., Plackmeyer, J., Dürner, G., Prisner, T. F., and Schiemann, O.: Counting the monomers in nanometer-sized oligomers by pulsed electron–electron double resonance, J. Am. Chem. Soc., 129, 6736–6745, https://doi.org/10.1021/ja065787t, 2007. a
Born, A., Soetbeer, J., Breitgoff, F., Henen, M. A., Sgourakis, N., Polyhach, Y., Nichols, P. J., Strotz, D., Jeschke, G., and Vögeli, B.: Reconstruction of coupled intra-and interdomain protein motion from nuclear and electron magnetic resonance, J. Am. Chem. Soc., 143, 16055–16067, https://doi.org/10.1021/jacs.1c06289, 2021. a
Bowen, A. M., Jones, M. W., Lovett, J. E., Gaule, T. G., McPherson, M. J., Dilworth, J. R., Timmel, C. R., and Harmer, J. R.: Exploiting orientation-selective DEER: determining molecular structure in systems containing Cu (II) centres, Phys. Chem. Chem. Phys., 18, 5981–5994, https://doi.org/10.1039/C5CP06096F, 2016. a
Canarie, E. R., Jahn, S. M., and Stoll, S.: Quantitative structure-based prediction of electron spin decoherence in organic radicals, J. Phys. Chem. Lett., 11, 3396–3400, https://doi.org/10.1021/acs.jpclett.0c00768, 2020. a
Dal Farra, M. G., Ciuti, S., Gobbo, M., Carbonera, D., and Di Valentin, M.: Triplet-state spin labels for highly sensitive pulse dipolar spectroscopy, Mol. Phys., 117, 2673–2687, https://doi.org/10.1080/00268976.2018.1503749, 2019. a
Dal Farra, M. G., Martin, C., Bergantino, E., Kandrashkin, Y. E., van der Est, A., and Di Valentin, M.: Electron spin polarization transfer induced by triplet–radical interactions in the weakly coupled regime, Phys. Chem. Chem. Phys., 22, 19982–19991, https://doi.org/10.1039/D0CP03565C, 2020. a
Dalaloyan, A., Qi, M., Ruhtstein, S., Vega, S., Godt, A., Feintuch, A., and Goldfarb, D.: Gd(III)–Gd(III) EPR distance measurements – the range of accessible distances and the impact of zero field splitting, Phys. Chem. Chem. Phys., 17, 18464–18476, https://doi.org/10.1039/C5CP02602D, 2015. a
Dastvan, R., Mishra, S., Peskova, Y. B., Nakamoto, R. K., and Mchaourab, H. S.: Mechanism of allosteric modulation of P-glycoprotein by transport substrates and inhibitors, Science, 364, 689–692, https://doi.org/10.1126/science.aav9406, 2019. a
Di Valentin, M., Dal Farra, M. G., Galazzo, L., Albertini, M., Schulte, T., Hofmann, E., and Carbonera, D.: Distance measurements in peridinin-chlorophyll a-protein by light-induced PELDOR spectroscopy. Analysis of triplet state localization, Biochim. Biophys. Acta Bioenerg., 1857, 1909–1916, https://doi.org/10.1016/j.bbabio.2016.09.008, 2016. a
Duss, O., Yulikov, M., Jeschke, G., and Allain, F. H. T.: EPR-aided approach for solution structure determination of large RNAs or protein–RNA complexes, Nat. Commun., 5, 1–9, https://doi.org/10.1038/ncomms4669, 2014. a
Edzes, H. T.: The nuclear magnetization as the origin of transient changes in the magnetic field in pulsed NMR experiments, J. Magn. Reson., 86, 293–303, https://doi.org/10.1016/0022-2364(90)90261-7, 1990. a
Evans, E. G. B., Morgan, J. L. W., DiMaio, F., Zagotta, W. N., and Stoll, S.: Allosteric conformational change of a cyclic nucleotide-gated ion channel revealed by DEER spectroscopy, Proc. Natl. Acad. Sci. USA, 117, 10839–10847, https://doi.org/10.1021/jp505643w, 2020. a
Hertel, M. M., Denysenkov, V. P., Bennati, M., and Prisner, T.: Pulsed 180-GHz EPR/ENDOR/PELDOR spectroscopy, Magn. Reson. Chem., 23, S248–S255, https://doi.org/10.1002/mrc.1681, 2005. a
Jeschke, G.: DEER distance measurements on proteins, Annu. Rev. Phys. Chem., 63, 419–446, https://doi.org/10.1146/annurev-physchem-032511-143716, 2012. a
Jeschke, G. and Polyhach, Y.: Distance measurements on spin-labelled biomacromolecules by pulsed electron paramagnetic resonance, Phys. Chem. Chem. Phys., 9, 1895–1910, https://doi.org/10.1039/B614920K, 2007. a
Krumkacheva, O. A., Timofeev, I. O., Politanskaya, L. V., Polienko, Y., Tretyakov, E., Rogozhnikova, O. Y., Trukhin, D. V., Tormyshev, V., Chubarov, A., Bagryanskaya, E., and Fedin, M.: Triplet fullerenes as prospective spin labels for nanoscale distance measurements by pulsed dipolar EPR spectroscopy, Angew. Chem. Int. Ed., 58, 13271–13275, https://doi.org/10.1002/anie.201904152, 2019. a
Larsen, R. G. and Singel, D. J.: Double electron–electron resonance spin–echo modulation: Spectroscopic measurement of electron spin pair separations in orientationally disordered solids, J. Chem. Phys., 98, 5134–5146, https://doi.org/10.1063/1.464916, 1993. a, b
Manglik, A., Kim, T. H., Masureel, M., Altenbach, C., Yang, Z., Hilger, D., Lerch, M. T., Kobilka, T. S., Thian, F. S., Hubbell, W. L., Prosser, R., and Kobilka, B.: Structural insights into the dynamic process of β2-adrenergic receptor signaling, Cell, 161, 1101–1111, https://doi.org/10.1016/j.cell.2015.04.043, 2015. a
Manukovsky, N., Feintuch, A., Kuprov, I., and Goldfarb, D.: Time domain simulation of Gd3+–Gd3+ distance measurements by EPR, J. Chem. Phys., 147, 044201, https://doi.org/10.1063/1.4994084, 2017. a
Marion, D. J.-Y., Huber, G., Dubois, L., Berthault, P., and Desvaux, H.: 1H and 129Xe NMR absorption line shapes in the presence of highly polarized and concentrated xenon solutions in high magnetic field, J. Magn. Reson., 187, 78–87, https://doi.org/10.1016/j.jmr.2007.04.003, 2007. a
Marko, A., Denysenkov, V., and Prisner, T. F.: Out-of-phase PELDOR, Mol. Phys., 111, 2834–2844, https://doi.org/10.1080/00268976.2013.807369, 2013. a, b, c
Maryasov, A., Dzuba, S., and Salikhov, K.: Spin-polarization effects on the phase relaxation induced by dipole-dipole interactions, J. Magn. Reson., 50, 432–450, https://doi.org/10.1016/0022-2364(82)90007-5, 1982. a
Milov, A. D. and Tsvetkov, Y. D.: Double electron–electron resonance in electron spin echo: conformations of spin-labeled poly-4-vinylpyridine in glassy solutions, Appl. Magn. Reson., 12, 495–504, https://doi.org/10.1007/BF03164129, 1997. a
Milov, A. D., Salikhov, K. M., and Tsvetkov, Y. D.: Effect of spin dipole–dipole interaction on phase relaxation in magnetically dilute solid bodies, J. Exp. Theor. Phys., 36, 1229–1232, 1973. a
Milov, A. D., Salikhov, K. M., and Shchirov, M. D.: Application of the double resonance method to electron spin echo in a study of the spatial distribution of paramagnetic centers in solids, Phys. Solid State, 23, 565–569, 1981. a
Rohrer, M., Brügmann, O., Kinzer, B., and Prisner, T.: High-field/high-frequency EPR spectrometer operating in pulsed and continuous-wave mode at 180 GHz, Appl. Magn. Reson., 21, 257–274, https://doi.org/10.1007/BF03162406, 2001. a
Salikhov, K. M., Kandrashkin, Y. E., and Salikhov, A. K.: Peculiarities of Free Induction and Primary Spin Echo Signals for Spin-Correlated Radical Pairs, Appl. Magn. Reson., 3, 199–216, https://doi.org/10.1007/BF03166790, 1992. a
Schiemann, O. and Prisner, T. F.: Long-range distance determinations in biomacromolecules by EPR spectroscopy, Q. Rev. Biophys., 40, 1–53, https://doi.org/10.1017/S003358350700460X, 2007. a
Schöps, P., Spindler, P., Marko, A., and Prisner, T.: Broadband spin echoes and broadband SIFTER in EPR, J. Magn. Reson., 250, 55–62, https://doi.org/10.1016/j.jmr.2014.10.017, 2015. a
Schöps, P., Plackmeyer, J., and Marko, A.: Separation of intra-and intermolecular contributions to the PELDOR signal, J. Magn. Reson., 269, 70–77, https://doi.org/10.1016/j.jmr.2016.05.012, 2016. a
Shi, F., Zhang, Q., Wang, P., Sun, H., Wang, J., Rong, X., Chen, M., Ju, C., Reinhard, F., Chen, H., Wrachtrup, J., Wang, J., and Du, J.: Single-protein spin resonance spectroscopy under ambient conditions, Science, 347, 1135–1138, https://doi.org/10.1126/science.aaa2253, 2015. a
Stepanov, V. and Takahashi, S.: Determination of nitrogen spin concentration in diamond using double electron-electron resonance, Phys. Rev. B, 94, 024421, https://doi.org/10.1103/PhysRevB.94.024421, 2016. a
Sushkov, A. O., Lovchinsky, I., Chisholm, N., Walsworth, R. L., Park, H., and Lukin, M. D.: Magnetic resonance detection of individual proton spins using quantum reporters, Phys. Rev. Lett., 113, 197601, https://doi.org/10.1103/PhysRevLett.113.197601, 2014. a
Sweger, S. R., Denysenkov, V. P., Maibaum, L., Prisner, T. F., and Stoll, S.: The effect of spin polarization in DEER spectroscopy. In Magnetic Resonance, Zenodo [data set], https://doi.org/10.5281/zenodo.6537282, 2022. a
Tait, C. E. and Stoll, S.: Coherent pump pulses in double electron electron resonance spectroscopy, Phys. Chem. Chem. Phys., 18, 18470–18485, https://doi.org/10.1039/C6CP03555H, 2016. a
Takahashi, S. and Hanson, R., Van Tol, J., Sherwin, M. S., and Awschalom, D. D.: Quenching spin decoherence in diamond through spin bath polarization, Phys. Rev. Lett., 101, 047601, https://doi.org/10.1103/PhysRevLett.101.047601, 2008. a
Tang, J., Thurnauer, M. C., and Norris, J. R.: Electron spin echo envelope modulation due to exchange and dipolar interactions in a spin-correlated radical pair, Chem. Phys. Lett., 219, 283–290, https://doi.org/10.1016/0009-2614(94)87059-4, 1994. a
Tavenor, N. A., Silva, K. I., Saxena, S., and Horne, S. W.: Origins of structural flexibility in protein-based supramolecular polymers revealed by DEER spectroscopy, J. Phys. Chem. B, 118, 9881–9889, https://doi.org/10.1021/jp505643w, 2014. a
Verhalen, B., Dastvan, R., Thangapandian, S., Peskova, Y., Koteiche, H. A., Nakamoto, R. K., Tajkhorshid, E., and Mchaourab, H. S.: Energy transduction and alternating access of the mammalian ABC transporter P-glycoprotein, Nature, 543, 738–741, https://doi.org/10.1038/nature21414, 2017. a
Wilson, C. B., Edwards, D. T., Clayton, J. A., Han, S., and Sherwin, M. S.: Dressed Rabi oscillation in a crystalline organic radical, Phys. Rev. Lett., 124, 047201, https://doi.org/10.1103/PhysRevLett.124.047201, 2020. a