
the Creative Commons Attribution 4.0 License.
the Creative Commons Attribution 4.0 License.
 | 17 Jul 2026
Optimally controlled nuclear magnetic resonance (NMR) in electrochemistry: Larmor versus nutation frequency selective spin excitation for locally selective NMR experiments
Johannes F. Kochs
Armin J. Römer
Michael Schatz
Matthias Streun
Sven Jovanovic
Rüdiger-A. Eichel
Josef Granwehr
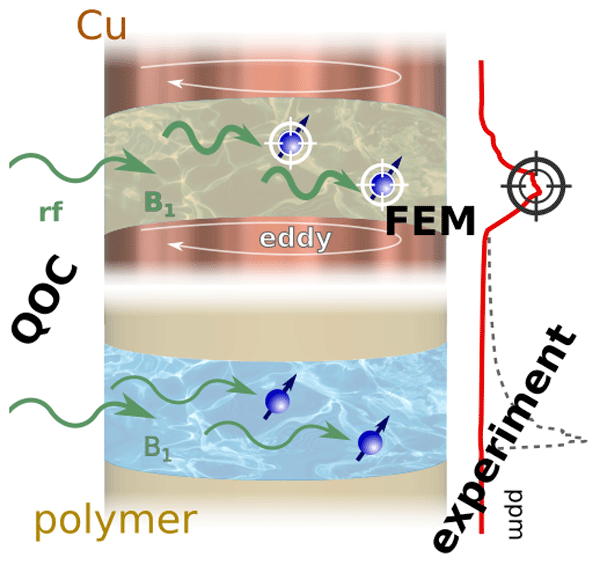
Spectroelectrochemical nuclear magnetic resonance (NMR) experiments are faced with numerous challenges originating from shielding effects and susceptibility gradients in samples, leading to inhomogeneities in the static magnetic fields B0 and the radio frequency (rf) fields B1. Moreover, magnetic feedback caused by eddy currents in conductors can obstruct precise measurements. Previous works have shown that these eddy-current-induced magnetic field distortions can be accurately predicted by finite element method (FEM) simulations. In this work, we present a workflow combining FEM predictions with quantum optimal control (QOC) to tailor custom NMR pulses that exploit specific magnetic field distortions for selective excitation of affected sample regions. The desired selectivity was achieved using pattern pulses optimized for either a particular B1 or Larmor frequency ν0. Experimental validation was performed on a heterogeneous phantom consisting of two cavities filled with two spectroscopically distinguishable liquids, one between copper disks to mimic an electrochemical cell and one between polymer disks as a reference. An over 30-fold suppression of the reference resonance in between polymer compared to the resonance in between copper disks was achieved, demonstrating how QOC-tailored pulses can selectively address FEM-predicted B1 distortions in the vicinity of electrical conductors to achieve spatial selectivity with simultaneous ν0 robustness. It was also demonstrated how QOC-tailored pulses can selectively excite specific ν0 despite B0 distortions, which implies that difficulties with conventional solvent suppression techniques in electrochemical setups can be mitigated using the adjustable robustness of QOC-tailored pulses. The presented approach sets the stage for gradient-free, localized in operando NMR in electrochemistry and material sciences, with the prospect of surface selectivity down to the detection limit of the setup.
- Article
(2810 KB) - Full-text XML
-
Supplement
(4576 KB) - BibTeX
- EndNote


Spectroelectrochemical methods offer valuable, non-invasive in situ and in operando insights into electrochemical transformation processes, such as electrolysis and electrocatalysis. More advanced techniques pave the way to study crystallographic (Bommarito et al., 1992; Huang et al., 2018) and optical (Williamson et al., 2003; Holtz et al., 2014) properties, concentrations (Corson et al., 2020; Jovanovic et al., 2021), chemical environments (Corson et al., 2020; Faid et al., 2020), and metal coordination (Lee et al., 2022) within operating electrochemical cells. A fitting cell design depending on the applied technique is important to optimize accessibility for spectroscopic investigations, i.e., thin-layer cells to minimize solvent and background signal (Zoski, 2007). Spectroelectrochemical nuclear magnetic resonance (NMR) investigations offer additional flexibility through customization of the employed pulse sequences for a given experiment. However, conducting reliable NMR experiments on entire electrochemical cell setups, yielding credible, informative results about electrochemical transformation processes, raises several challenges.
Firstly, incorporating an entire electrochemical setup in an NMR tube including several electrodes (working, counter, reference), liquid electrolyte, and current collectors while maintaining electric contact for applying a potential requires custom-designed setups. A large variety of cell setups have been designed for electrochemical applications, ranging from flow mode and batch mode cells in 5 mm NMR tubes (Richards and Evans, 1975; Jovanovic et al., 2021) to custom battery housings (Pecher et al., 2017; Wolff et al., 2025) and commercial coin cell NMR setups (Walder et al., 2021). Schatz et al. (2022) followed a compromise approach by assembling a flexible NMR setup that yielded reproducible results while simultaneously being easily replicable without demanding special equipment.
Secondly, electrochemical transformation processes are predominantly located at interfaces, and their effectiveness is defined by electrochemical reaction rates and reaction mechanisms, as well as adsorption processes (Hamann and Vielstich, 2005). Standard NMR lacks selectivity, and its sensitivity is strained with regard to detecting surface species, compounded further by a signal that is mostly dominated by solvent and bulk species. While using conventional solvent suppression sequences to minimize solvent signals (McKay, 2009) is challenging in the presence of electrically conductive electrode components, reasonable spatial selectivity was achieved by magnetic resonance imaging (MRI) pulse sequences based on magnetic field gradients for spatial encoding via frequency or phase (Schatz et al., 2023). However, MRI experiments are limited by a compromise between spatial, spectral, and temporal resolution.
Finally, electrochemical cells contain several metallic elements. Electrical conductors locally distort both the static B0 and oscillating B1 field, i.e., radio frequency (rf) field, that NMR relies on, which results in reduced resolution, non-quantitative results, and potential artifacts. The rf modulation impedes the effectiveness of established selective pulse sequences such as BURP, which are not optimized for systems with inherently distorted B1 fields (Geen and Freeman, 1991). However, the local field distortions can be assessed qualitatively and quantitatively by numerical finite element method (FEM) simulations, which are crucial for successful, robust in operando NMR cell development. FEM-based investigations of B0 and B1 fields around electric conductors have correctly reproduced experimental findings of B1 field distortions due to the metallic skin effect (Ilott and Jerschow, 2017; Mohammadi and Jerschow, 2019), as well as the dependence of B1 distortions on the orientation of the conductor (Ilott et al., 2014; Vashaee et al., 2015; Jovanovic et al., 2021).
FEM simulations have also been utilized to validate and optimize uniform B1 distribution within in operando cell setups to study proton exchange membrane (PEM) fuel cells (Zhang et al., 2011), as well as battery applications (Aguilera et al., 2021; Sanders et al., 2022), up to commercial coin cell scales (Walder et al., 2021). Most recently, Schatz et al. (2024) presented a workflow to integrate FEM simulations of B0 and B1 into in operando cell development.
To account for inhomogeneities of either B0, i.e., Larmor frequencies ν0, or B1, i.e., nutation frequency ν1, or both simultaneously, quantum optimal control (QOC) has established itself as a versatile NMR pulse design method, particularly after the emergence of computationally efficient, numerical QOC methods such as gradient ascent pulse engineering (GRAPE) (Khaneja et al., 2005). QOC has been used for customized pulse optimization, with the goal of achieving robust broadband excitation covering extended ranges of inhomogeneities (Kobzar et al., 2004, 2008, 2012), selection of specific quantum coherence states (Köcher et al., 2016), or selective excitation or suppression of certain ν0–ν1 combinations (Kobzar et al., 2005). Ilott et al. (2014) have exploited the skin effect of metallic lithium, in this case the B1 field attenuation and phase change originating from eddy currents, to achieve either selective excitation within the skin depth of the metal or a suppression of the metal signal.
In the present work, we combine FEM simulations and QOC pulse design to tailor rf pulses for selective excitation or suppression of NMR signals in the vicinity of metallic copper elements. We show that ν1-robust QOC pulses can still perform ν0-selective excitation and suppression in the presence of conductive cell components. Furthermore, instead of just compensating for inhomogeneities, we introduce a new experimental approach, where the characteristic B1 distortions in the proximity of conductive interfaces are exploited by ν1-selective, ν0-robust QOC pulses to achieve spatial selectivity without the need for pulsed field gradients. The pulse performances are experimentally demonstrated on a test setup consisting of cavities between copper coins and between polymer coins with different solvents to mimic potential future applications in electrocatalysis with metal electrodes.
2.1 Quantum optimal control pulse optimization
The QOC pulses were optimized using a Python implementation of the GRAPE algorithm (Khaneja et al., 2005) with numerical efficiency boosted by efficient spin control using analytical Lie algebraic derivatives (ESCALADE) (Foroozandeh and Singh, 2021; Goodwin and Vinding, 2023). The SciPy implementation of the limited-memory Broyden–Fletcher–Goldfarb–Shanno algorithm (L-BFGS-B) was chosen as optimization back-end (Broyden, 1970; Fletcher, 1970; Goldfarb, 1970; Shanno, 1970; Byrd et al., 1995; Zhu et al., 1997; Virtanen et al., 2020). To facilitate selectivity with respect to ν0 and ν1, we used the concept of pattern pulses, a special variant of ensemble QOC where pulse optimization runs simultaneously across a whole ensemble of spin systems, each corresponding to a different combination of effective ν0 and ν1 (Kobzar et al., 2005). By assigning a target spin state ρtarget, corresponding to excitation or suppression, to each ensemble element, excitation patterns are achieved. Each ensemble element yields a quality factor computed as Re〈ρtarget|ρfinal〉, the real part of the scalar product between the final spin state ρfinal after applying the pulse and ρtarget. The total quality function optimized by L-BFGS-B was computed as the weighted average of the ensemble quality factors. If not specified otherwise, the ensemble elements were weighted equally. The total control amplitude was limited by a hard upper bound of 10 kHz. Robustness with respect to B0 variations was incorporated by variation of the Larmor frequencies ν0, whereas robustness with respect to B1 inhomogeneities was incorporated by allowing linear scalings of the nutation frequencies ν1. The arising 2D grid of varying parameters is termed the excitation profile. The excitation profile resolution was set to 41 ν1 scalings times 401 ν0 offsets. The respective linear relation between B0 and ν0, as well as between B1 and ν1 (Hore, 2015), is given by
In this work, B0 and B1 in the vicinity of different materials are determined by FEM simulations. The B and ν terms are used interchangeably in the following unless an unambiguous distinction is required and stated. It must be noted that, instead of B0, the effective magnetic field that acts on a nuclear spin is used in this paper. That includes chemical (de-)shielding effects affecting the nucleus, as well as susceptibility effects of any material in its environment. Thus, B0, as used in this paper, may differ from the external, static magnetic field.
For the optimization of a ν0-selective, ν1-robust excitation pulse, the excitation profile was chosen such that spins within a ν0 range between −500 and 500 Hz are excited with ρtarget=Ix, whereas the remaining spins within the ν0 range from −2 to 2 kHz are suppressed, corresponding to ρtarget=Iz. Offsets outside of the selected bandwidth were not controlled. For a ν0-selective suppression pulse, the target states were swapped. The linear scaling factors of ν1 ranged between 0.9 and 1.6. For the excitation pulse, a duration of 1 ms with 2000 equidistant time increments of 0.5 µs was sufficient to achieve a final mean quality factor of 94.9 %. For the suppression pulses, two distinct parameter sets were utilized: a duration of 1 ms with 2000 equidistant time increments of 0.5 µs (mean quality factor of 93.5 %) and a duration of 2 ms with 4000 equidistant time increments of 0.5 µs (mean quality factor of 95.6 %) to achieve a better frequency selectivity.
In the case of the suppression pulse, the quality factors of ensemble elements corresponding to a ν0 between −250 and 250 Hz were weighted by a factor of 5 relative to the remaining fidelities. Furthermore, the quality factors of ensemble elements corresponding to a ν1 scaling between 0.9 and 1.1 were additionally weighted by a factor of 5. This was due to the fact that the ensemble elements associated with these regions of the excitation profile tended to reach insufficient quality factor values for a homogeneous signal suppression. The pulse shapes and excitation profiles of the ν0-selective excitation and suppression pulses are visualized in Sects. S1.1 and S2.1 in the Supplement (Figs. S1 to S3 and S10 to S12), respectively.
The ν1-selective, ν0-robust pattern pulse excitation profiles were set up based on the increase in B1 intensity around metallic elements. The increase was quantified by FEM simulations of the local B1 field in the copper and polymer (represented by vacuum) cavities of the model setup following the procedure described in Schatz et al. (2024). The simulated geometry is visualized in Sect. S3 (Fig. S19). The predicted relative B1 increase is then determined as the ratio
For a given , the excitation region in the profile is defined as the set of ensemble elements corresponding to . Ensemble elements in the excitation region are assigned ρtarget=Ix, and the remaining elements are assigned ρtarget=Iz. The ν0 offset range was chosen to be from −1 to 1 kHz. The range of ν1 scalings was chosen to be from 0.9 to 1.6, except for the pulse for selective excitation at , where the maximum ν1 scaling was raised to 1.9. A pulse duration of 1 ms with 2000 equidistant time increments of 0.5 µs was sufficient for all . The obtained final quality factors are listed in Table 1. The pulse shapes and excitation profiles of the ν1-selective excitation and suppression pulses are visualized in Sects. S1.2 and S2.2 (Figs. S4 to S9 and S13 to S18), respectively.
Table 1Obtained final mean quality factors for the optimization of ν1-selective excitation pulses.
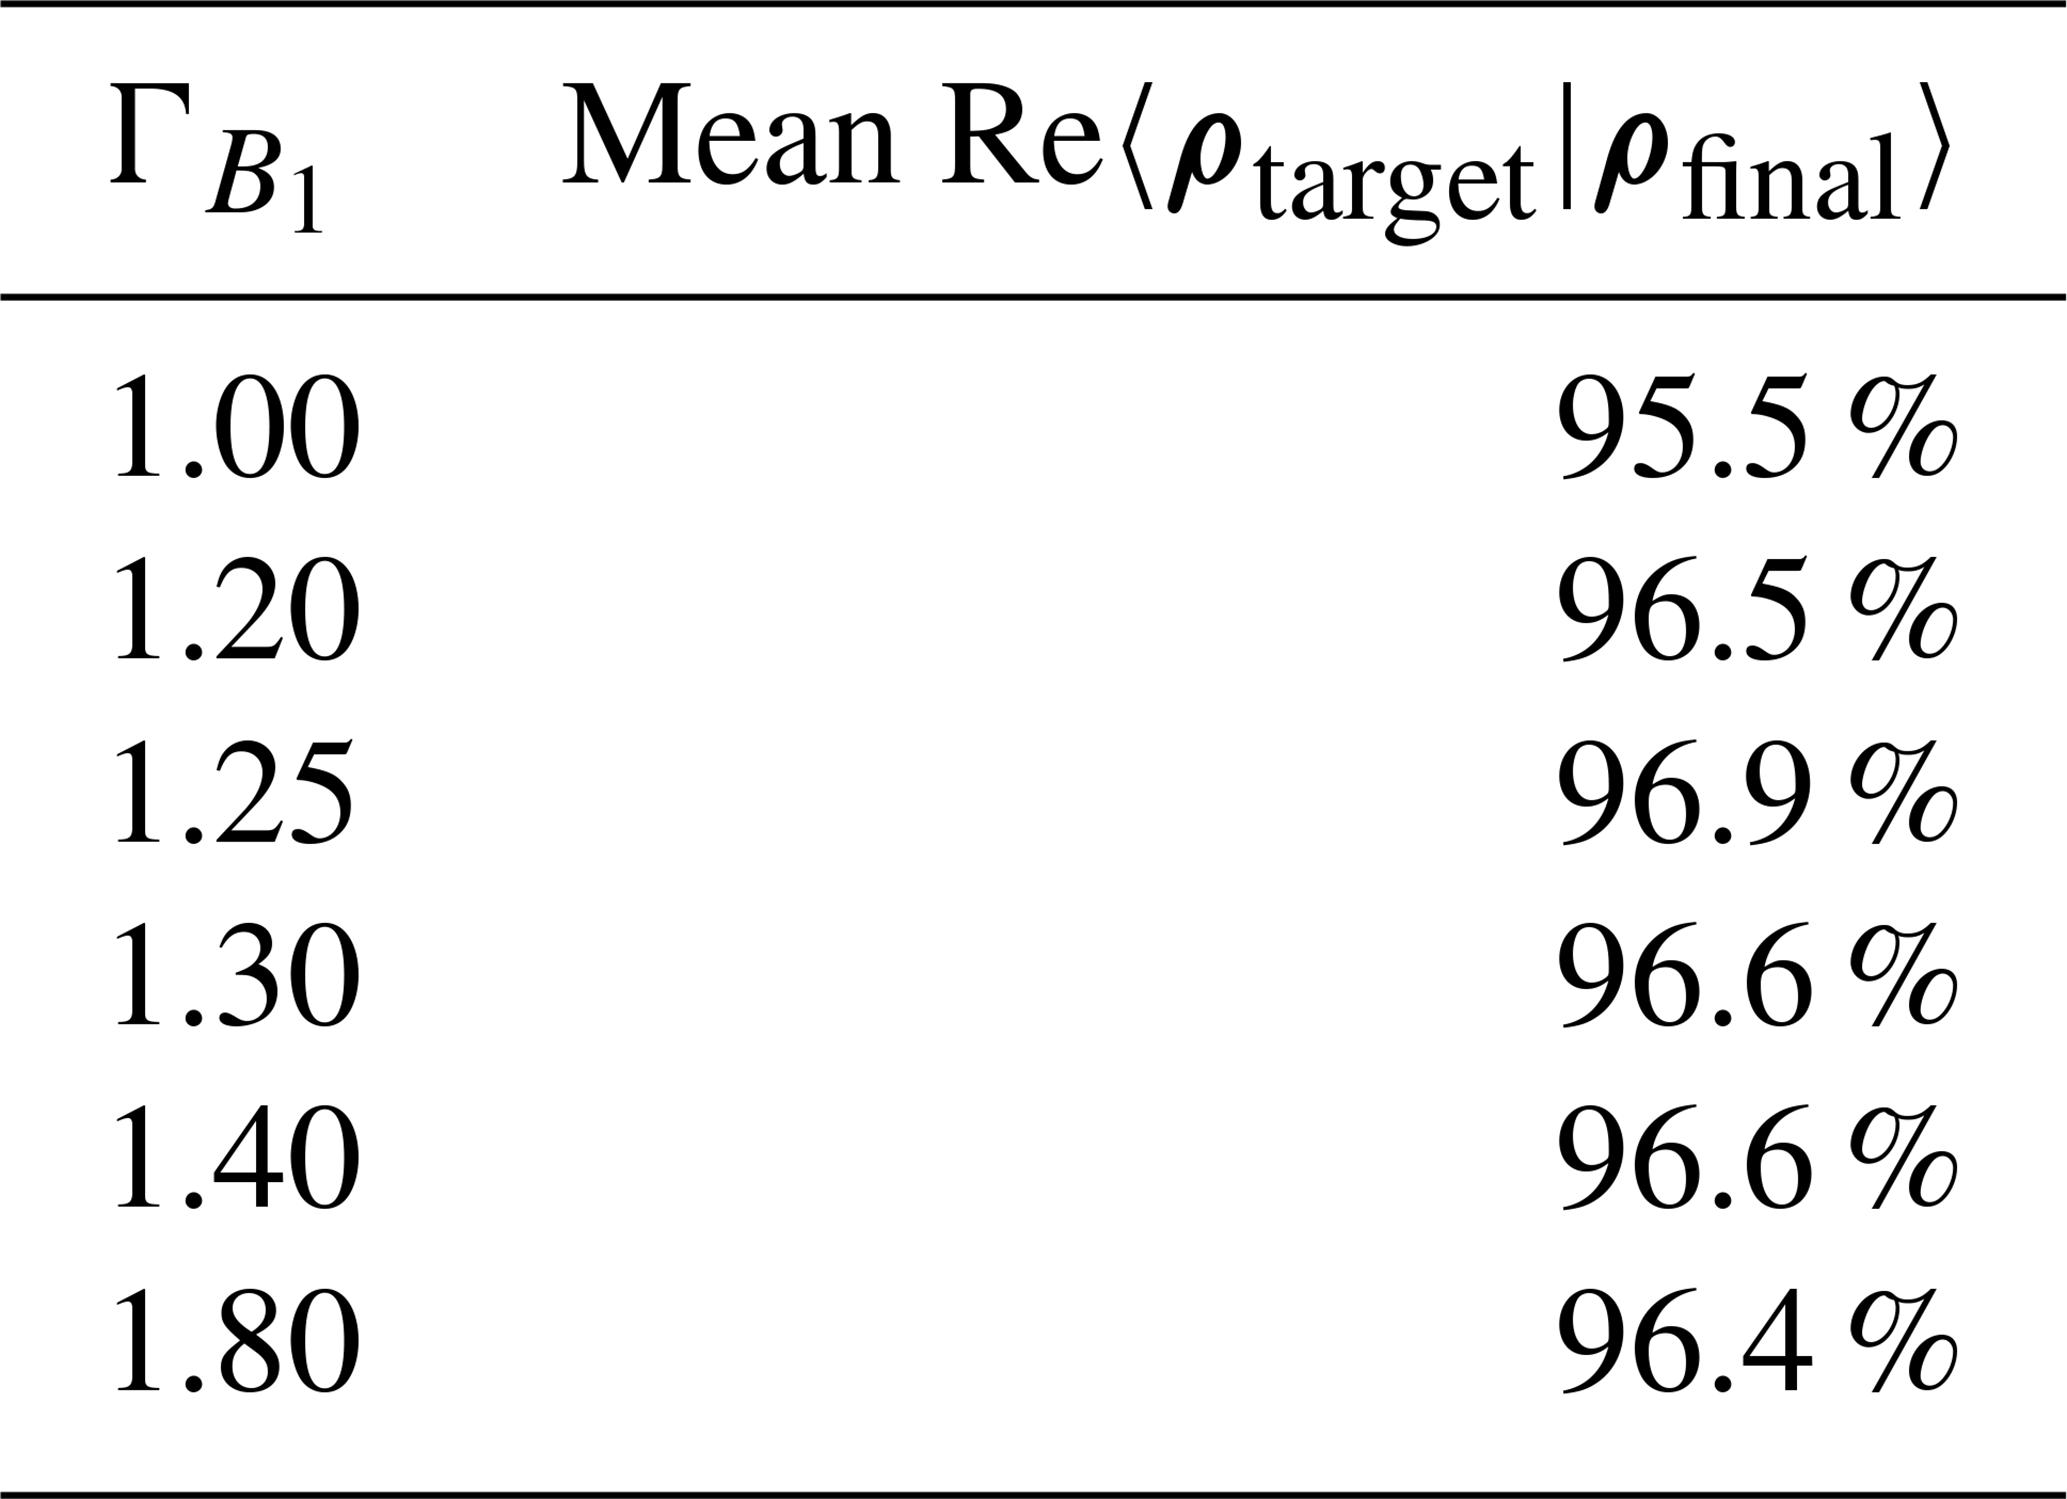
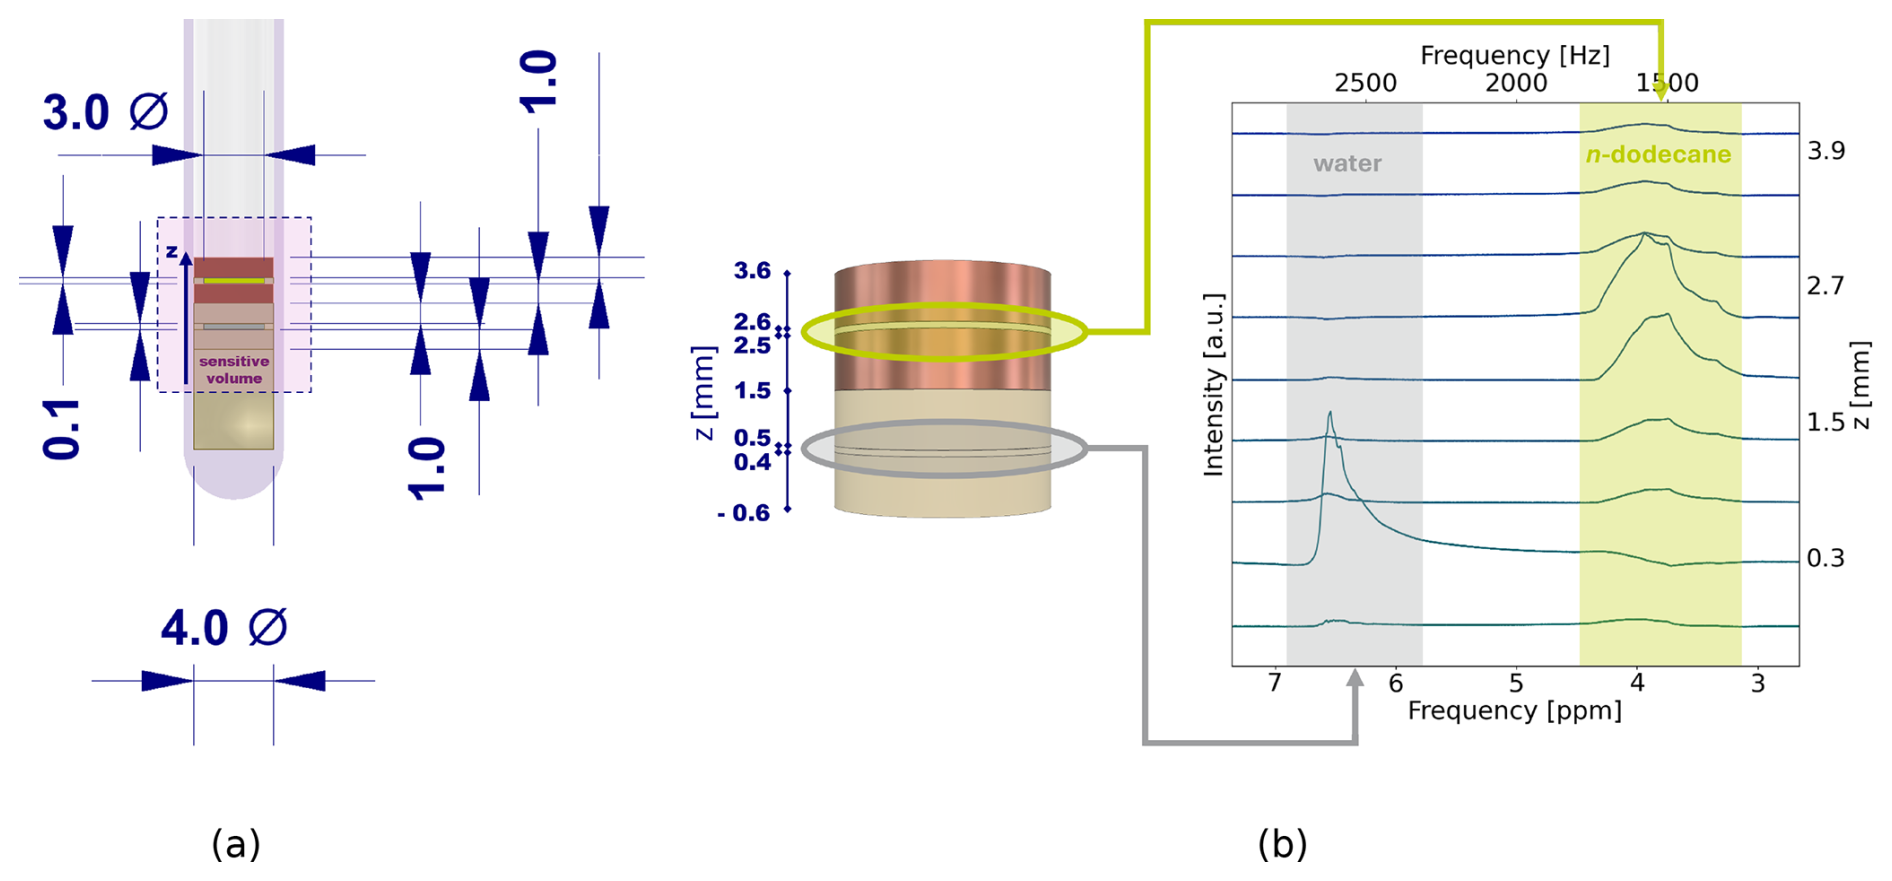
Figure 1Sectional side view of experimental setup inside a shortened standard 5 mm NMR tube with cell dimensions given in mm (a) and 3D illustration of the setup with a spatially encoded chemical shift imaging of H2O and n-dodecane in between the double coins (b). The cavities each have a diameter of 3 mm and a height of 0.1 mm. The coins each have a diameter of 4 mm and a height of 1 mm. The NMR-sensitive volume for homogeneous excitation is marked by a pink rectangle with dashed line and extends ±4 mm in the z direction from the center of the model setup. The spatial position of the liquids can be differentiated on a scale of about half a mm.
2.2 NMR experiments
A model setup was prepared to demonstrate the operating principle of the developed QOC pulses. To investigate the field-distorting effects of conductive materials on liquid samples, the setup contained two cavities of equal dimensions: the first one in between two copper coins and the second one in between two polymer coins made of polyether ether ketone (PEEK), serving as the reference cavity with minor magnetic field distortions. The rotation axes of both cylindrical cavities and their coins were oriented parallel to the B0 field and perpendicular to the B1 field, in accordance with the findings in a previous publication (Schatz et al., 2023). The model setup was fitted into a shortened common 5 mm NMR tube and is illustrated in Fig. 1a and b, including the diameter and thickness of copper and polymer coins, as well as the polymer spacers which defined the size of the cavity. The NMR tube was shortened to remove the narrowed opening such that the entire tube has a diameter of 4 mm.
Liquids were only added in between two coins of equal material, limiting the maximum filling height of liquid in each cavity to 0.1 mm. n-dodecane (in copper cavity) and H2O (in PEEK cavity) were chosen as non-mixable liquids, each of them filled into one of the two cavities, to enable an unambiguous distinction by spatial position, as well as by their chemical shift. The model setup was positioned in the NMR tube such that the two cavities were placed around the center of the NMR-sensitive volume.
A Bruker DiffBB BBO broadband diffusion probe and a Bruker Diff50 1H diffusion probe, both with magnetic field gradients along the B0 direction (z axis) with a maximum gradient strength of 2312 G cm−1 were operated on a Bruker Avance III HD spectrometer (Bruker BioSpin GmbH, Rheinstetten, Germany) with a 9.4 T wide-bore magnet.
The spatial position of the two liquids was verified by phase-encoded 1H chemical shift imaging (CSI) along the z axis (Fig. 1b). Phase-encoded 1H CSI was performed by using pulsed magnetic field gradients along z with a strength of ±37.62 G cm−1. The field of view was set to 20 mm with 32 points in the spatial dimension, resulting in a spatial resolution of 625 µm. Due to sharp susceptibility changes at interfaces, homogeneous shimming over the sample volume was not possible. Instead, the shims were adjusted for more pronounced separation of the resonances of the two compounds. No chemical shift reference was integrated into the model setup. Thus, the chemical shifts of water and n-dodecane do not correspond to their tabulated values.
Standard FID (free induction decay)-detected NMR experiments using a single hard pulse adjusted for a Bruker reference sample were compared to experiments where the hard pulse was substituted by QOC pulses. For the ν0-selective QOC pulses, in order to illustrate the selective bandwidth of 1000 Hz over the total pulse bandwidth of 4000 Hz, the 1H resonance frequency offset Δν0 was varied in steps of either 200 Hz or 300 Hz, starting 600 or 900 Hz downfield of the H2O resonance for a total frequency range of 2200 Hz or 2700 Hz, respectively. For the ν1-selective pulses, Δν0 was set such that the total pulse bandwidth of 2000 Hz contained the resonances of both n-dodecane and H2O. However, it was found that the pulse length required for a 90° pulse in the presented model setup differs from a Bruker reference sample. The actual 90° pulse lengths for each cavity were determined by a nutation experiment, and the resonance integrals in all reference spectra were adjusted accordingly. The acquisition time was adjusted to record the full FID, and the recovery delay was set to allow for complete relaxation. The baseline was corrected by using a splines fit.
Nutation experiments were performed with rectangular pulses of varying pulse length and a constant pulse power of 1.5 W for the Diff50 probe and 3.8 W for the DiffBB probe. In total, 100 pulse lengths were screened, with a step size of 30 µs.
QOC pattern pulse design is capable of providing either selectivity or robustness with respect to both ν0 and ν1 independently. Each variation is exploited for specific applications. Selectivity with respect to the Larmor frequency ν0 allows for selective measurement of specific spin species, which enables solvent suppression or the suppression of other dominating bulk signals to increase sensitivity with respect to minority spin species. In contrast, ν0 robustness facilitates quantitative, phase-stable measurements in the presence of B0 inhomogeneities. Robustness with respect to the nutation frequency ν1 allows for the uniform, quantitative excitation within an electrochemical cell despite B1-distorting metallic components. ν1 selectivity may be utilized for spatial selectivity on B1-distorting metallic surfaces.
With electrochemical applications in mind, this work discusses the two following QOC pulse types: firstly, ν1-robust, ν0-selective pulses enable efficient solvent suppression even in the presence of B1-distorting electrical conductors. Secondly, we demonstrate ν0-robust, ν1-selective excitation in order to achieve spatial selectivity in proximity to electrical conductors independently of their B0-distorting effects.
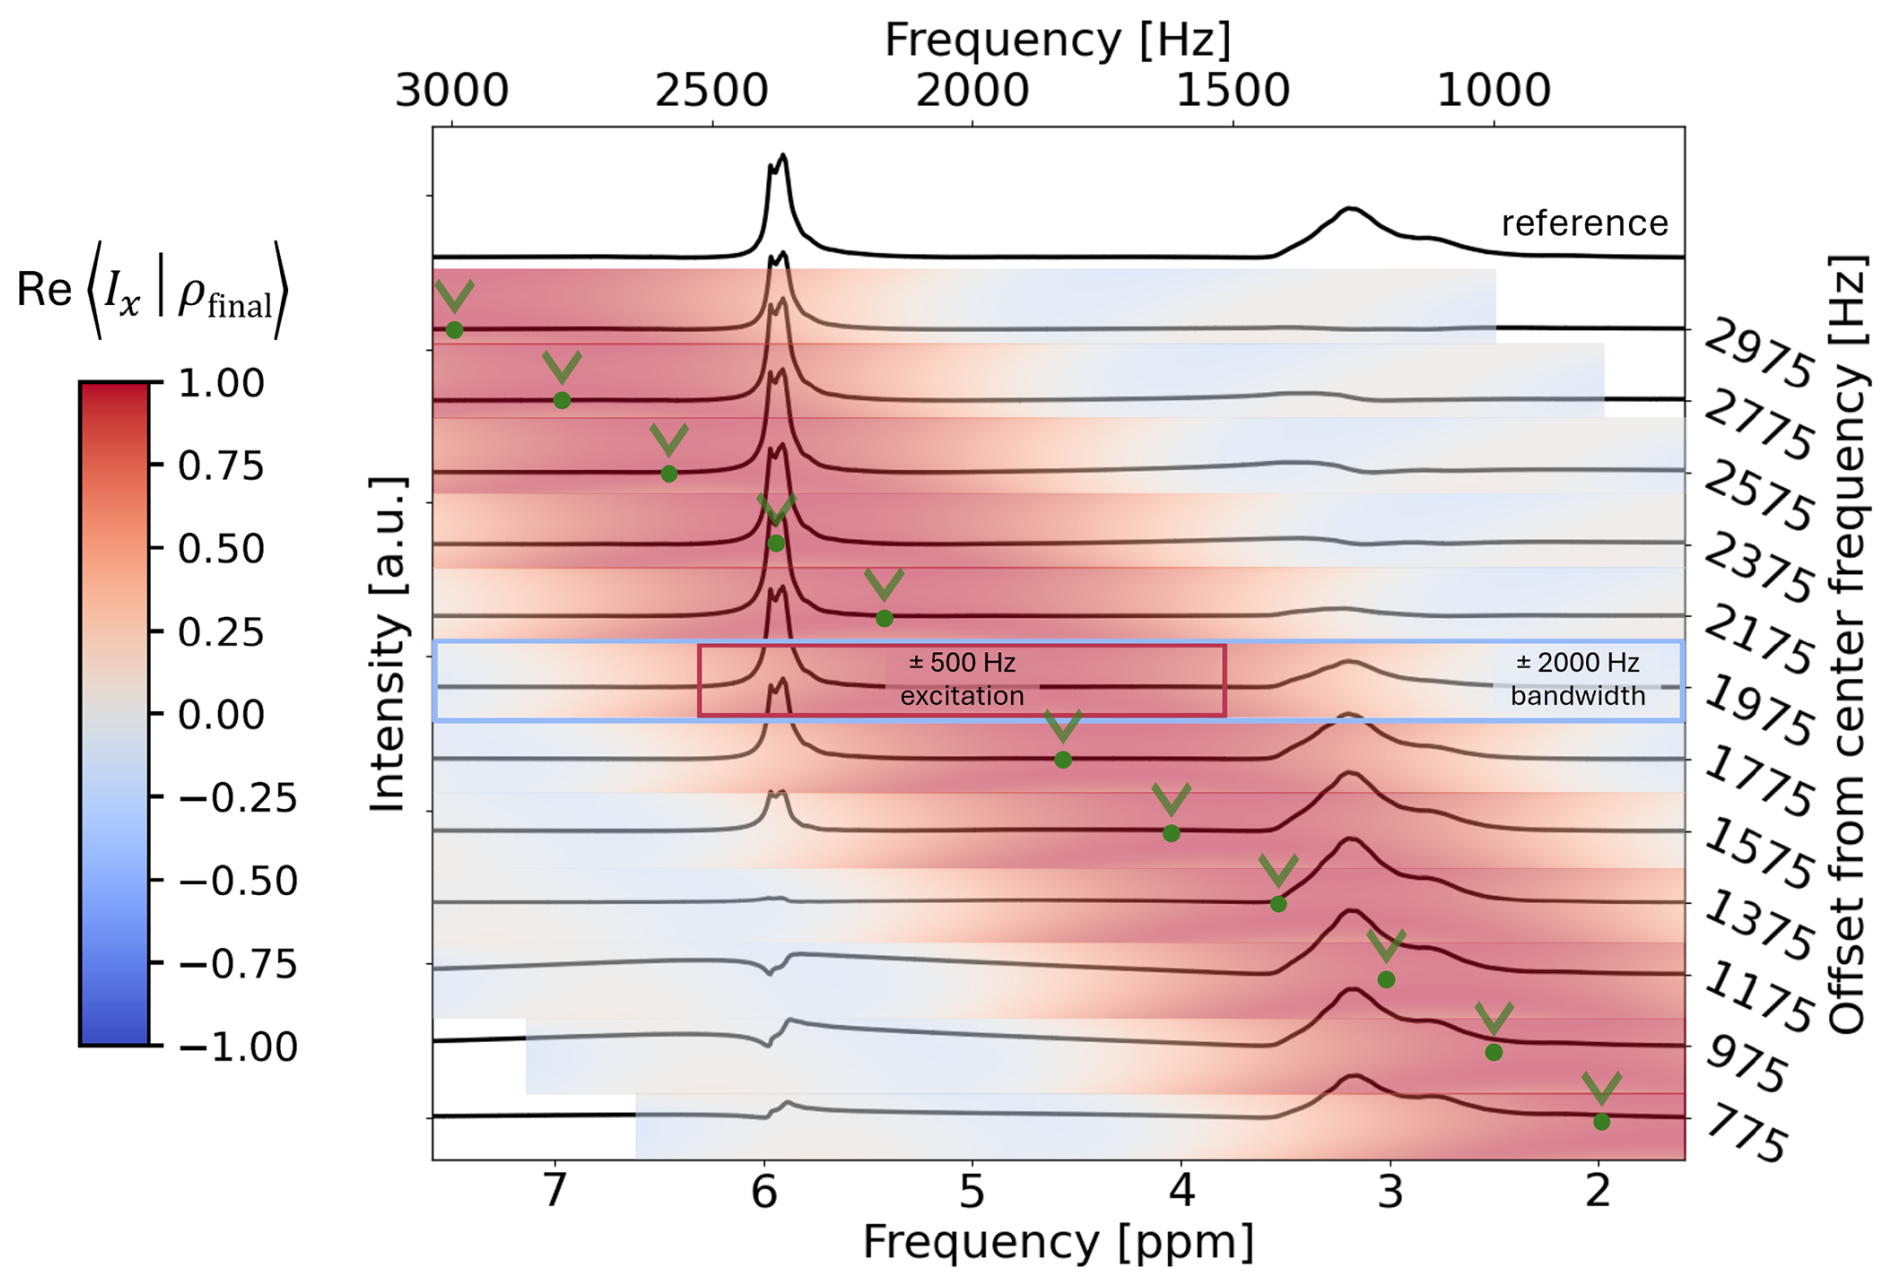
Figure 21H spectra recorded utilizing a ν0-selective excitation pulse with a selective excitation range of 2.5 ppm (±500 Hz), a 1 ms duration, and a total frequency range of 4000 Hz applied at different Δν0 (marked with a green dot and arrow). The top spectrum depicts the reference 1H spectrum recorded using a hard pulse. Hereby, the resonance at approx. 3 ppm is assigned to n-dodecane, and the resonance at approx. 6 ppm is assigned to H2O. The spectra recorded with QOC pulses are underlaid with color gradients representing the theoretical x-magnetization Re〈Ix|ρfinal〉, normalized to a range of , after applying the QOC pulse at each particular Δν0. Selective excitation is achieved for the on-resonance pulses with Δν0=2375 Hz for H2O and Δν0=1375 Hz for n-dodecane.
3.1 ν1-robust ν0 Selectivity
The ν0-selective QOC excitation pulses with a pulse length of 1 ms were demonstrated in a proof-of-concept experiment on the described model setup, with n-dodecane in the copper cavity and H2O in the PEEK cavity. Figure 2 illustrates the application of the ν0-selective pulses at selected offsets Δν0. Here, Δν0 was varied with a step size of 200 Hz between 2975 and 775 Hz (marked with a green dot and arrow), where the excitation is centered on either the resonance of H2O for Δν0=2375 Hz and on the resonance of n-dodecane for Δν0=1375 Hz. The top spectrum was recorded utilizing a hard pulse and serves as a reference for comparison. The linewidth of the H2O resonance (50 Hz) is smaller compared to the coalesced n-dodecane resonance (150 Hz). Both resonances show broad features due to a non-optimal shim caused by the significant magnetic susceptibility gradients throughout the model setup. Thus, the error on each individual resonance integral was calculated from the respective signal-to-noise ratio of each experiment.
When centering the excitation band on either resonance, the QOC pulse achieved efficient excitation, yielding a relative integral of 87.44±0.43 % for H2O or 115.34±0.26 % for n-dodecane compared to the 90° hard pulse. Simultaneously, the respective other resonance was suppressed to either 4.96±0.28 % or 4.02±0.40 % of its original value. The relative QOC integrals of both resonances compared to the reference for each of the ν0-selective pulses are summarized in Table S1 in the Supplement.
Analogously, ν0-selective QOC suppression pulses with the same pulse length were applied with a Δν0 step size of 300 Hz. The pulses (Fig. S27 and Table S2) efficiently suppressed the H2O resonance to 7.42±0.97 % of its original value. However, the n-dodecane resonance was only suppressed to 32.66±0.32 %. This was due to an insufficient pulse performance at a duration of 1 ms, a non-optimal Δν0 (+100 Hz) for n-dodecane in this specific experiment, and the large n-dodecane linewidth. To increase the suppression efficiency, the pulse duration was extended to 2 ms, and the step size was readjusted to 200 Hz such that the suppression band was centered on n-dodecane or H2O. In the adjusted experiment (Fig. 3 and Table S3), H2O was suppressed to 1.01±0.48 % and n-dodecane was suppressed to 1.29±0.26 % of their respective reference value when centering the suppression band on either of them, yielding a significantly improved suppression.
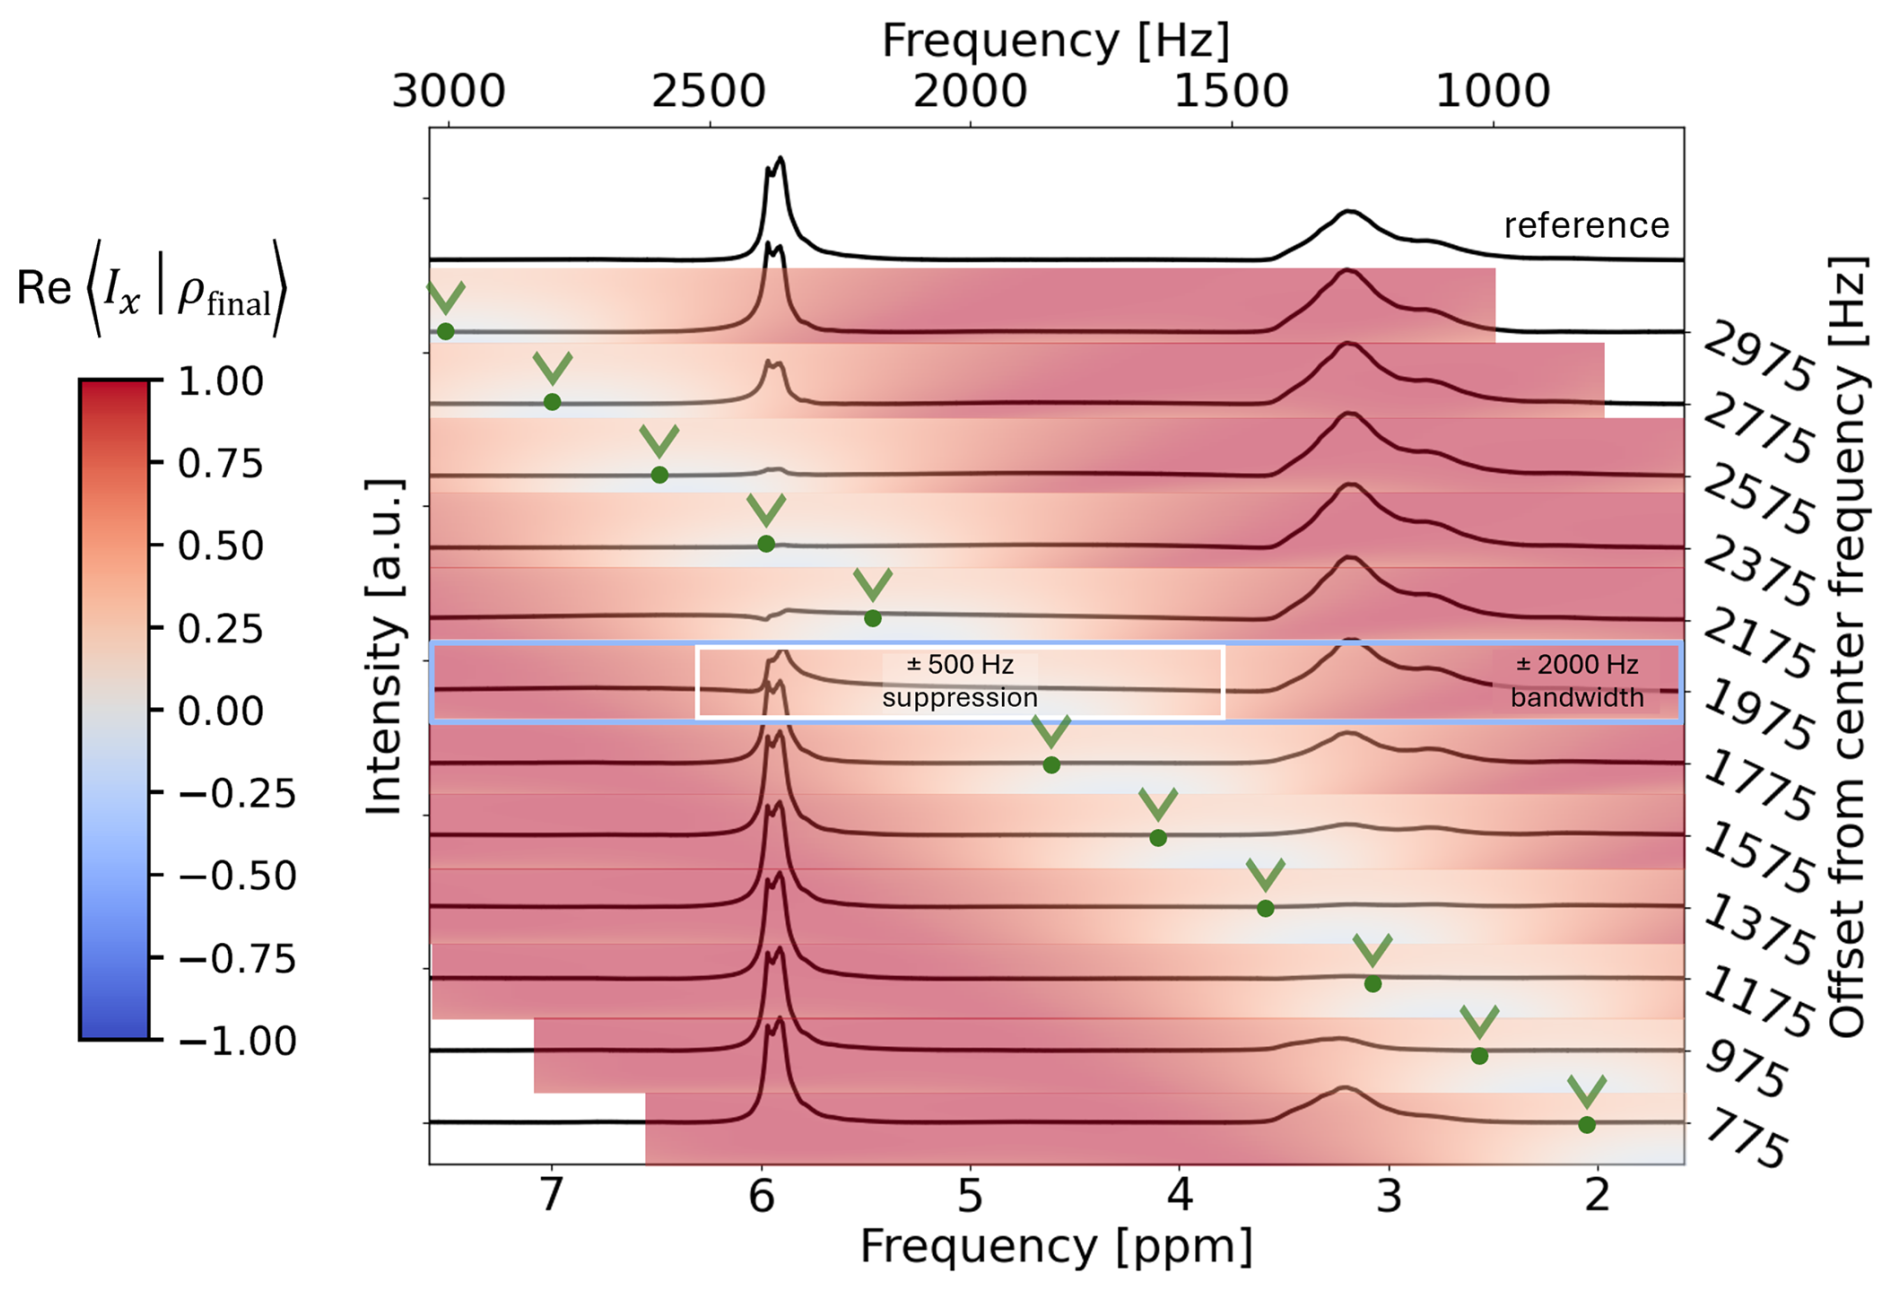
Figure 31H spectra recorded utilizing a ν0-selective suppression pulse with a selective suppression range of 2.5 ppm (±500 Hz), a 2 ms duration, and a total frequency range of 4000 Hz applied at different Δν0 values. The top spectrum depicts the reference 1H spectrum recorded using a hard pulse. Hereby, the resonance at approx. 3 ppm is assigned to n-dodecane, and the resonance at approx. 6 ppm is assigned to H2O. The spectra recorded with QOC pulses are underlaid with color gradients representing the theoretical x-magnetization Re〈Ix|ρfinal〉, normalized to a range of , after applying the QOC pulse at each particular Δν0. Selective suppression is achieved for the on-resonance pulses with Δν0=2375 Hz for H2O and Δν0=1375 Hz for n-dodecane.
To assess the signal selectivity of the QOC excitation pulses quantitatively, a selectivity parameter
was defined, where ℐexc and ℐsup denote the integrals of the excited and suppressed resonances obtained by the QOC pulse, respectively. Analogously, ℐexc,ref and ℐsup,ref denote the integrals of the excited and suppressed resonances obtained by the hard 90° pulse, respectively. SQOC is between 0 and 1 in the ideal case where the 90° hard-pulse reference achieves a uniform maximum excitation, where SQOC=1 describes an optimally selective and SQOC=0 a non-selective QOC excitation. However, QOC excitation surpassing the excitation of 90° hard pulses was observed experimentally, thus achieving SQOC>1 in some cases. We believe the origin of this effect lies within the capacitive interaction of the rf pulse B1 and the conductive plates, which is more pronounced for the short, hard pulse than for the long, soft QOC pulse.
A corresponding selectivity parameter
was defined for QOC suppression pulses. In the following, SQOC will be used to describe the selectivity of all QOC pulses and excitation, as well as suppression, referring to their respective or .
The highest SQOC for ν0-selective excitation in Fig. 2 amounted to 1.202±0.007 when positioning Δν0 200 Hz upfield from the center of the n-dodecane resonance (Δν0=1175 Hz, 11th spectrum from top). This was slightly higher compared to when the pulse was exactly on-resonance (Δν0=1375 Hz, 10th spectrum from top). Comparatively, selective suppression in Fig. 3 achieved a maximum SQOC of 1.177±0.008 with Δν0 200 Hz upfield from the center of the n-dodecane resonance (Δν0=975 Hz, 12th spectrum from top), also slightly higher compared to when exactly on-resonance (Δν0=1175 Hz, 11th spectrum from top). Herein, excitation pulses achieved a similar maximum SQOC as suppression pulses.
The achievable SQOC in Fig. 3 was strongly affected by Δν0, even when within the pulse robustness range of ±500 Hz. For example, SQOC is reduced to 0.397±0.004 and 0.839±0.006 when moving Δν0 either downfield (Δν0=1775 Hz, 8th spectrum from top) or upfield (Δν0=975 Hz, 12th spectrum from top) by 400 Hz, respectively. SQOC is also limited by the proximity of the suppressed and excited frequency ranges. The closer the resonance frequencies are to each other, the more challenging a selective excitation or suppression via ν0-selective QOC pulses becomes, similarly to the case for conventional selective pulses (McKay, 2009). A near-instant transition from excitation to suppression along the ν0 dimension is difficult to realize in the pulse optimization and requires longer pulse durations for sharper transitions.
To overcome the selectivity difficulties for small frequency ranges, B1 field variances originating from conductive materials were exploited instead of ν0 differences in the optimization of QOC pulses.
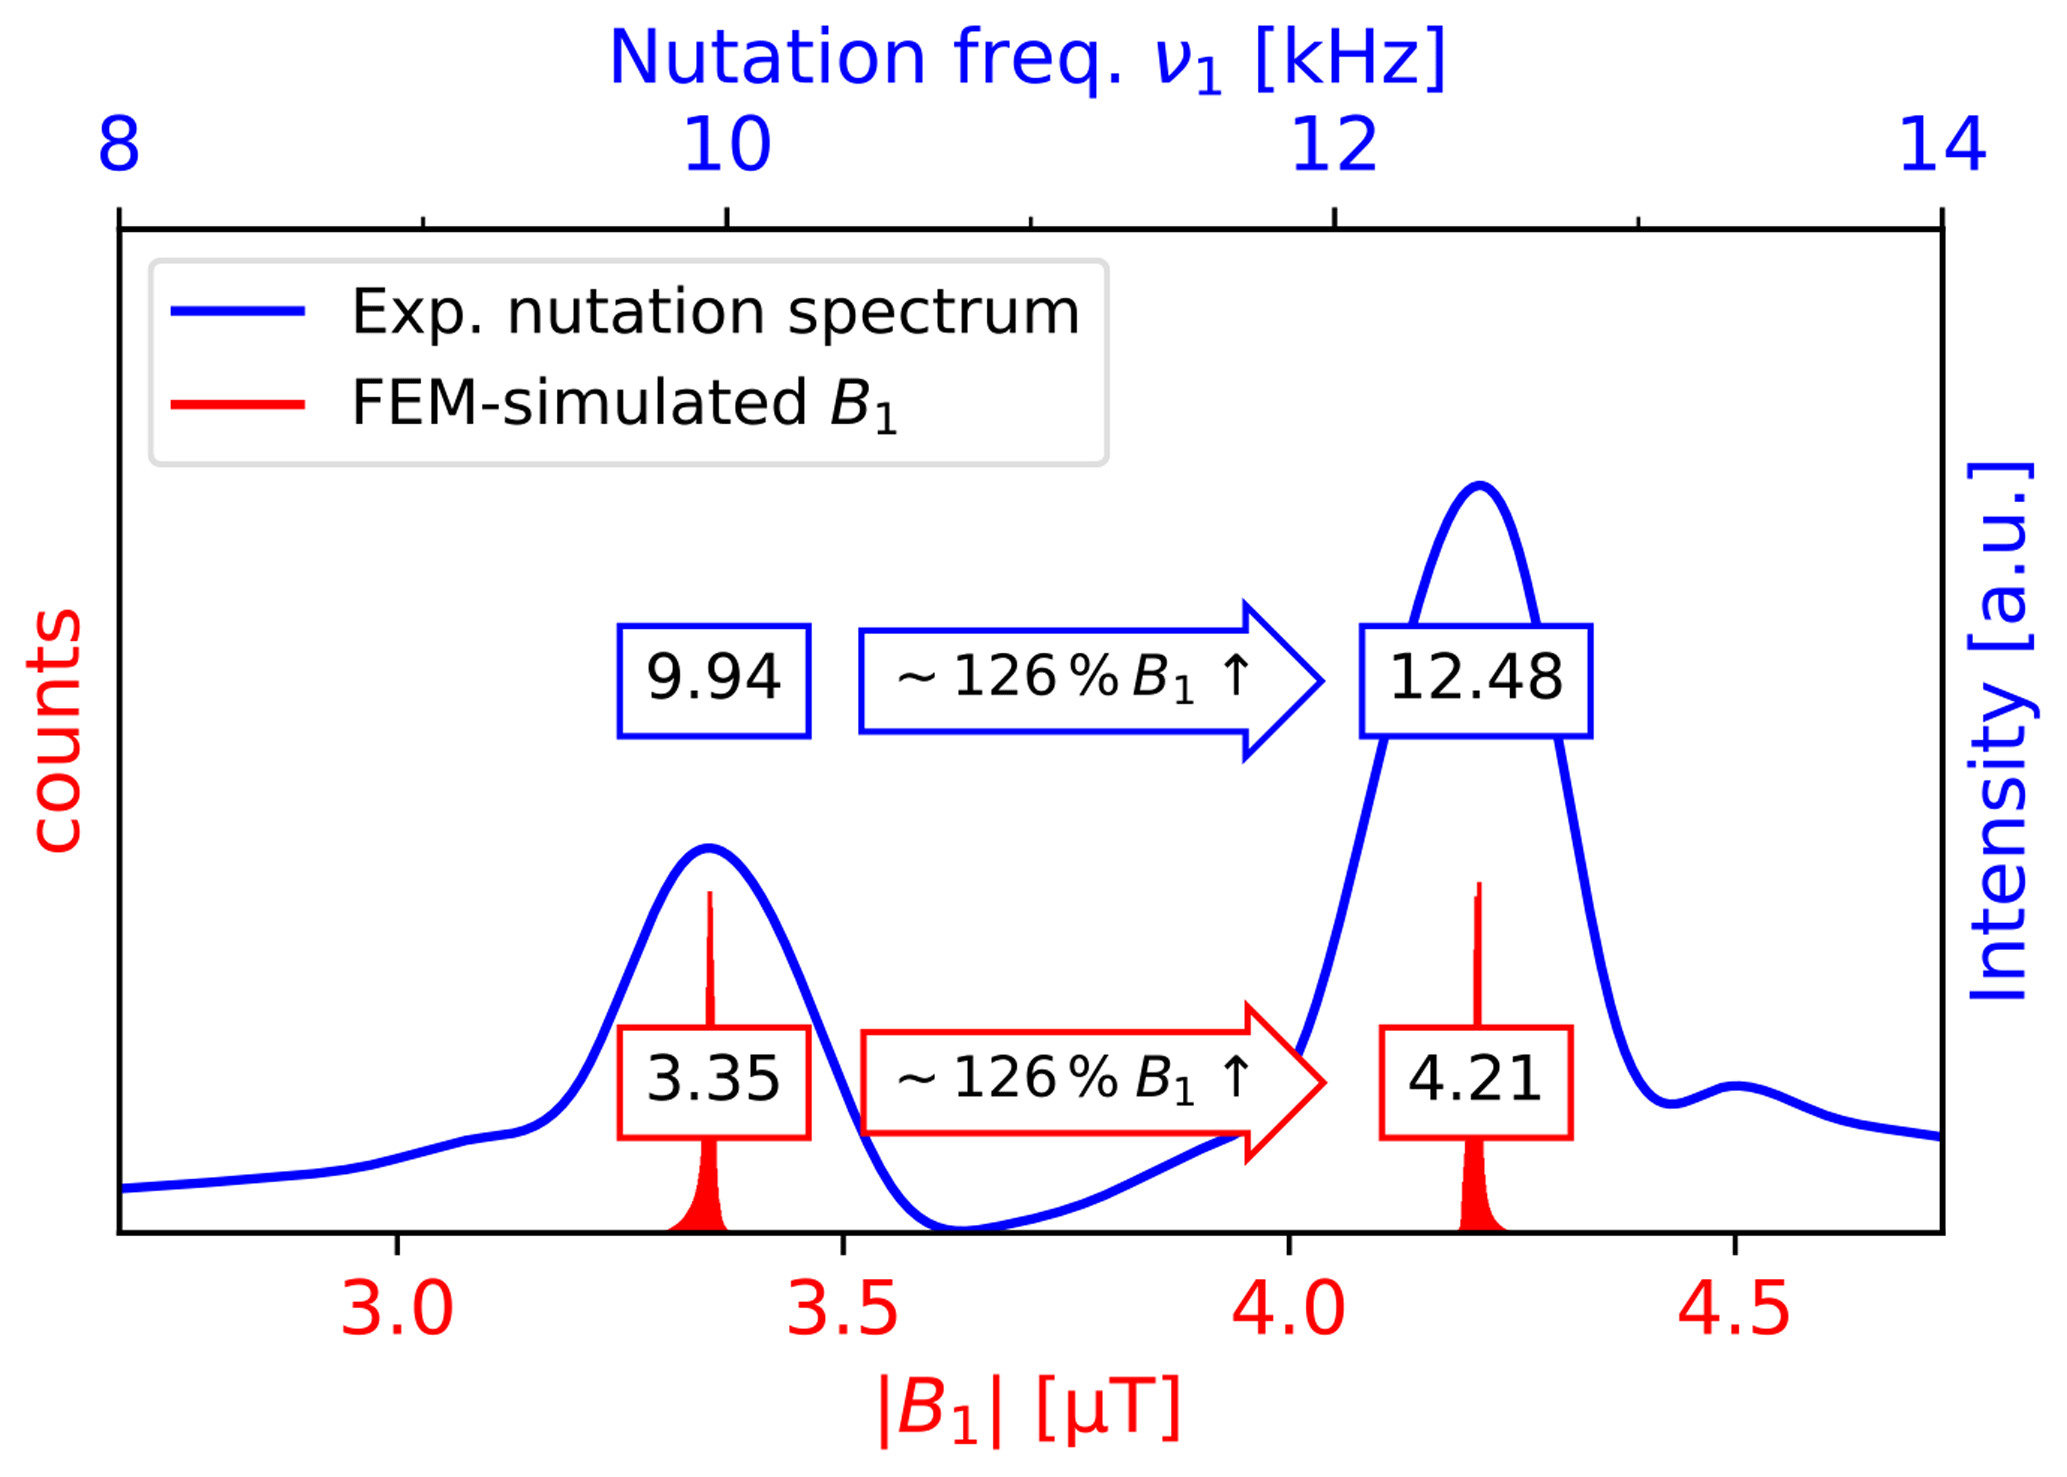
Figure 4Dual x-axis plot superimposing the experimental nutation spectrum interpolated by a cubic spline (blue) and the FEM-simulated B1 distribution (red). The nutation spectrum was recorded using rectangular pulses of varying pulse length at a constant pulse power (see Sect. 2.2). The FEM-simulated B1 distribution was obtained as a histogram of the B1 magnitudes at all of the finite-volume elements of the cavities. The smaller ν1 and B1 values correspond to the PEEK cavity, while the larger ν1 and B1 values correspond to the copper cavity. The relative difference between the ν1 maxima (25.6 %) is in good alignment with the relative B1 increase predicted by the FEM simulation (25.7 %).
3.2 ν0-robust ν1 selectivity
The FEM-predicted B1 increase was validated experimentally via a nutation experiment (Fig. S20). A comparison of the obtained nutation frequencies ν1 for both cavities in the model setup is shown in Fig. 4. The FEM simulations revealed two narrow, clearly separated B1 distributions for the copper and PEEK cavity with . The experimentally determined amounted to 1.256, resulting in a difference of 0.001 between simulations and experiments. A difference of this magnitude is negligible when applying QOC pulses due to their robustness with respect to B1 inhomogeneities of ±0.1. Exchanging H2O by n-dodecane or other liquids affected neither the simulated nor the experimentally determined (Sect. S4.2.1). Thus, the difference in B1 clearly originates from the surrounding material.
To exemplify the accuracy of the method, a range of QOC pulses for varying with ν0 robustness (Sect. 2.1) was applied to the model setup and compared for a systematical screening of pulse effectiveness (Fig. 5). The errors of all values were calculated from the respective signal-to-noise ratio of each experiment.
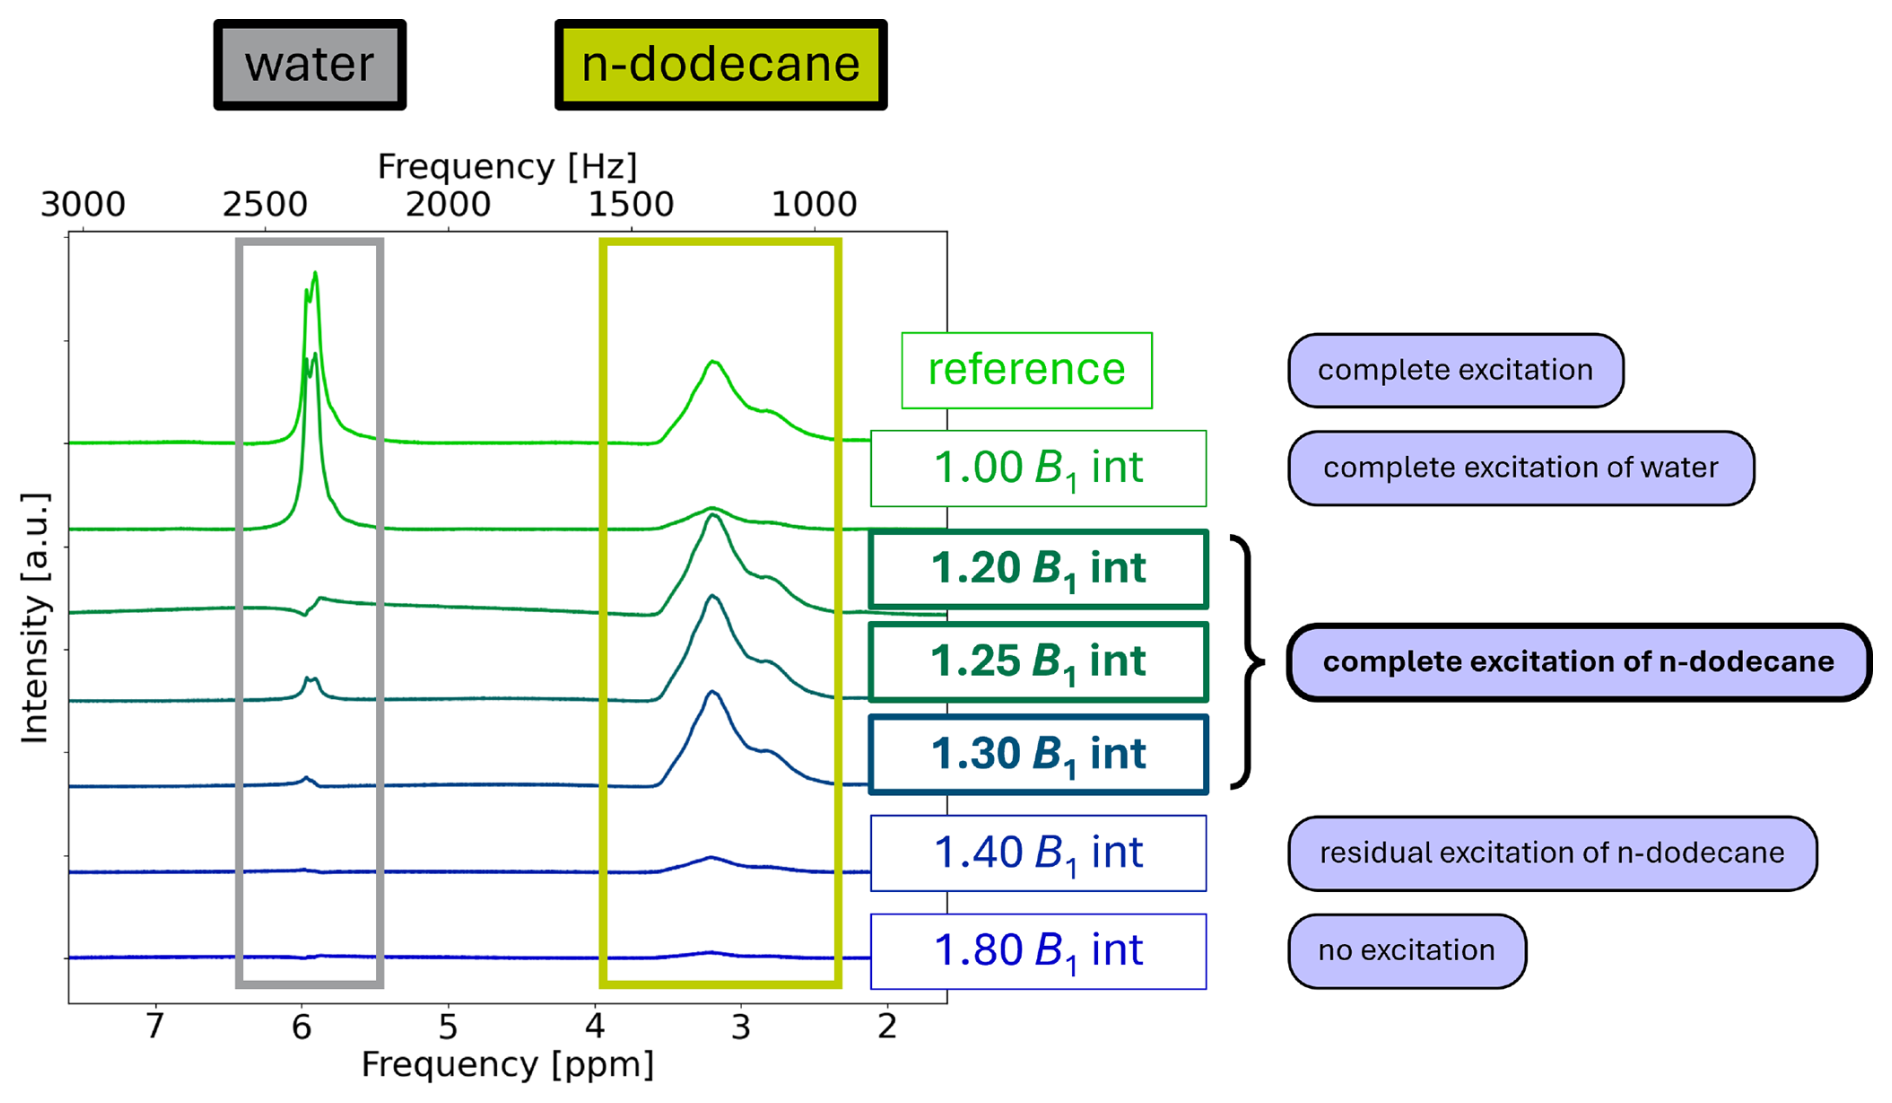
Figure 51H spectra recorded utilizing ν1-selective excitation pulses with a selective excitation range of , 1 ms duration and a total frequency range of 2000 Hz. Hereby, the resonance at approx. 3 ppm (framed in bright green) is assigned to n-dodecane, and the resonance at approx. 6 ppm (framed in gray) is assigned to H2O. The top spectrum depicts the reference 1H spectrum recorded using a hard pulse. Below, spectra utilizing selective QOC pulses, optimized for increasing , are displayed. Selective excitation of n-dodecane is achieved for , which matches the B1 amplification of the cavity in between copper.
A 90° hard pulse reference spectrum of the same setup was recorded for comparison. The relative excitations of both resonances compared to the reference for each of the ν1-selective pulses are summarized in Table 2.
Table 2Individual relative integral of the ν1-selective QOC excitation pulses compared to a corresponding 90° hard pulse.
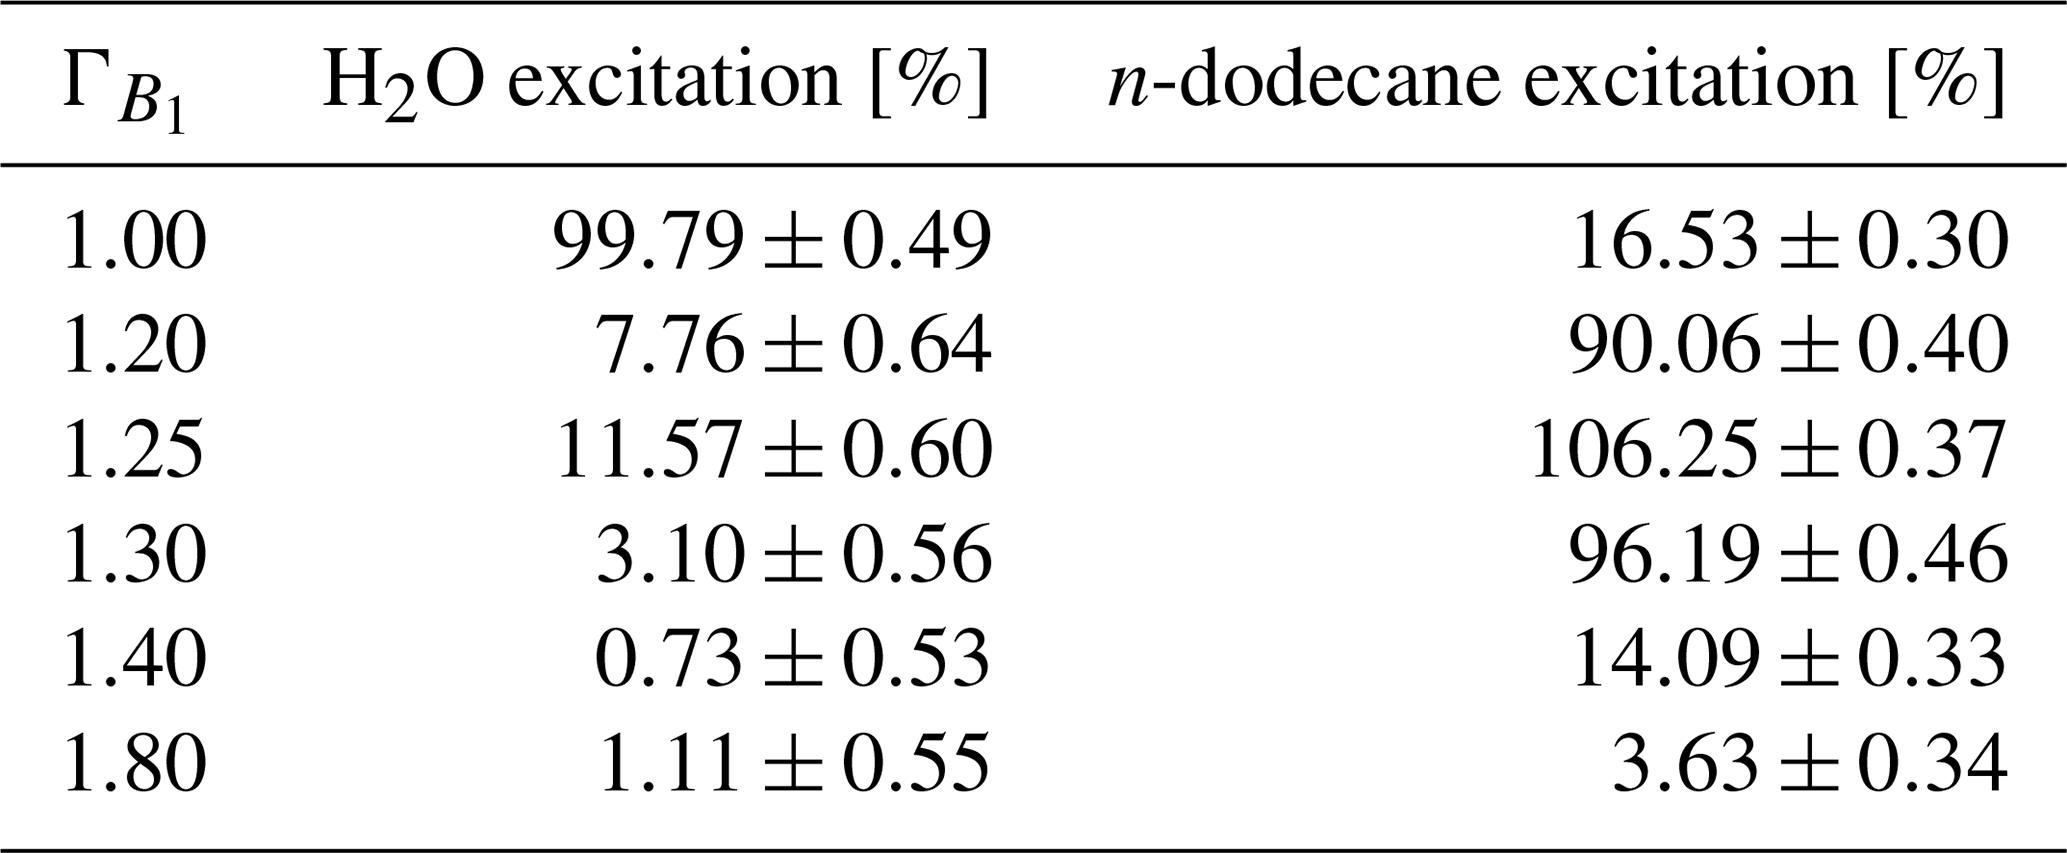
The QOC pulses for , and selectively excited the n-dodecane resonance to a minimum of 90.06±0.49 % and simultaneously suppressed the resonance of H2O to a maximum of 11.57±0.60 %. These results confirm a successful QOC excitation of resonances inside the copper cavity while suppressing resonances inside the PEEK cavity within the robustness limit of ±0.1. The highest excitation of n-dodecane was achieved with the pulse for , while the highest suppression of H2O was achieved with the pulse for .
In comparison, the application of a QOC pulse optimized for excited the H2O resonance to 99.79±0.49 % and suppressed the n-dodecane resonance to 16.53±0.30 % of their original values. This illustrates that, depending on the which the QOC pulses are optimized for, a resonance selectivity for either the copper cavity with increased B1 or the PEEK cavity with no B1 increase can be achieved. Furthermore, the additional spectra corresponding to even higher exemplify how a mismatch between the range of the QOC pulse and the B1 experienced by both investigated spin systems leads to both resonances being suppressed to a maximum of 14.09±0.33 % () and 3.63±0.34 % () of their original values.
SQOC was again determined to evaluate the effective signal selectivity of the ν1-selective QOC pulses and to compare it to the ν0-selective QOC pulses. Additionally, the experiments shown in Fig. 5 (except ) were each repeated three times for the determination of a standard deviation. Thus, the standard deviation will be used instead of the error based on the signal-to-noise ratio to evaluate the QOC pulse performance in the following. The average SQOC values are summarized in Table 3.
Table 3Average SQOC of the ν1-selective QOC excitation pulses. The corresponding 90° hard pulse has SQOC=0.
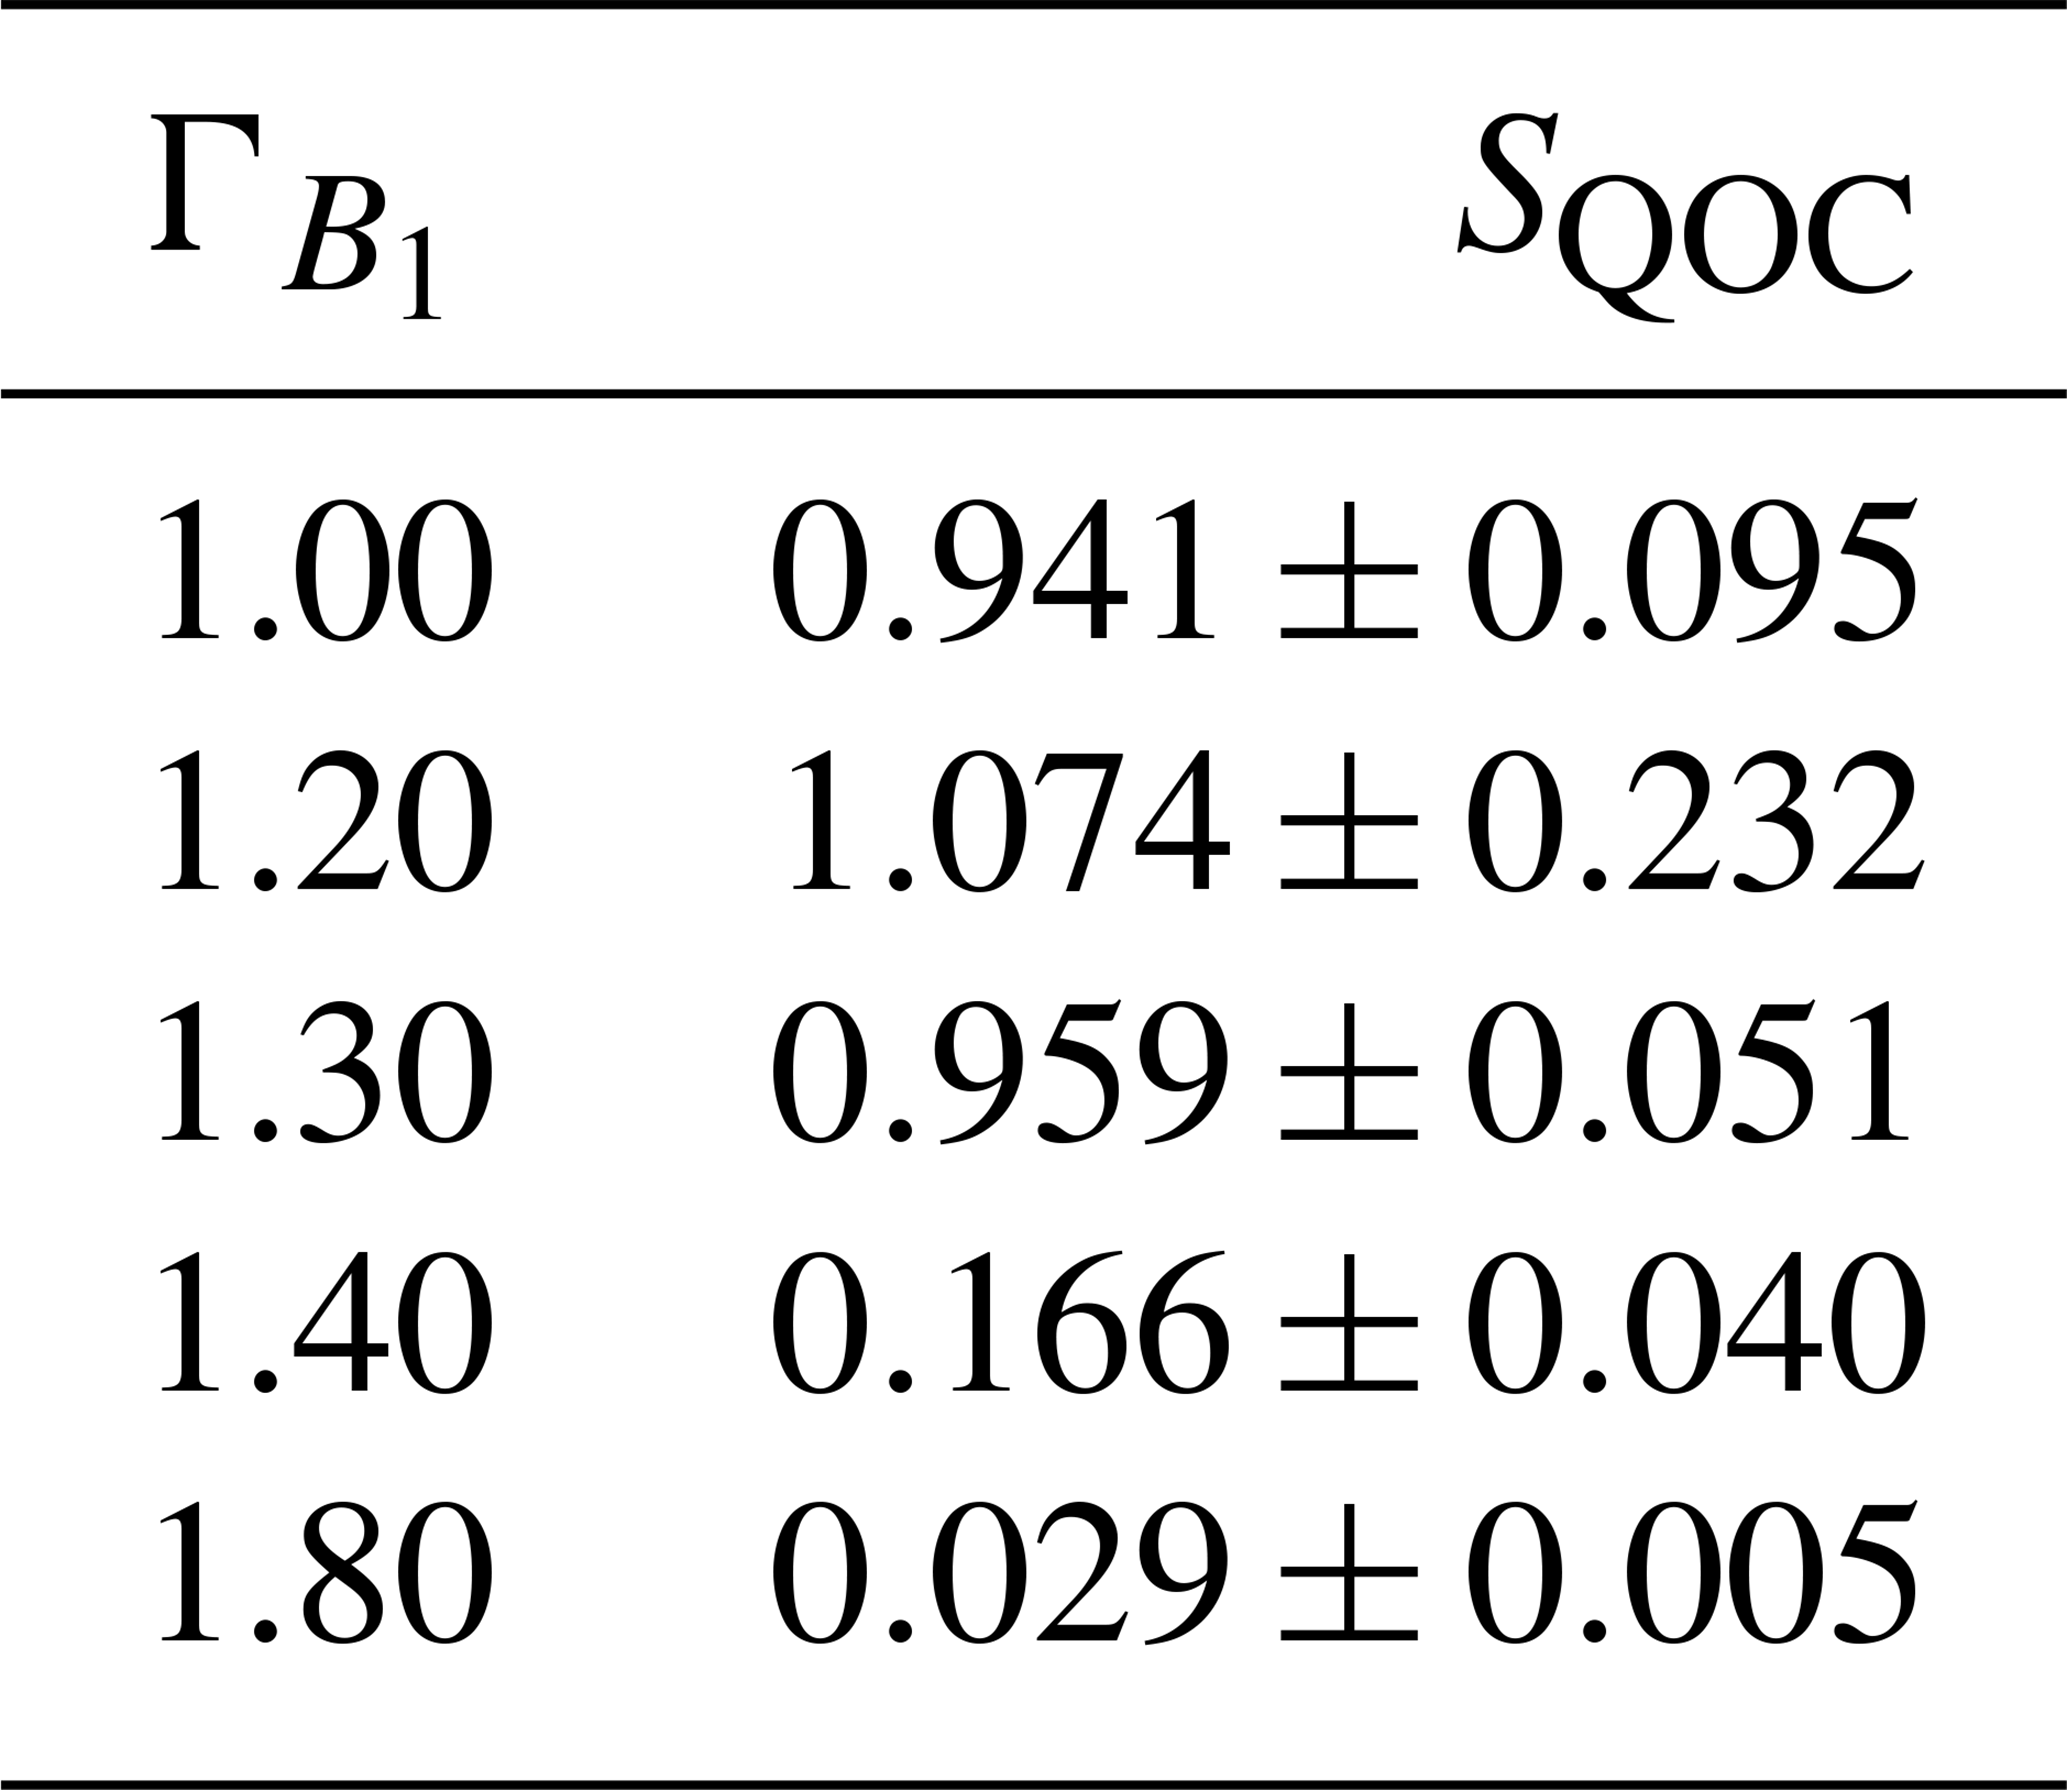
The highest average SQOC was found for at 1.07±0.23. For , the signal selectivity was, on average, slightly lower at . Comparing the theoretical of these pulses suggests that the pulse for should be more selective due to its being slightly closer to the experimentally determined value of 1.256. For the pulse, the experimental is therefore further away from the transition region of the QOC pulse, where excitation of the copper cavity transits to suppression of the PEEK cavity (Fig. S14) at 1.1 in contrast to the pulse with a transition at 1.2 (Fig. S16). However, the SQOC deviation between the pulses for and lies in the range of the error bars. By comparison, QOC pulses for outside of the expected range result in a significantly lower average SQOC of 0.166±0.040 () and 0.029±0.005 (); thus, the selectivity parameter SQOC precisely and reproducibly expresses the QOC pulse selectivity.
For completeness sake, we also tested the impacts of different rf pulse center frequencies, B0 field shim, and receiver gain (Sect. S4.2.2 to S4.2.4) on the QOC spectra, which were revealed to be negligible, thus adding additional flexibility to the experimental implementation of QOC pulses.
In this work, a joint approach of B1 simulation by FEM, numerical NMR pulse optimization by QOC, and the design of an electrochemically relevant model setup for in operando NMR was executed. QOC pulses that are ν1-robust and ν0-selective were able to selectively excite or suppress all resonances inside their selective ν0 bandwidth despite the presence of conductive cell components and the resulting B1 distortions of the applied pulse. The B0 distortions, which were evident from the line broadening of the n-dodecane resonances, also did not affect the results of the QOC experiments, demonstrating how QOC can be an effective tool to compensate for magnetic field distortions caused by conductive cell components. To support this claim, a comparison of QOC excitation pulses and E-BURP pulses (Geen and Freeman, 1991) based on the herein-presented model setup was undertaken (Fig. S28). The comparison evidently visualized that, when using literature-known ν0-selective pulses without ν1 robustness for electrochemical setups, baseline distortions and unsatisfactory selectivity may occur due to strong B1 field distortions near conductive cell components. Furthermore, the B1 field distortions in the model setup were accurately predicted by FEM and integrated into a QOC workflow to tailor pattern pulses which exploit the simulated sharp B1 enhancement near conductive interfaces. All spins which experienced the predicted B1 increase were selectively and abundantly excited by suitable pattern pulses, while other spins were predominantly suppressed. While the ν0-selective pulses targeted spin selectivity via the addressed Larmor frequency, the ν1-selective pulses aimed for spatial selectivity based on the adjacent material. Both approaches achieved similar selectivity levels. Therefore, this study shows that magnetic field distortions are not just mere obstacles but can potentially be turned into exploitable features to tailor QOC pulses for different applications.
The selectivity parameter SQOC was established to compare the performance of QOC pulses. Although QOC pulses differed in their performance, each of them clearly proved that this integrated approach can yield spatially selective data despite B0 inhomogeneities and by taking advantage of strong B1 field distortions. While selectivity can potentially be improved by increasing the duration of pattern pulses, it was shown that suitable contrast can be achieved with practically viable pulse durations on the order of 1 ms for real-world conditions, where surface relaxation or the presence of transient paramagnetic species may prevent the use of longer, more selective pulses.
The proof-of-concept experiments also revealed fundamental insights into conventional selective NMR pulses in conductive systems. While B0 distortions near electrodes or metal components appear to be prominent in spectra, their extent is minor (ppm range) in comparison to the B1 distortions (% range), validated by experiments and FEM simulations. Thus, B1 distortions can be much more readily and effectively exploited for spatially selective QOC pulse optimization compared to the utilization of ν0 artifacts, which are also affected by chemical (de-)shielding effects.
Furthermore, this study also elucidates challenges of conventional solvent suppression methods in spectroelectrochemical NMR. The pulse sequences rely heavily on exact manipulation of the solvent magnetization, exploiting minute ν0 differences in the presence and absence of magnetic field gradients (Zheng and Price, 2010). With conductive materials, however, the large B1 distortions disrupt the desired evolution of magnetization as the conventional suppression pulses yield divergent flip angles due to changed nutation frequencies. In addition, even small B0 distortions near metallic surfaces may cause off-resonance effects. While robust suppression schemes, such as continuous-wave (CW) irradiation, may dismiss B1 distortions, they typically have a too-narrow bandwidth to suppress susceptibility-broadened signals and may even heat up the volume in proximity to a metal electrode.
For future studies, the QOC pulse design can be adapted to currently relevant topics in electrochemistry, such as the formation of intermediates on the electrode surface during CO2 electrolysis or spatially selective investigations of the solid electrolyte interphase (SEI). Additionally, ν0 and ν1 selectivity of QOC pulses can be combined to achieve both spatially and chemically selective measurements at the same time. To facilitate spatial selectivity at a precisely controlled level, electrodes can also be customized with specific surface adjustments which result in distinct, easily predictable B0 and B1 distortions. In conclusion, the combination of electrochemical in operando NMR, FEM simulations, and QOC pulse optimization enables new experimental approaches with the potential to gain insights into local electrochemical phenomena that have previously been inaccessible and may help in answering complex research questions for which individual singular approaches might be insufficient. However, this workflow might be more difficult in the case of conductive materials with varying properties, such as porous electrodes or inhomogeneously distributed catalyst layers, requiring complex FEM simulations and exhibiting B1 distortions that change during an experiment, leading to broad and transiently changing B1 field distributions. Nevertheless, the presented method allows for the non-invasive and selective investigation of molecules near metal surfaces with high component flexibility and can take advantage of the wide nucleus range NMR has to offer.
TopSpin raw data of the presented measurements and pulse sequences are available with open access on the Jülich DATA repository at https://doi.org/10.26165/JUELICH-DATA/XQT0WN (Kochs et al., 2026). The simulation and optimization codes used in this work and all other data are available from the authors upon request.
The supplement related to this article is available online at https://doi.org/10.5194/mr-7-113-2026-supplement.
Conception and design: JFK, AJR, MiS, SJ, SSK, and JG. Sample preparation and collection of data: JFK and MiS. Optimal control implementation and optimization: AJR. FEM simulation: MaS. Analysis and interpretation of data: JFK, AJR, MiS, MaS, SJ, SSK, and JG. Supervision: SJ, RE, SSK, and JG. Paper preparation: JFK, AJR, MiS, MaS, SJ, SSK, and JG. Funding acquisition: RE and JG Both JFK and AJR contributed equally to the publication and have the right to list their name first in their CV. All of the authors contributed to the article and approved the submitted version.
The contact author has declared that none of the authors has any competing interests.
Publisher's note: Copernicus Publications remains neutral with regard to jurisdictional claims made in the text, published maps, institutional affiliations, or any other geographical representation in this paper. The authors bear the ultimate responsibility for providing appropriate place names. Views expressed in the text are those of the authors and do not necessarily reflect the views of the publisher.
We thank Thomas Schulte-Herbrüggen from the Technical University of Munich and Burkhard Luy from Karlsruhe Institute of Technology for their input regarding ensemble quantum optimal control methods. We also thank Moritz Oberhauser and Matthias J. Brandl from the Bavarian NMR Center of the Technical University of Munich for the fruitful exchange on the intricacies of GRAPE implementations and for their help with implementing the optimally controlled NMR experiments.
The research has been supported by the Deutsche Forschungsgemeinschaft under Germany’s Excellence Strategy – Cluster of Excellence 2186 “The Fuel Science Center” (grant no. 390919832) and the Bundesministerium für Forschung, Technologie und Raumfahrt within the H2Giga project DERIEL (grant no. 03HY122C).
The article processing charges for this open-access publication were covered by the Forschungszentrum Jülich.
This paper was edited by Alexandra Yurkovskaya and reviewed by two anonymous referees.
Aguilera, A. R., MacMillan, B., Krachkovskiy, S., Sanders, K. J., Alkhayri, F., Adam Dyker, C., Goward, G. R., and Balcom, B. J.: A parallel-plate RF probe and battery cartridge for 7Li ion battery studies, J. Magn. Reson., 325, 106943, https://doi.org/10.1016/j.jmr.2021.106943, 2021. a
Bommarito, G. M., Acevedo, D., and Abruna, H. D.: In situ monitoring of electrochemically induced roughening with the crystal truncation rod technique, J. Phys. Chem., 96, 3416–3419, https://doi.org/10.1021/j100187a044, 1992. a
Broyden, C. G.: The convergence of a class of double-rank minimization algorithms 1. General considerations, IMA J. Appl. Math., 6, 76–90, https://doi.org/10.1093/imamat/6.1.76, 1970. a
Byrd, R. H., Lu, P., Nocedal, J., and Zhu, C.: A limited memory algorithm for bound constrained optimization, SIAM J. Sci. Comput., 16, 1190–1208, https://doi.org/10.1137/0916069, 1995. a
Corson, E. R., Kas, R., Kostecki, R., Urban, J. J., Smith, W. A., McCloskey, B. D., and Kortlever, R.: In situ ATR-SEIRAS of carbon dioxide reduction at a plasmonic silver cathode, J. Am. Chem. Soc., 142, 11750–11762, https://doi.org/10.1021/jacs.0c01953, 2020. a, b
Faid, A. Y., Barnett, A. O., Seland, F., and Sunde, S.: Ni/NiO nanosheets for alkaline hydrogen evolution reaction: In situ electrochemical-Raman study, Electrochim. Acta, 361, 137040, https://doi.org/10.1016/j.electacta.2020.137040, 2020. a
Fletcher, R.: A new approach to variable metric algorithms, Comput. J., 13, 317–322, https://doi.org/10.1093/comjnl/13.3.317, 1970. a
Foroozandeh, M. and Singh, P.: Optimal control of spins by analytical Lie algebraic derivatives, Automatica, 129, 109611, https://doi.org/10.1016/j.automatica.2021.109611, 2021. a
Geen, H. and Freeman, R.: Band-selective radiofrequency pulses, J. Magn. Reson., 93, 93–141, https://doi.org/10.1016/0022-2364(91)90034-Q, 1991. a, b
Goldfarb, D.: A family of variable-metric methods derived by variational means, Math. Comput., 24, 23–26, https://doi.org/10.1090/S0025-5718-1970-0258249-6, 1970. a
Goodwin, D. L. and Vinding, M. S.: Accelerated Newton-Raphson GRAPE methods for optimal control, Phys. Rev. Res., 5, L012042, https://doi.org/10.1103/PhysRevResearch.5.L012042, 2023. a
Hamann, C. H. and Vielstich, W.: Elektrochemie, Wiley-VCH, 4th edn., ISBN 978-3-527-31068-5, 2005. a
Holtz, M. E., Yu, Y., Gunceler, D., Gao, J., Sundararaman, R., Schwarz, K. A., Arias, T. A., Abruña, H. D., and Muller, D. A.: Nanoscale imaging of lithium ion distribution during in situ operation of battery electrode and electrolyte, Nano Lett., 14, 1453–1459, https://doi.org/10.1021/nl404577c, 2014. a
Hore, P. J.: Nuclear Magnetic Resonance, Oxford Chemistry Primers, Oxford University Press, Oxford, 2nd edn., ISBN 9780198703419, 2015. a
Huang, X., Plaza, M., Ko, J. Y. P., Abruña, H. D., and Brock, J. D.: Relaxation of asymmetric crystallographic tilt: In situ X-ray diffraction studies of epitaxial electrodeposition of bismuth on GaAs (110), J. Appl. Phys., 124, 035301, https://doi.org/10.1063/1.5026630, 2018. a
Ilott, A. J. and Jerschow, A.: Super-resolution surface microscopy of conductors using magnetic resonance, Sci. Rep., 7, 5425, https://doi.org/10.1038/s41598-017-05429-3, 2017. a
Ilott, A. J., Chandrashekar, S., Klöckner, A., Chang, H. J., Trease, N. M., Grey, C. P., Greengard, L., and Jerschow, A.: Visualizing skin effects in conductors with MRI: 7Li MRI experiments and calculations, J. Magn. Reson., 245, 143–149, https://doi.org/10.1016/j.jmr.2014.06.013, 2014. a, b
Jovanovic, S., Schleker, P. P. M., Streun, M., Merz, S., Jakes, P., Schatz, M., Eichel, R.-A., and Granwehr, J.: An electrochemical cell for in operando 13C nuclear magnetic resonance investigations of carbon dioxide/carbonate processes in aqueous solution, Magn. Reson., 2, 265–280, https://doi.org/10.5194/mr-2-265-2021, 2021. a, b, c
Khaneja, N., Reiss, T., Kehlet, C., Schulte-Herbrüggen, T., and Glaser, S. J.: Optimal control of coupled spin dynamics: design of NMR pulse sequences by gradient ascent algorithms, J. Magn. Reson., 172, 296–305, https://doi.org/10.1016/j.jmr.2004.11.004, 2005. a, b
Kobzar, K., Skinner, T. E., Khaneja, N., Glaser, S. J., and Luy, B.: Exploring the limits of broadband excitation and inversion pulses, J. Magn. Reson., 170, 236–243, https://doi.org/10.1016/j.jmr.2004.06.017, 2004. a
Kobzar, K., Luy, B., Khaneja, N., and Glaser, S. J.: Pattern pulses: design of arbitrary excitation profiles as a function of pulse amplitude and offset, J. Magn. Reson., 173, 229–235, https://doi.org/10.1016/j.jmr.2004.12.005, 2005. a, b
Kobzar, K., Skinner, T. E., Khaneja, N., Glaser, S. J., and Luy, B.: Exploring the limits of broadband excitation and inversion: II. Rf-power optimized pulses, J. Magn. Reson., 194, 58–66, https://doi.org/10.1016/j.jmr.2008.05.023, 2008. a
Kobzar, K., Ehni, S., Skinner, T. E., Glaser, S. J., and Luy, B.: Exploring the limits of broadband 90° and 180° universal rotation pulses, J. Magn. Reson., 225, 142–160, https://doi.org/10.1016/j.jmr.2012.09.013, 2012. a
Köcher, S. S., Heydenreich, T., Zhang, Y., Reddy, G. N. M., Caldarelli, S., Yuan, H., and Glaser, S. J.: Time-optimal excitation of maximum quantum coherence: Physical limits and pulse sequences, J. Chem. Phys., 144, 164103, https://doi.org/10.1063/1.4945781, 2016. a
Kochs, J. F., Römer, Armin J., Schatz, Michael, Streun, Matthias, Eichel, Rüdiger-A., Köcher, Simone S., and Granwehr, J.: Replication Data for: Optimally controlled nuclear magnetic resonance (NMR) in electrochemistry: Larmor versus nutation frequency selective spin excitation for locally selective NMR experiments, V1, Jülich DATA [data set], https://doi.org/10.26165/JUELICH-DATA/XQT0WN, 2026. a
Lee, S., Moysiadou, A., Chu, Y.-C., Chen, H. M., and Hu, X.: Tracking high-valent surface iron species in the oxygen evolution reaction on cobalt iron (oxy)hydroxides, Energy Environ. Sci., 15, 206–214, https://doi.org/10.1039/D1EE02999A, 2022. a
McKay, R. T.: Recent advances in solvent suppression for solution NMR: A practical reference, in: Annual Reports on NMR Spectroscopy, edited by: Webb, G., vol. 66 of Annual Reports on NMR Spectroscopy, 33–76, Academic Press, ISBN 978-0-12-374737-2, https://doi.org/10.1016/S0066-4103(08)00402-X, 2009. a, b
Mohammadi, M. and Jerschow, A.: In situ and operando magnetic resonance imaging of electrochemical cells: A perspective, J. Magn. Reson., 308, 106600, https://doi.org/10.1016/j.jmr.2019.106600, 2019. a
Pecher, O., Carretero-Gonzalez, J., Griffith, K. J., and Grey, C. P.: Materials' methods: NMR in battery research, Chem. Mater., 29, 213–242, https://doi.org/10.1021/acs.chemmater.6b03183, 2017. a
Richards, J. A. and Evans, D. H.: Flow cell for electrolysis within the probe of a nuclear magnetic resonance spectrometer, Anal. Chem., 47, 964–966, https://doi.org/10.1021/ac60356a016, 1975. a
Sanders, K. J., Aguilera, A. R., Keffer, J. R., Balcom, B. J., Halalay, I. C., and Goward, G. R.: Transient lithium metal plating on graphite: Operando 7Li nuclear magnetic resonance investigation of a battery cell using a novel RF probe, Carbon, 189, 377–385, https://doi.org/10.1016/j.carbon.2021.12.082, 2022. a
Schatz, M., Jovanovic, S., Eichel, R.-A., and Granwehr, J.: Quantifying local pH changes in carbonate electrolyte during copper-catalysed Formula: see text electroreduction using in operando formula, Sci. Rep., 12, 8274, https://doi.org/10.1038/s41598-022-12264-8, 2022. a
Schatz, M., Kochs, J. F., Jovanovic, S., Eichel, R.-A., and Granwehr, J.: Interplay of local pH and cation hydrolysis during electrochemical CO2 reduction visualized by in operando chemical shift-resolved magnetic resonance imaging, J. Phys. Chem. C, 127, 18986–18996, https://doi.org/10.1021/acs.jpcc.3c03563, 2023. a, b
Schatz, M., Streun, M., Jovanovic, S., Eichel, R.-A., and Granwehr, J.: Workflow for systematic design of electrochemical in operando NMR cells by matching B0 and B1 field simulations with experiments, Magn. Reson., 5, 167–180, https://doi.org/10.5194/mr-5-167-2024, 2024. a, b
Shanno, D. F.: Conditioning of quasi-Newton methods for function minimization, Math. Comput., 24, 647–656, https://doi.org/10.1090/S0025-5718-1970-0274029-X, 1970. a
Vashaee, S., Goora, F., Britton, M. M., Newling, B., and Balcom, B. J.: Mapping B1-induced eddy current effects near metallic structures in MR images: a comparison of simulation and experiment, J. Magn. Reson., 250, 17–24, https://doi.org/10.1016/j.jmr.2014.10.016, 2015. a
Virtanen, P., Gommers, R., Oliphant, T. E., Haberland, M., Reddy, T., Cournapeau, D., Burovski, E., Peterson, P., Weckesser, W., Bright, J., van der Walt, S. J., Brett, M., Wilson, J., Millman, K. J., Mayorov, N., Nelson, A. R. J., Jones, E., Kern, R., Larson, E., Carey, C. J., Polat, İ., Feng, Y., Moore, E. W., VanderPlas, J., Laxalde, D., Perktold, J., Cimrman, R., Henriksen, I., Quintero, E. A., Harris, C. R., Archibald, A. M., Ribeiro, A. H., Pedregosa, F., van Mulbregt, P., and SciPy 1.0 Contributors: SciPy 1.0: Fundamental algorithms for scientific computing in Python, Nat. Methods, 17, 261–272, https://doi.org/10.1038/s41592-019-0686-2, 2020. a
Walder, B. J., Conradi, M. S., Borchardt, J. J., Merrill, L. C., Sorte, E. G., Deichmann, E. J., Anderson, T. M., Alam, T. M., and Harrison, K. L.: NMR spectroscopy of coin cell batteries with metal casings, Sci. Adv., 7, eabg8298, https://doi.org/10.1126/sciadv.abg8298, 2021. a, b
Williamson, M. J., Tromp, R. M., Vereecken, P. M., Hull, R., and Ross, F. M.: Dynamic microscopy of nanoscale cluster growth at the solid-liquid interface, Nat. Mater., 2, 532–536, https://doi.org/10.1038/nmat944, 2003. a
Wolff, B., Schleker, P. P. M., Ditler, H., Rahe, C., Hetzke, T., Jakes, P., Eichel, R.-A., and Granwehr, J.: In operando EPR and NMR cell for correlative characterisation of battery electrodes, ChemRxiv [preprint], https://doi.org/10.26434/chemrxiv-2025-g1sv5, 2025. a
Zhang, Z., Marble, A. E., MacGregor, R. P., Martin, J., Wang, H., and Balcom, B. J.: Zero-mode TEM parallel-plate resonator for high-resolution thin film magnetic resonance imaging, Can. J. Chem., 89, 745–753, https://doi.org/10.1139/v11-018, 2011. a
Zheng, G. and Price, W. S.: Solvent signal suppression in NMR, Prog. Nucl. Magn. Reson. Spectrosc., 56, 267–288, https://doi.org/10.1016/j.pnmrs.2010.01.001, 2010. a
Zhu, C., Byrd, R. H., Lu, P., and Nocedal, J.: Algorithm 778: L-BFGS-B: Fortran subroutines for large-scale bound-constrained optimization, ACM Trans. Math. Softw., 23, 550–560, https://doi.org/10.1145/279232.279236, 1997. a
Zoski, C. G.: Handbook of Electrochemistry, Elsevier, Amsterdam and Boston, 1st edn., ISBN 9780444519580, https://doi.org/10.1016/B978-0-444-51958-0.X5000-9, 2007. a