the Creative Commons Attribution 4.0 License.
the Creative Commons Attribution 4.0 License.
 | 06 Jul 2021
Detecting anisotropic segmental dynamics in disordered proteins by cross-correlated spin relaxation
Clemens Kauffmann
Irene Ceccolini
Georg Kontaxis
Robert Konrat
Among the numerous contributions of Geoffrey Bodenhausen to NMR spectroscopy, his developments in the field of spin-relaxation methodology and theory will definitely have a long lasting impact. Starting with his seminal contributions to the excitation of multiple-quantum coherences, he and his group thoroughly investigated the intricate relaxation properties of these “forbidden fruits” and developed experimental techniques to reveal the relevance of previously largely ignored cross-correlated relaxation (CCR) effects, as “the essential is invisible to the eyes”. Here we consider CCR within the challenging context of intrinsically disordered proteins (IDPs) and emphasize its potential and relevance for the studies of structural dynamics of IDPs in the future years to come. Conventionally, dynamics of globularly folded proteins are modeled and understood as deviations from otherwise rigid structures tumbling in solution. However, with increasing protein flexibility, as observed for IDPs, this apparent dichotomy between structure and dynamics becomes blurred. Although complex dynamics and ensemble averaging might impair the extraction of mechanistic details even further, spin relaxation uniquely encodes a protein's structural memory. Due to significant methodological developments, such as high-dimensional non-uniform sampling techniques, spin relaxation in IDPs can now be monitored in unprecedented resolution. Not embedded within a rigid globular fold, conventional 15N spin probes might not suffice to capture the inherently local nature of IDP dynamics. To better describe and understand possible segmental motions of IDPs, we propose an experimental approach to detect the signature of anisotropic segmental dynamics by quantifying cross-correlated spin relaxation of individual 15N1HN and spin pairs. By adapting Geoffrey Bodenhausen's symmetrical reconversion principle to obtain zero frequency spectral density values, we can define and demonstrate more sensitive means to characterize anisotropic dynamics in IDPs.
- Article
(1257 KB) - Full-text XML
-
Supplement
(69 KB) - BibTeX
- EndNote


Geoffrey Bodenhausen's 70th anniversary marks an ideal occasion to take a fresh look at some of his numerous contributions to spin-relaxation methodology and theory. By considering his experiments within the challenging context of intrinsically disordered proteins (IDPs), we want to emphasize their potential and relevance in the future years to come. Arguably, this rediscovery might require some collective effort, as current trends appear to point in the opposite direction. As Paul Schanda put it recently: “The popularity of detailed spin-relaxation measurements in liquids, en vogue 10 or 20 years ago, is declining; […] with lengthy measurements it is not easy to gain much more insight than `loops are more flexible than secondary structures', which often does not answer mechanistic questions.” (Schanda, 2019, p. 3–4). While intentionally exaggerated, this statement does point to some of the inherent limitations of relaxation experiments. Owing to their convoluted nature, spin relaxation reports on protein dynamics only in ambiguous terms. A variety of stochastic processes can lead to time correlation functions (TCFs) of identical shape and form (Richert and Blumen, 1994, p. 1–7). In addition, the TCF is not probed directly, only its spectral density; i.e., its Fourier transform is sampled at a few select frequencies. Thus, with far more detailed structural models at hand, protein dynamics are often understood as mere perturbations of otherwise rigid bodies tumbling in solution (Lipari and Szabo, 1982; Halle and Wennerström, 1981; Clore et al., 1990; Halle, 2009). Relaxation experiments commonly employed to calculate protein structures, such as nuclear Overhauser effects (NOEs) and paramagnetic relaxation enhancements (PREs), are usually modeled without accounting for their dynamic nature (Iwahara et al., 2004; Clore and Iwahara, 2009; Xue et al., 2009; Vögeli, 2014). In a sense, protein dynamics might appear separate from protein structure, at least within the structure–function paradigm.
However, with increasing protein flexibility this apparent dichotomy becomes blurred as structure and dynamics can no longer be considered independent of each other. While complex dynamics and ensemble averaging obfuscate mechanistic details even further, the structural information content of relaxation parameters becomes increasingly apparent. In comparison to simple population-averaged quantities, such as chemical shifts or scalar couplings, spin relaxation uniquely encodes a system's structural memory, i.e., the temporal persistence of concerted motions and structural arrangements. Somewhat counterintuitively, spin-relaxation experiments are among the prime sources of structural information available for disordered systems. However, due to a general lack of analytical descriptions for IDP dynamics (Modig and Poulsen, 2008; Idiyatullin et al., 2001; Bussell and Eliezer, 2001; Kadeřávek et al., 2014; Khan et al., 2015), this notion has been of somewhat academic nature until the recent past. Continuous developments in molecular dynamics (MD) simulation protocols (Piana et al., 2015, 2020; Rauscher et al., 2015; Robustelli et al., 2018; Zerze et al., 2019; Gopal et al., 2021; Shea et al., 2021) demonstrate how this gap can finally be bridged, allowing us to validate, refine and/or analyze dynamic ensemble representations of proteins in solution (Kämpf et al., 2018; Kümmerer et al., 2020; Salvi et al., 2016, 2017). With the necessary timescales becoming increasingly accessible (Stone et al., 2007, 2010; Salomon-Ferrer et al., 2013; Eastman et al., 2017) and the spectral resolution provided by high-dimensional non-uniform sampling experiments to overcome the problem of spectral overlap (Grudzia̧ż et al., 2018), spin relaxation in IDPs can be investigated in unprecedented fashion.
This aspect alone suggests a systematic reassessment and evaluation of less commonly employed experiments. Far more pressing, in our opinion, is the inherently local nature of spin relaxation in IDPs. In contrast to folded proteins, spins in IDPs are not embedded within a fixed molecular tumbling frame. Thus, a single 15N nucleus per residue as a dynamic probe might not suffice to capture the underlying motions in adequate detail. While detecting and quantifying the presence of anisotropy in IDP dynamics might seem like a rather academic endeavor, it represents an important stepping stone towards the structural interpretation of other experiments. As we recently demonstrated, an appropriate estimate for the average correlation time is an important prerequisite for the angular evaluation of cross-correlated relaxation (CCR) of remote spins (Kauffmann et al., 2021).
More immediate in its structural implications would be the presence of diffusion anisotropy, which has been hypothesized to be of substantial size even in highly disordered proteins such as α-synuclein. Specifically, segmental tumbling of α-helical and extended chain conformations has been implied to lead to pronounced diffusion anisotropy effects for intraresidual and sequential 1H−1H NOEs (Ying et al., 2014; Mantsyzov et al., 2014, 2015). At the same time, the 3D GAF model (Bremi and Brüschweiler, 1997; Lienin et al., 1998) has been invoked to further rationalize the presence of anisotropic dynamics on the local scale of the peptide plane. This model has recently been reframed by Salvi et al. (2017) to analyze MD-simulated 15N relaxation of a partially disordered protein. In essence, it was demonstrated that NHN TCFs are well described by the CαCα TCFs of the same peptide plane as long as variations of the flanking dihedral angles and NHN librations are accounted for. Explicit corrections for possible effects of anisotropic segmental tumbling were not required. However, noticeable deviations could be observed for the transverse 15N relaxation of the slowly moving residual α-helix. Marcellini et al. (2020) have reported pronounced diffusion anisotropy within the α-helical region of an otherwise disordered construct. Flexible residues were affected noticeably less. It was suggested this might be due to their average orientation in the molecular tumbling frame (Marcellini et al., 2020). The SRLS model of Tugarinov et al. (2001) and Meirovitch et al. (2006) also predicts pronounced anisotropy for α-helices and β-sheets. However, loops and terminal chain segments appear isotropic, asserting that proteins with substantial internal mobility are best represented by an isotropic global diffusion tensor (Zerbetto et al., 2011).
Arguably, this somewhat ambiguous body of evidence illustrates the inevitable difficulties that come with extending concepts of folded proteins to IDPs. In fact, many of the above observations might very well be case-dependent. In the present study, we want to approach this question in a more agnostic manner. Are there experimental ways to better detect the signature of anisotropic dynamics in IDPs? At what level of evidence could we evoke the mental image of extended chains and α-helical segments tumbling in solution? The principal difficulty in characterizing these structural elements lies in their translational periodicity. In an α-helix, NHN vectors are strongly aligned along the main axis, while in an extended chain they are oriented perpendicularly. In order to detect possible orientational biases in their relaxation behavior, additional spin probes with different orientations must be considered. While CαHα might be suitable for α-helices (Barnes et al., 2019), its orientation is too similar to NHN in the extended chain conformation. Moreover, since it does not share a peptide plane with NHN, it varies as a function of ϕ and ψ as do the 1H−1H intraresidual and sequential NOEs. Spin probes within the same peptide plane and thus less ambiguous orientations would certainly be preferable.
For IDPs in particular, Kadeřávek et al. (2014) have shown that the NHN spectral density is best mapped by a combination of transversal and longitudinal CCR rates, employing Geoffrey Bodenhausen's symmetrical reconversion principle (Pelupessy et al., 2003, 2007). Together with Bodenhausen and coworkers, this concept was later extended to measure the zero frequency spectral density in a single experiment (Kadeřávek et al., 2015). By translating these concepts to the C′Cα spin pair, we want to derive and demonstrate more sensitive means to detect anisotropic segmental dynamics in IDPs.
Our aim is to define an experimental measure for anisotropic segmental dynamics in IDPs. While the measure itself should be general, the considered source of anisotropy will be rather specific. To assess the sensitivity of the proposed protocol, we resort to the simplified image of extended chain and α-helical segments tumbling in solution as previously asserted by Mantsyzov et al. (2014). Before considering experimental aspects, we start by defining the spectral density. Sampled at zero frequency and/or (combinations of) the involved Larmor frequencies, it constitutes the fundamental quantity of all spin-relaxation experiments:
with the time correlation function (TCF),
where is the second-order Legendre polynomial, u and v represent either dipolar unit vectors or principal components of chemical shift anisotropy (CSA) tensors. Note that our simplified definition of the TCF implicitly assumes that time-dependent distance fluctuations factorize and can thus be absorbed into constant coefficients. This requirement will be well satisfied for the spins considered henceforth.
For most processes, the TCF can be described as a sum or distribution of exponential decays (Lipari and Szabo, 1982; Idiyatullin et al., 2001; Modig and Poulsen, 2008; Khan et al., 2015):
Evaluating at t=0 yields a type of normalization condition,
which equates to 1 for the familiar case of auto-correlation (u=v). For cross-correlation (u≠v), Eq. (4) is bounded within .
The spectral density of Eq. (3) is a sum of Lorentzian functions
Note that, depending on how the TCF and the spectral density are defined, Eq. (5) might come with additional coefficients such as the familiar factor of (Lipari and Szabo, 1982). We prefer the above definitions as they highlight Ju,v(ω) as a weighted average. At zero frequency all τk's are weighted equally; i.e., J(0) encodes the average correlation time. With increased frequency, the impact of larger τk becomes less pronounced. This is illustrated in Fig. 1 for a selection of Larmor frequencies assuming a magnetic field strength of 18.8 T (800 MHz proton Larmor frequency).
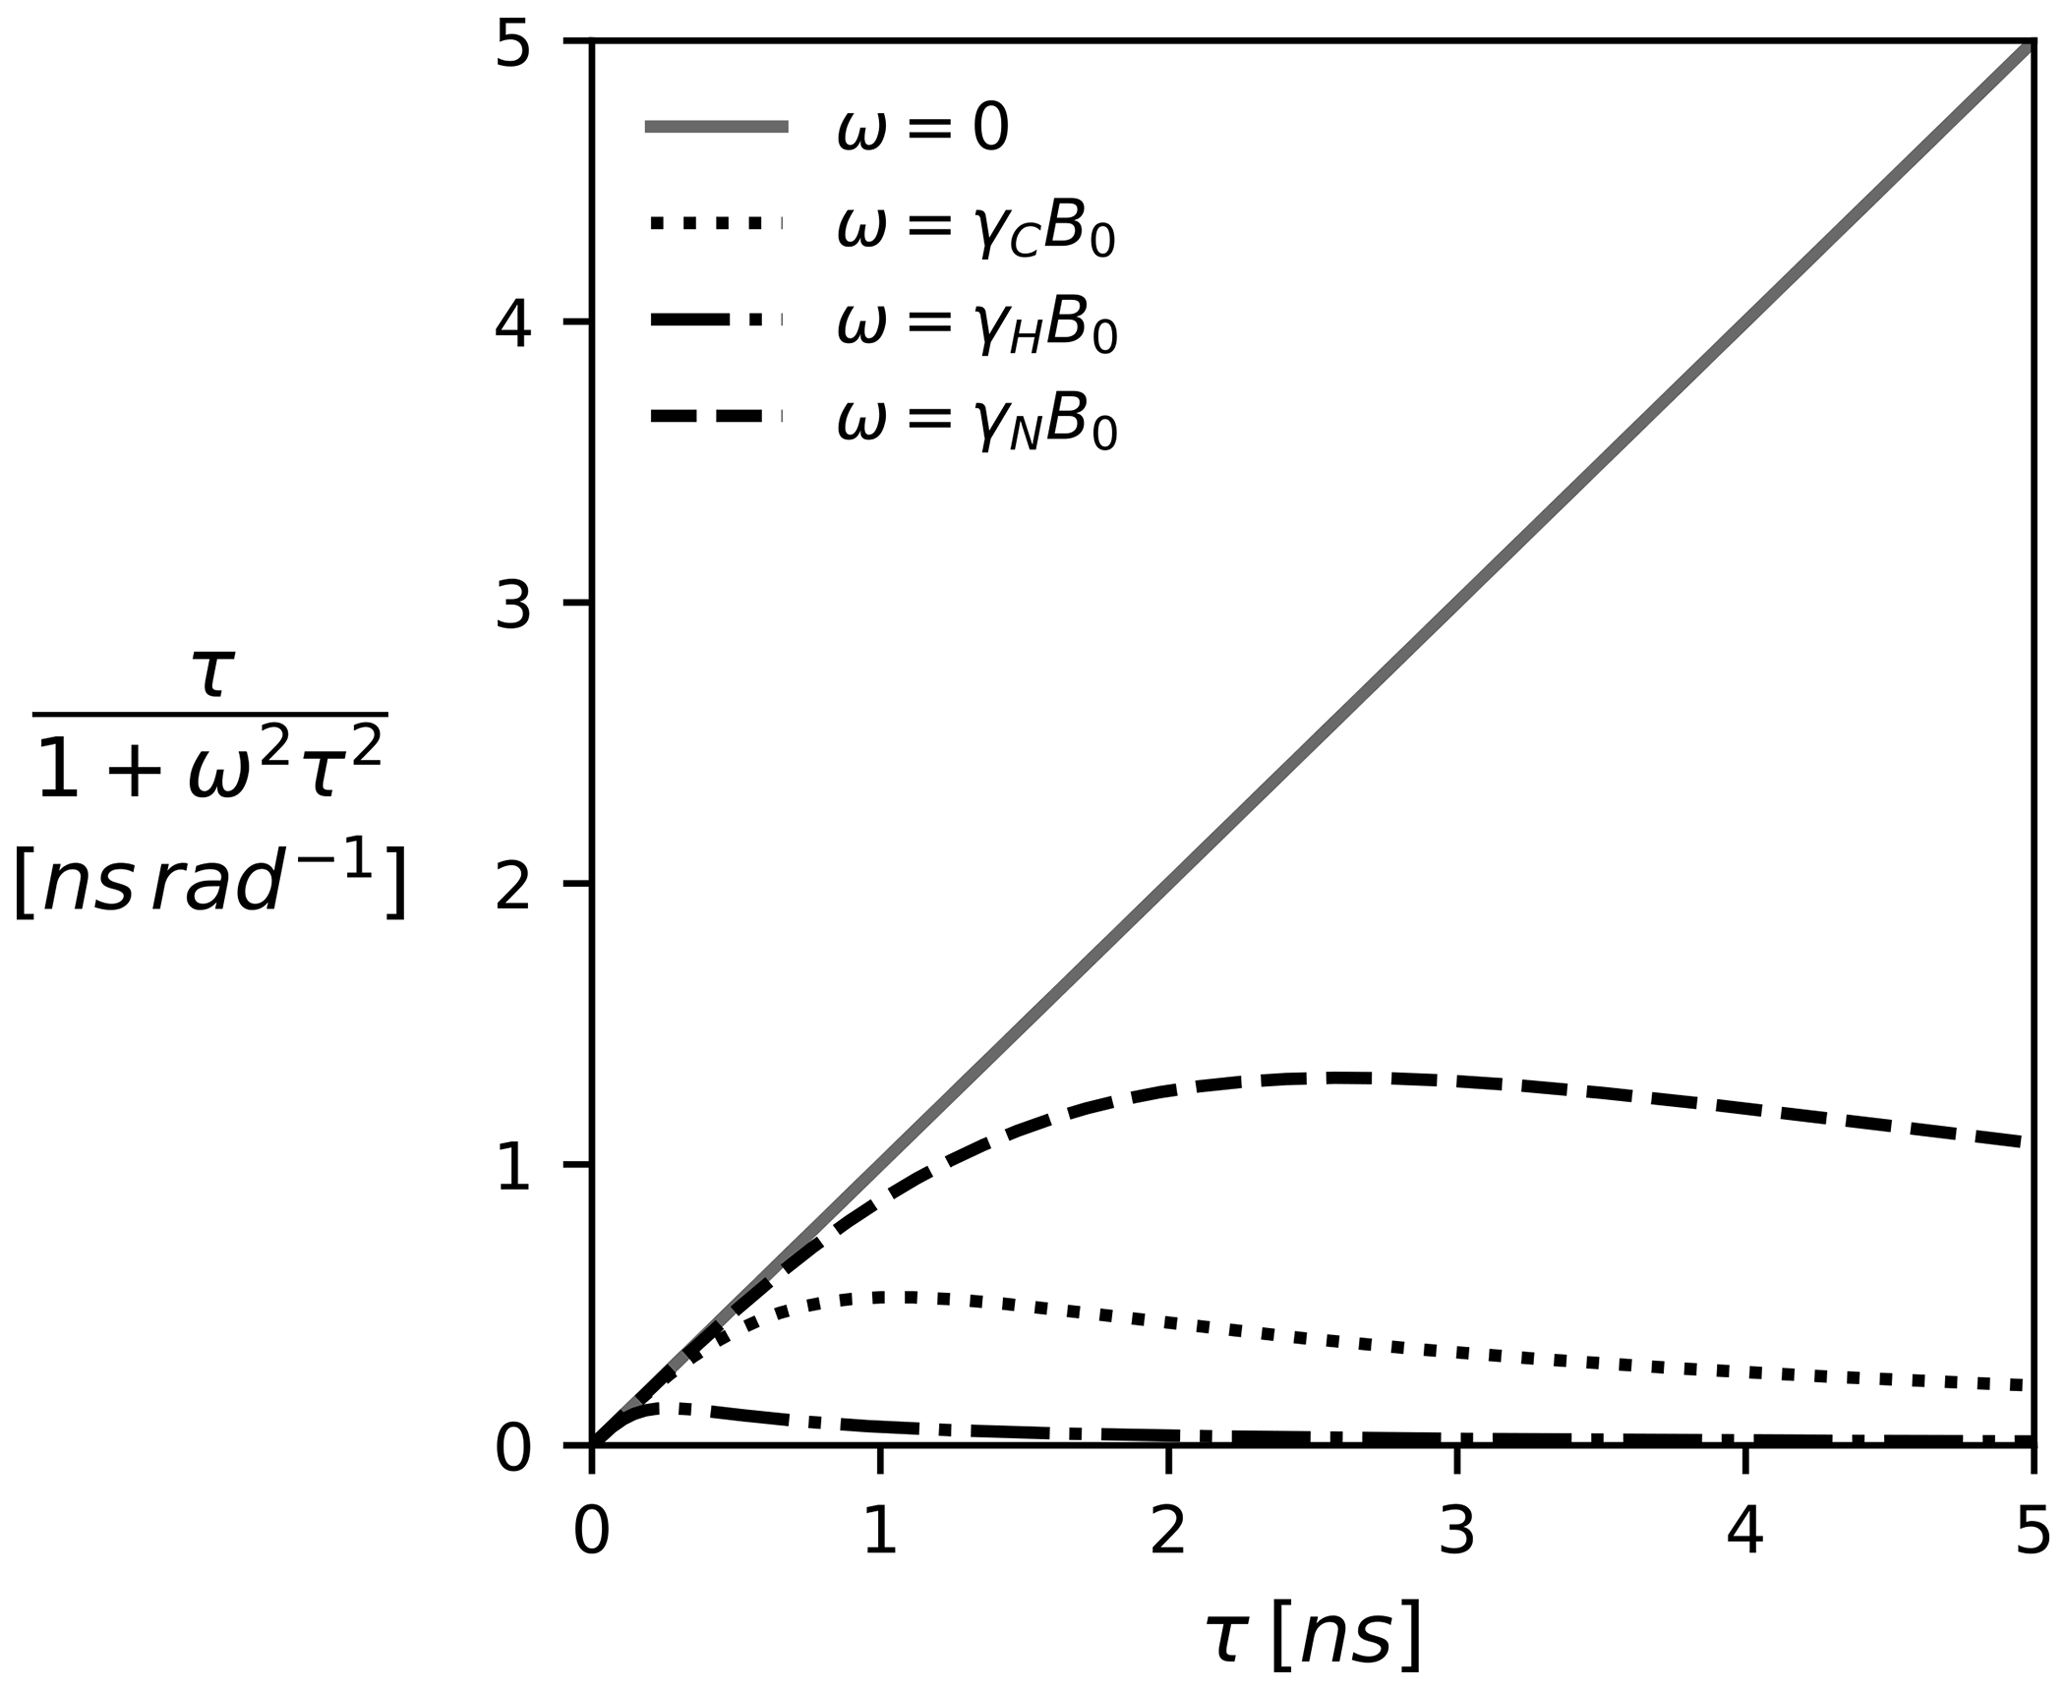
Figure 1The Lorentzian as a function of the correlation time τ and the (Larmor) frequency. The spectral density J(ω), which is modeled as a linear combination of Lorentzian functions, can be pictured as a weighted average of all correlation times τ. Since J(0) weights all correlation times equally, it represents the component most sensitive to correlation times >1 ns. The magnetic field B0 is 18.8 T (800 MHz proton Larmor frequency).
Detecting anisotropy amounts to quantifying orientational biases in ak and τk. Similarly to Mantsyzov et al. (2014), we will attribute these biases to relative orientations in idealized extended chain and α-helical segments. These structural elements are well described by an axially symmetric diffusion tensor, which yields the following expression for the spectral density (Tjandra et al., 1996; Woessner, 1962):
where
and θ and ϕ denote the polar angles in the tumbling frame. The τk's correspond to the inverted eigenvalues of the axially symmetric diffusion tensor:
with . With u and v alone, Eq. (6) would not allow us to distinguish between size effects in τk (i.e., “segment length”) and orientational biases in Ak(u,v) (i.e., “secondary structure”). To quantify the anisotropy () only, we consider another interaction described by a second set of vectors (x, y) embedded with different orientations in the same tumbling frame and focus our attention on J(0) for three reasons. First and foremost, J(0) is the component most sensitive to the τk≥1 ns (cf. Fig. 1) commonly associated with tumbling motions (Kämpf et al., 2018). Secondly, the zero frequency does not depend on the type of nuclei involved. Lastly, J(0) allows us to define a convenient ratio,
such that the explicit size dependency cancels out. In general, if (u,v) and (x,y) have fixed relative orientations and experience the same dynamics, we obtain the isotropic edge case:
Thus, the ratio (Eq. 9) encodes a simple and intuitive relation: isotropic motions tend towards the limit (Eq. 10), while anisotropic motions deviate from it. Importantly, the source of anisotropy is not essential. The invoked model of a tumbling symmetric top, Eq. (6), does not need to apply in any strict sense; rather, it is used to assess the sensitivity of the J(0) ratio (Eq. 9) to its associated features. Presuming that segmental arrangements are sufficiently stable, remnants of Eq. (6) might still be detectable even in the case of pronounced local mobility.
In general, assessing the effects of internal motions on Eq. (6) is not straightforward. Even for folded proteins, the commonly employed model-free (MF) (Lipari and Szabo, 1982) and extended MF (Clore et al., 1990) approaches are not strictly applicable in the case of anisotropic diffusion (Daragan and Mayo, 1999; Halle, 2009). For CCR in particular, the proposed adaptations can become quite intricate (Vögeli, 2010). Geoffrey Bodenhausen and coworkers have investigated this topic in a series of publications (Deschamps and Bodenhausen, 2001; Deschamps, 2002; Vugmeyster et al., 2004; Abergel and Bodenhausen, 2004, 2005; Nodet et al., 2008). Given the toy nature of the considered model, we will assess the presence of fast, isotropic motions as simply as possible by introducing a fourth Lorentzian:
with , where τint is the average correlation time of the fast internal motion. The generalized order parameter acts as a weight balancing the contributions of slow anisotropic tumbling and fast isotropic motions. To account for the angular relation between u and v, a3 necessarily corresponds to P2(u⋅v), which follows intuitively from condition Eq. (4), assuming a fixed angle between u and v.
Of course, the additional Lorentzian can be rationalized in terms of established models. As shown in the Appendix, Eq. (11) corresponds to a simplification of the MF-like extension proposed by Ghose et al. (1998), Eq. (A1) and generalized by Vögeli and Yao (2009) and Vögeli (2010). In this model, the generalized order parameters depend on k as well; i.e., the weighting between isotropic and anisotropic contributions can indeed vary between different k's. Using a single order parameter is exact only if the molecule is fully rigid (S2=1) or if the dynamics are entirely isotropic ( or S2=0). In the case of pronounced diffusion anisotropy and intermediate local mobility, Eq. (11) is only an approximate interpolation between these edge cases. Still, it is worth noting that the use of a single order parameter is both a common heuristic to account for the effects of local dynamics on experimental CCR rates (Vögeli and Yao, 2009) and an established approximation for sufficiently small angles between u and v (Tjandra et al., 1996; Kroenke et al., 1998). To keep the amount of parameters manageable, possible differences in local dynamics for different k and/or between (u,v) and (x,y) are not reflected in Eq. (11). Systematic differences in local peptide plane dynamics (Chang and Tjandra, 2005; Ferrage et al., 2006; Wang et al., 2006; Salvi et al., 2017) will necessarily result in deviations from the isotropic case, Eq. (10). While local motions could be modeled in more detail to better match the shape of the TCF using, for example, an extended MF approach (Clore et al., 1990), correlation time distributions (Hsu et al., 2018) or dynamic detectors (Smith et al., 2017, 2019), we only intend to divide J(0), i.e., the TCF's enclosed area, into contributions with and without orientational biases in an intuitive and simple manner. Attributed solely to the Ak, Eq. (7), we now consider the effect of these biases from an experimental perspective.
We will assume the canonical peptide plane geometry of Corey et al. (1953) as depicted in Fig. 2, including approximate principal components of the CSA tensors for 15N and 13C′ adapted from Geoffrey Bodenhausen and coworkers (Cisnetti et al., 2004; Loth et al., 2005).
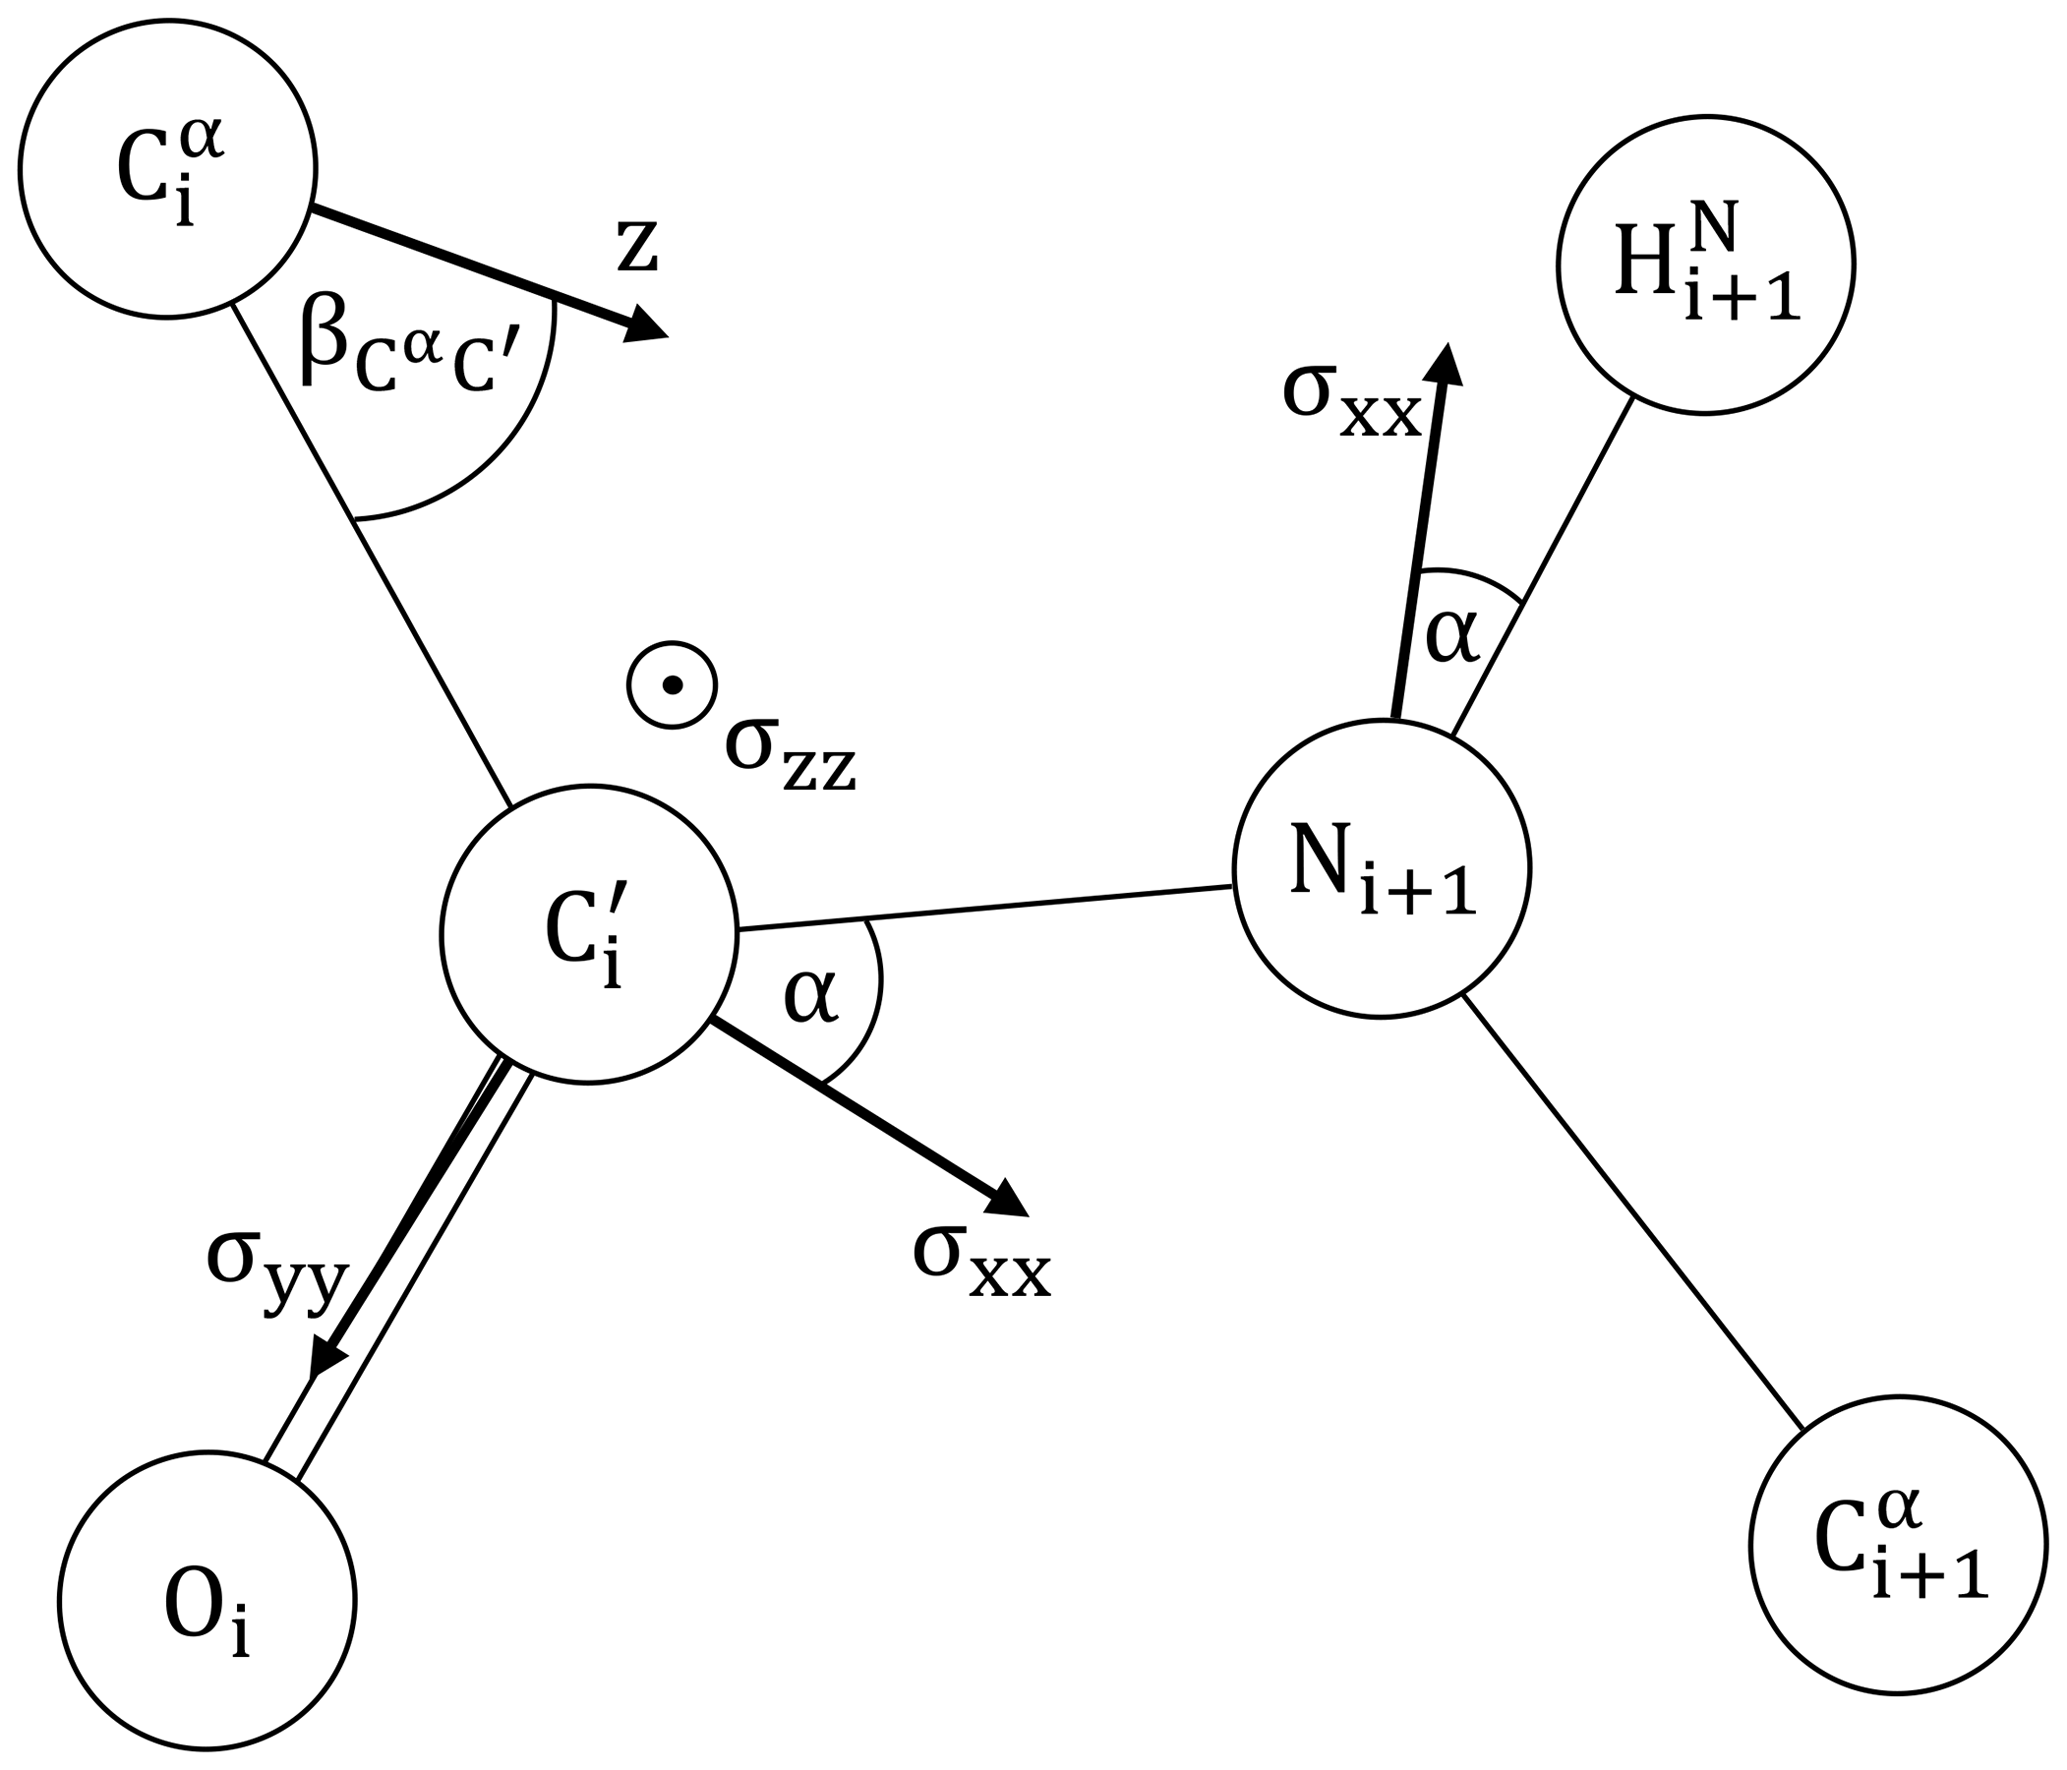
Figure 2The peptide plane as defined by Corey et al. (1953): Å, Å, Å, Å. ∘, ∘, ∘, ∘, ∘ and ∘. is taken from Ottiger and Bax (1998). The 15N and 13C′ CSA principal components are adapted from Bodenhausen and coworkers (Cisnetti et al., 2004; Loth et al., 2005). 15N: ppm, α=20∘. 13C′: σxx=249.4 ppm, σzz=87.9 ppm, α=37∘. σyy=191.1 ppm is obtained from the average chemical shift of ubiquitin (BMRB 17769) (Cornilescu et al., 1998), following the suggested calibration (Cisnetti et al., 2004). The main axis z of the diffusion anisotropy tensor is assumed to lie in the peptide plane. Its orientation is encoded by .
As demonstrated by Kadeřávek et al. (2014), the spectral densities of IDPs are best mapped by combining the transversal (Γxy) and the longitudinal (Γz) CCR rates between the 15N CSA and the NHN dipole. Employing the expressions of Bodenhausen and coworkers (Cisnetti et al., 2004), we have
where μ0 is the vacuum permeability, ![]() is the reduced Planck constant, γ is the gyromagnetic ratio, r is the distance between the nuclei, B0 is the magnetic field strength and is the size difference of the 15N CSA principal components (in ppm). Mapping JNH,xx(0) amounts to the simple subtraction .
is the reduced Planck constant, γ is the gyromagnetic ratio, r is the distance between the nuclei, B0 is the magnetic field strength and is the size difference of the 15N CSA principal components (in ppm). Mapping JNH,xx(0) amounts to the simple subtraction .
To complement these rates, we consider their counterparts for the 13C′ CSA and the C′Cα dipole:
with xx, yy and zz referring to the principal components of the fully anisotropic 13C′ CSA tensor. Again, high frequency contributions can be eliminated via the linear combination .
While the measurement of transverse CCR is well established, longitudinal CCR has been studied considerably less. In part this is due to subtleties of the involved relaxation pathways which involve multi-exponential auto- and cross-correlated relaxation effects. Another reason lies in technical limitations as longitudinal relaxation rates are generally smaller due to their Larmor frequency dependence. Notably, this effect is far less pronounced for the smaller correlation times present in IDPs (cf. Fig. 1). While 15N1HN relaxation is well understood and several sensitive NMR techniques have been proposed to measure and (Tjandra et al., 1996; Kroenke et al., 1998; Pelupessy et al., 2003, 2007; Kadeřávek et al., 2015), 13C′ relaxation is generally more problematic (Dayie and Wagner, 1997; Wang et al., 2006). Since we could not find any previous attempts to measure the longitudinal CCR rate in the literature, we see fit to assess its general feasibility.
Aside from the symmetrical reconversion principle of Bodenhausen and coworkers (Pelupessy et al., 2003, 2007), CSA-DD CCR can be measured either by monitoring the relaxation asymmetry of the doublet or by means of a “quantitative gamma” experiment in which the sum and difference of the 13C′ doublet relaxation are measured independently. In contrast to previous approaches relying on two separate experiments (“reference” and “cross”) (Schwalbe et al., 2002), we determine by quantifying the different longitudinal relaxation in the doublet recorded in a non-constant-time 13C′ evolution following the relaxation period. Transverse relaxation is measured by more conventional quantification of differential line broadening of the doublet recorded in constant-time mode.
To obtain sufficient spectral resolution, the CCR rates are measured directly from the intensity difference in a 13Cα-coupled 3D HNCO experiment: (i) in the case of transversal CCR by quantification of differential line broadening of the doublet during constant-time 13C′ evolution and (ii) for longitudinal CCR during real-time 13Cα-coupled 13C′ evolution preceded by a longitudinal relaxation delay T during which CSA-DD CCR is active. This approach yields reliable longitudinal CCR rates as long as the mixing time T is short compared to 13C′ T1 relaxation. Typical data obtained for the small globular protein ubiquitin are shown in Fig. 3
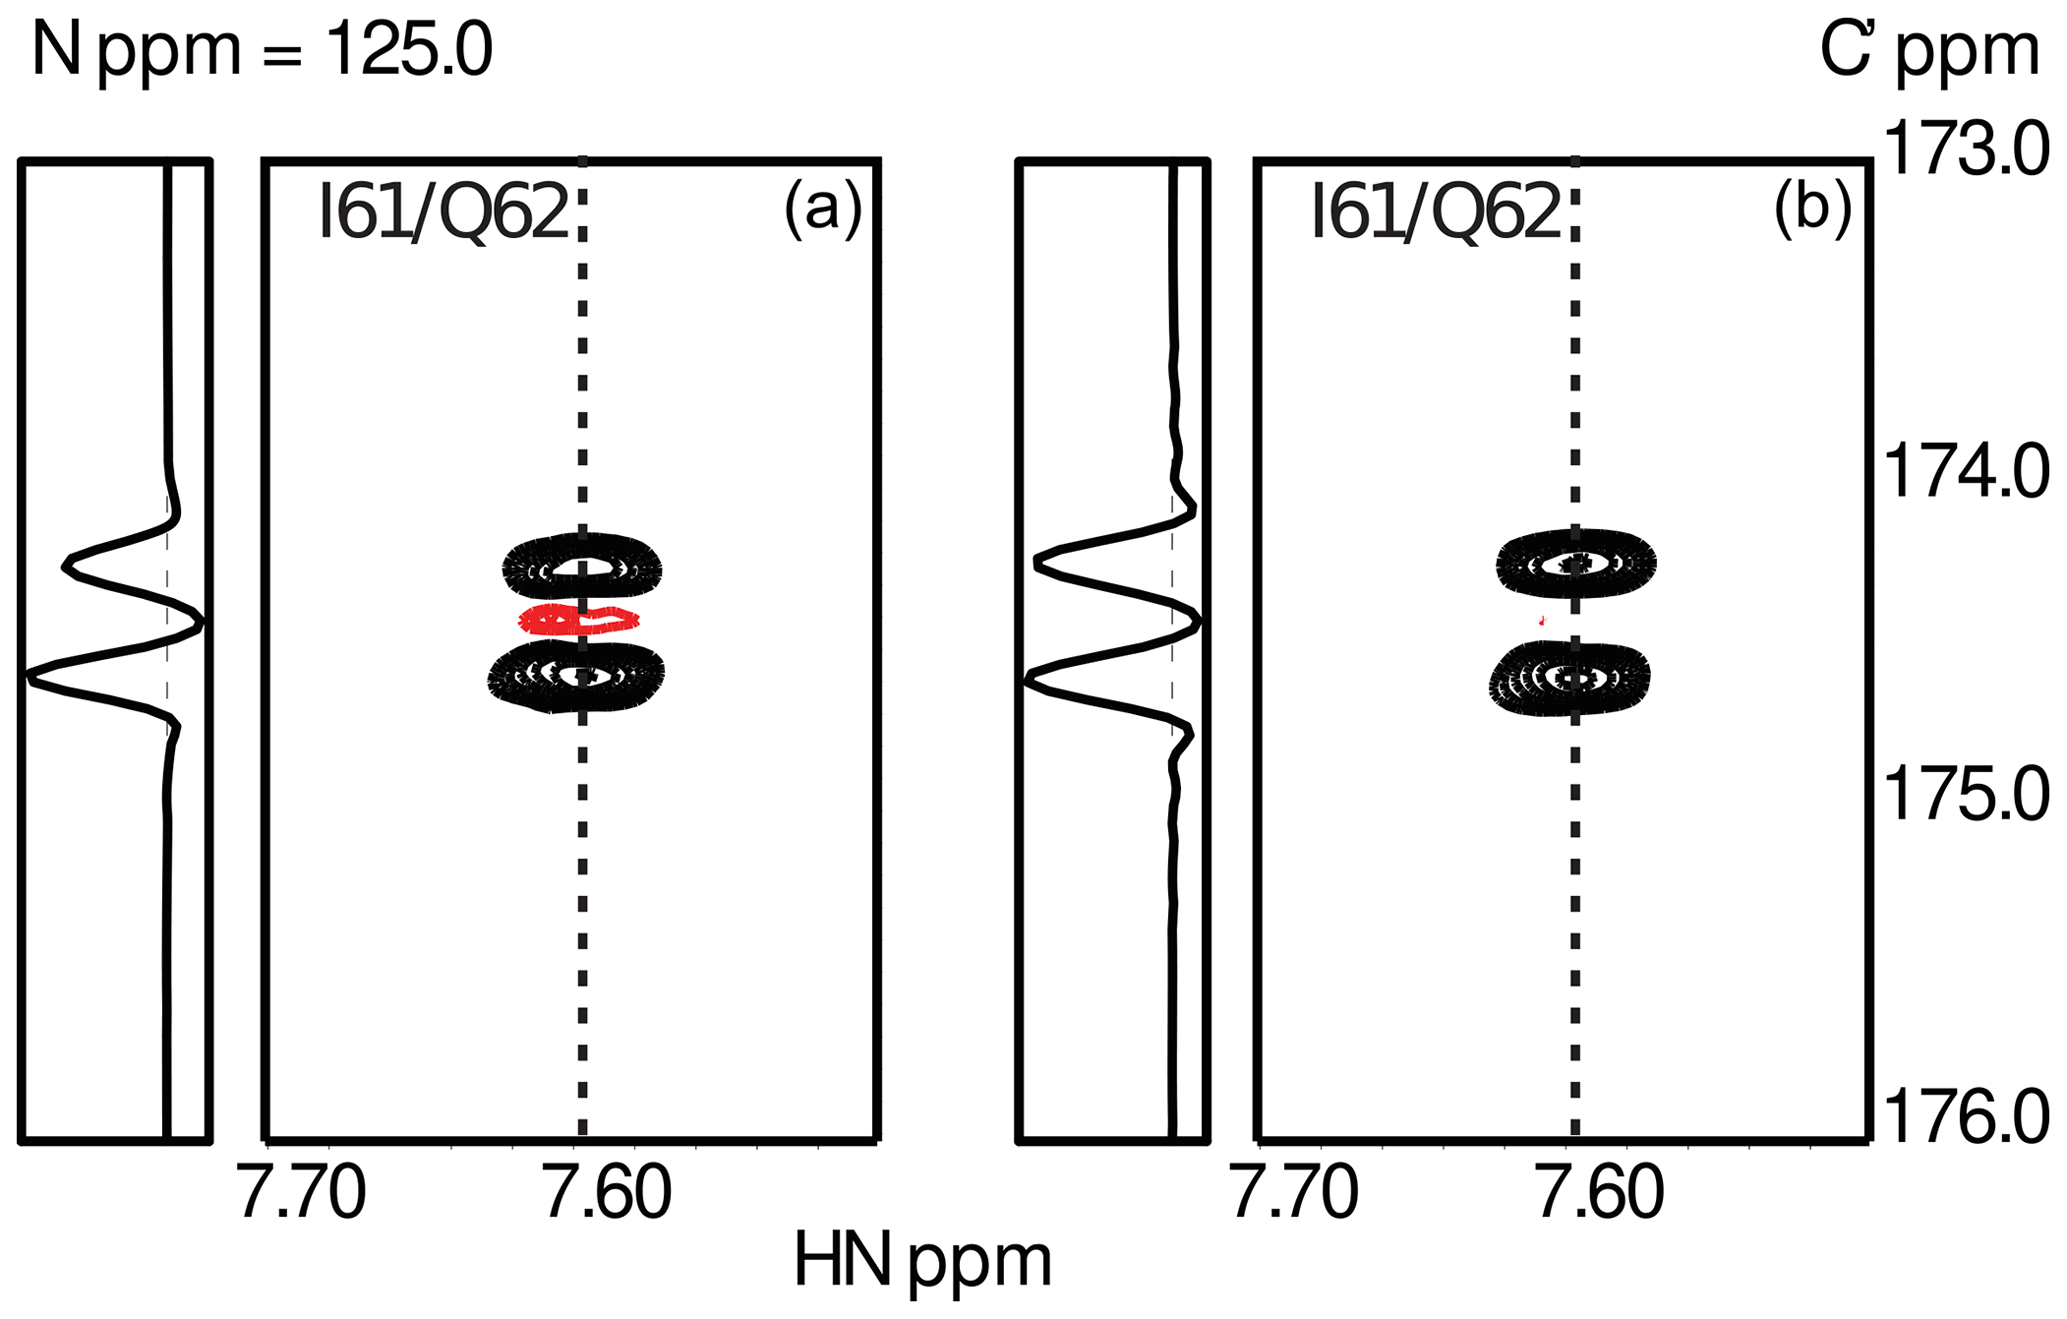
Figure 3Experimental results from the measurements of transverse (a) and longitudinal (b) CSA-DD CCR as described in Sect. 3. Data were obtained using ubiquitin, a small globular protein of 76 residues. The figure shows the spectral region for the peptide plane spanning residues I61/Q62. The asymmetry of the 13Cα doublet is visible in the cross-sections taken at the positions indicated by dashed lines. As expected, CCR effects are more pronounced in the case of transverse relaxation.
To suppress cross-relaxation, a 13C′ is inverted in the middle of the relaxation delay T. Additional unwanted CCR pathways involving the 13C′ CSA and dipoles are suppressed by 1H decoupling and 15N inversion. As the 2J couplings to remote carbons ( and ) are not resolved, CCR effects can be expected to average out for short and intermediate mixing times. While up to 20 % in size of the CCR, the CCR components contribute to the same line. The CCR rates are obtained from the doublet as . Details of the pulse sequence and NMR parameters will be given elsewhere. Two exemplary doublets measured for I61/Q62 in human ubiquitin are shown in Fig. 3.
With the general feasibility of the measurements demonstrated, we can now define a ratio Q analogous to Sect. 2, Eq. (9):
To assess the sensitivity of Q (Eq. 16), it is evaluated according to Eqs. (7), (8), (11), (12)–(15) with under the following conditions: as specified in Fig. 2, all CSA tensors have fixed orientation and size. Following Mantsyzov et al. (2014), the main axis, z, of the axially symmetric diffusion tensor is assumed to lie in the peptide plane; hence, Q is a function of the polar angles θ only; see Eq. (7). Defining the CαC′ orientation as 0∘ reference, the main axis is rotated from 0 to 180∘ towards the NHN vector assuming anisotropy values of 1.5 and 2.5, effective tumbling times of 1 and 2.5 ns, internal correlation times τint of 100 and 500 ps and order parameters S2 between 0 an 1. The magnetic field strength B0 is the same for all rates and thus cancels out. The results are summarized in Fig. 4.
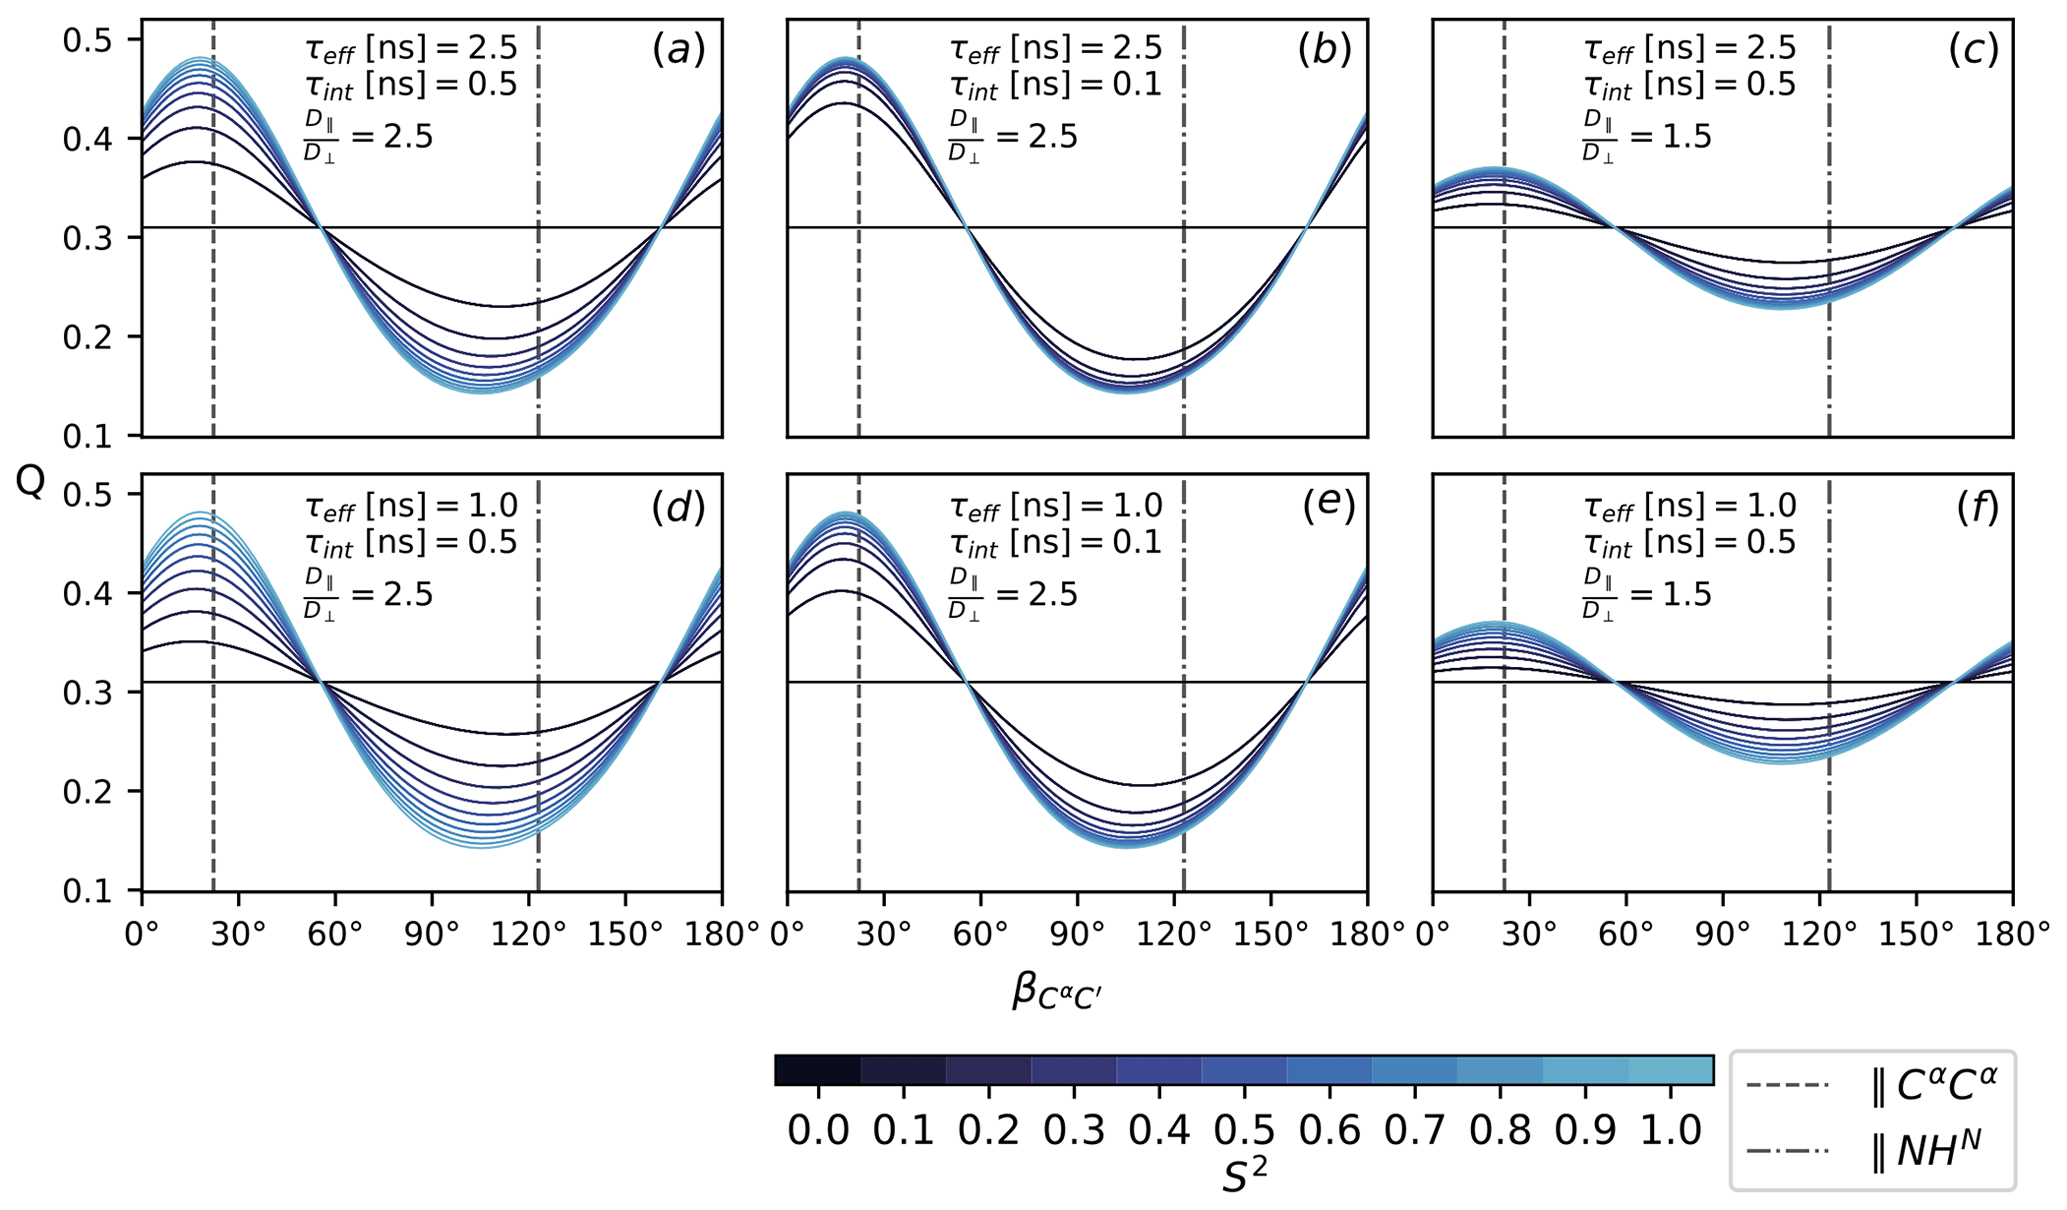
Figure 4The ratio Q, Eq. (16), as a function of the diffusion tensor orientation denoted by , Fig. 2. Dashed lines indicate the orientation of the NHN and the CαCα vector. All rates are calculated according to Eqs. (7), (8), (11), (12)–(15) with . Order parameters from 0 and 1 are color-coded. Panels (a–f) show Q for different choices of τeff, τint and . The magnetic field strength, B0, is the same for all rates.
Experimental considerations necessarily result in compromises. The fully anisotropic 13C′ CSA not only leads to spectral density contributions of two perpendicular components, it is also subject to considerable variations (Markwick et al., 2005; Cisnetti et al., 2004; Loth et al., 2005). One might be tempted to avoid the uncertainties and complications that come with the 13C′ CSA by considering dipolar relaxation only. However, compared to the NHN spin pair, the small gyromagnetic ratios and long internuclear distances of other dipoles lead to far smaller and less sensitive rates (Carlomagno et al., 2000). In addition, the J(0) components are generally neither dominant nor easily separated. The 13C′ CSA both provides effective means of relaxation and allows for a straightforward extraction of J(0) components. With an approximate ratio and the beneficial orientation of the C′Cα vector, the contribution is generally far more pronounced: for , the TCF amplitudes would be and based on the geometry of Fig. 2.
Figure 4 shows the ratio Q (Eq. 16) for different choices of τeff, τint, S2 and as a function of the diffusion tensor orientation. The main axis is assumed to lie in the peptide plane with the orientation denoted relative to C′Cα in terms of the angle ; see Fig. 2. Comparing all panels (a)–(f) at once, it can be seen that the isotropic (S2=0) baseline at around 0.3 is independent of the specific correlation times τeff and τint; see Eq. (10). The same value is obtained for , which is easily assessed from the convergence behavior for different anisotropy values in (c) and (f) and (a), (b), (d) and (e). How strongly Q reports on the asserted presence of diffusion anisotropy depends on the S2-mediated weight difference between the orientation-dependent Akτk (7) and the isotropic τeff. Both higher overall tumbling τeff and smaller isotropic motions τint yield a more sensitive Q for increasingly smaller order parameters S2; see panels (a), (b), (d) and (e). Of course, this interpolation is only approximate and can become more intricate if the local motions are considered in more detail. In this simplified case, the particular choice of τint and S2 is to some extent arbitrary as Akτk, τint and S2 merely weight the isotropic and anisotropic contributions to the TCF's enclosed area J(0). Still, the range was chosen based on timescales recently reported for MD simulations of IDPs (Kämpf et al., 2018).
Besides the obvious influence of itself, Q strongly depends on the orientation of the diffusion tensor. The orientations of the NHN and the CαCα vectors are highlighted in all panels (a)–(f). In an extended chain, CαCα is approximately parallel to the main axis, while NHN stands perpendicular to it or vice versa for an α-helix. Both orientations correspond well to the minimum and maximum of Q. The range of Q depends on the size of the anisotropy . For a value of 2.5, as was previously asserted for α-synuclein (Mantsyzov et al., 2014, 2015), the effect on Q can be quite substantial (panels a, b, d, e). For , it is far less pronounced (panels c and f).
We conclude that, if the concept of anisotropic tumbling of segmental α-helices and extended chains is reasonably applicable and sufficiently pronounced, Q would allow us to detect its signature. Actual quantification of is of course obstructed by the limited validity of the asserted dynamic model. While the presence of relaxation-active tumbling motions does imply a certain degree of local rigidity, the structural heterogeneity of IDPs certainly challenges many of the simplifying assumptions made. Still, the ratio Q might give an indication of how relevant these concepts are for different protein systems, e.g., a partially folded region (Salvi et al., 2017; Marcellini et al., 2020) or a highly disordered segment (Mantsyzov et al., 2014). While particularly sensitive to large correlation times, Q will report on all sources of anisotropy present in J(0). Differences in local mobility, CSA tensor variations, overall structural flexibility and experimental uncertainties will certainly shift and blur the ratio expected for isotropic motions. Still, if we assume a set of consecutive residues to experience shared anisotropic diffusion, the sizes of J(0) should reflect the presence of slower tumbling motions, and Q should exhibit a systematic and sequence-persistent pattern. If Q adheres closely to the isotropic expectation (Eq. 10), it would appear that peptide plane dynamics in IDPs are isotropic and well probed by conventional 15N relaxation alone. If Q and the sizes of J(0) imply systematic and correlated deviations from the isotropic case (Eq. 10), it would hint towards different inherent mobilities in the peptide plane such as the 3D GAF-type (Bremi and Brüschweiler, 1997) dynamics predicted by Salvi et al. (2017). Indeed, the sensitivity of Q along the CαCα direction illustrates the potential of CCR in investigating this type of motion.
Thus, while introduced and assessed in terms of diffusion anisotropy, we expect the combination of transversal and longitudinal CCR rates to prove informative even outside this limited scope. For the locally dominated dynamics of IDPs in particular, differences and similarities to the NHN spectral density can provide valuable structural insights even without invoking specific dynamic models. As the previously highlighted studies demonstrate, MD simulations can be expected to play a key role in rationalizing possible sources of anisotropy for different protein systems ranging from “fully disordered” (Mantsyzov et al., 2014) to partially structured (Salvi et al., 2017; Marcellini et al., 2020). In addition, the spectral densities can also be evaluated directly. While the proposed experiments do not allow us to map and individually, the contributions of different Larmor frequencies are fully separated. Graphical representations in particular can provide model-independent intuition about the timescales at play (Idiyatullin et al., 2001; Křížová et al., 2004; Kadeřávek et al., 2014). Expressions such as J(0)−J(ω) (Idiyatullin et al., 2001), intended to suppress the contribution of faster timescales (cf. Fig. 1), are available as well. More extensive analysis could be realized using general frameworks such as correlation time distributions (Khan et al., 2015; Hsu et al., 2018) or dynamic detectors (Smith et al., 2017, 2019).
On the occasion of Geoffrey Bodenhausen's 70th anniversary, we built on his extensive body of work to conceptualize experimental means for the investigation of anisotropic segmental dynamics in IDPs. Spectral density mapping protocols based on transversal and longitudinal CCR of NHN were translated to the CαC′ spin pair of the same peptide plane. By isolating and comparing the zero frequency contributions, we derived an intuitive experimental measure for the presence of anisotropic dynamics in IDPs. Building on the simplified image of a symmetric top, we show that pronounced anisotropic tumbling of extended chain and α-helical segments should be readily detectable. But even outside the context of this simplistic model, contributions of different frequencies can be separated and assessed similarly to spectral density mapping protocols. Interestingly, the required measurement of longitudinal CCR has not been investigated before. Hence, a simple proof of concept for a possible measurement scheme was provided. To further substantiate and explore the presented concepts in an experimental setting, a systematic evaluation of different pulse sequences is currently under preparation in our lab.
While detecting and quantifying the presence of anisotropy in IDP dynamics might seem like a humble academic endeavor, we believe it to be an important step not only towards a better understanding of this important protein family but also towards immediate applications in biological and biomedical research as well as drug design. We thus take particular delight from the fact that Geoffrey Bodenhausen's l'art pour l'art pulse sequence design is also a telling testimony for the unforeseeable impact of non-utilitarian basic research driven by and inspired by scholarly thinking.
Following Ghose et al. (1998, Eq. 3, p. 488), the spectral density of an anisotropically tumbling dynamic molecule can be approximated as
Following the notation of Vögeli and Yao (2009), the order parameter is defined as
i.e., as the value Ak decays to fast local motions. As noted by Vögeli and Yao (2009), Eq. (A1) can be written in the form of an auto-correlated TCF by setting Ak as a prefactor:
The order parameters are then defined as ratios:
While these generalized order parameters do not adhere to the definitions of Lipari and Szabo (Lipari and Szabo, 1982), they still equate to 1 in the case of a fully rigid molecule. It can be seen from Eq. (A3) that the inclusion of local motions requires one order parameter for each Ak in order to balance the isotropic and anisotropic contributions. The simplified spectral density proposed in the main text, Eq. (11), corresponds to the approximation that all Ak decay about the same relative amount (as in the edge case of isotropic tumbling). Without the index k for the order parameter, , Eq. (A3) simplifies to Eq. (11):
Equation (A5) is similar to the approximation proposed by Ghose et al. (1998, Eq. 7, p. 488) but includes the prefactor P2(u⋅v) for the internal TCF, preserving the isotropic limit (, ) as
In this case, S2 again corresponds to the familiar auto-correlated order parameter of Lipari and Szabo (1982), the auto- and cross-correlated TCF are related by the simple factor P2(u⋅v). For sufficiently small angles between u and v, this relation can be extended to approximate anisotropic tumbling in accordance with the MF rationale of Lipari and Szabo (Tjandra et al., 1996; Kroenke et al., 1998). As noted by Halle (2009) in his foundational study on the MF formalism, this approach can also be contextualized within the MF framework of Halle and Wennerström (1981).
The preliminary NMR data shown for ubiquitin (Fig. 3) are available from the authors upon request.
The supplement related to this article is available online at: https://doi.org/10.5194/mr-2-557-2021-supplement.
RK, CK and IC devised the project. CK compiled the theoretical considerations. IC and CK performed the numerical simulations. GK and RK assessed the experimental feasibility. GK designed the pulse sequence. IC and CK illustrated the results. CK wrote the article with contributions from all authors.
The authors declare that they have no conflict of interest.
Publisher’s note: Copernicus Publications remains neutral with regard to jurisdictional claims in published maps and institutional affiliations.
This article is part of the special issue “Geoffrey Bodenhausen Festschrift”. It is not associated with a conference.
The authors acknowledge the support from the Austrian Science Fund (FWF).
This research has been supported by the Austrian Science Fund (FWF; grant nos. P28359 and P28937).
This paper was edited by Daniel Abergel and reviewed by two anonymous referees.
Abergel, D. and Bodenhausen, G.: A simple model for NMR relaxation in the presence of internal motions with dynamical coupling, J. Chem. Phys., 121, 761–768, https://doi.org/10.1063/1.1756867, 2004. a
Abergel, D. and Bodenhausen, G.: Predicting internal protein dynamics from structures using coupled networks of hindered rotators, J. Chem. Phys., 123, https://doi.org/10.1063/1.2110028, 2005. a
Barnes, C. A., Shen, Y., Ying, J., Takagi, Y., Torchia, D. A., Sellers, J. R., and Bax, A.: Remarkable Rigidity of the Single α-Helical Domain of Myosin-VI As Revealed by NMR Spectroscopy, J. Am. Chem. Soc., 141, 9004–9017, https://doi.org/10.1021/jacs.9b03116, 2019. a
Bremi, T. and Brüschweiler, R.: Locally Anisotropic Internal Polypeptide Backbone Dynamics by NMR Relaxation, J. Am. Chem. Soc., 119, 6672–6673, https://doi.org/10.1021/ja9708676, 1997. a, b
Bussell, R. and Eliezer, D.: Residual Structure and Dynamics in Parkinson's Disease-associated Mutants of α-Synuclein*, J. Biol. Chem., 276, 45996–46003, https://doi.org/10.1074/jbc.M106777200, 2001. a
Carlomagno, T., Maurer, M., Hennig, M., and Griesinger, C.: Ubiquitin Backbone Motion Studied via Dipolar-Dipolar and CSA-Dipolar Cross-Correlated Relaxation, J. Am. Chem. Soc., 122, 5105–5113, https://doi.org/10.1021/ja993845n, 2000. a
Chang, S.-L. and Tjandra, N.: Temperature dependence of protein backbone motion from carbonyl 13C and amide 15N NMR relaxation, J. Magn. Reson., 174, 43–53, https://doi.org/10.1016/j.jmr.2005.01.008, 2005. a
Cisnetti, F., Loth, K., Pelupessy, P., and Bodenhausen, G.: Determination of Chemical Shift Anisotropy Tensors of Carbonyl Nuclei in Proteins through Cross-Correlated Relaxation in NMR, ChemPhysChem, 5, 807–814, https://doi.org/10.1002/cphc.200301041, 2004. a, b, c, d, e
Clore, G. M. and Iwahara, J.: Theory, Practice, and Applications of Paramagnetic Relaxation Enhancement for the Characterization of Transient Low-Population States of Biological Macromolecules and Their Complexes, Chem. Rev., 109, 4108–4139, https://doi.org/10.1021/cr900033p, 2009. a
Clore, G. M., Szabo, A., Bax, A., Kay, L. E., Driscoll, P. C., and Gronenborn, A. M.: Deviations from the simple two-parameter model-free approach to the interpretation of nitrogen-15 nuclear magnetic relaxation of proteins, J. Am. Chem. Soc., 112, 4989–4991, https://doi.org/10.1021/ja00168a070, 1990. a, b, c
Corey, R. B., Pauling, L. C., and Astbury, W. T.: Fundamental dimensions of polypeptide chains, P. Roy. Soc. Lond. B Bio., 141, 10–20, https://doi.org/10.1098/rspb.1953.0011, 1953. a, b
Cornilescu, G., Marquardt, J. L., Ottiger, M., and Bax, A.: Validation of Protein Structure from Anisotropic Carbonyl Chemical Shifts in a Dilute Liquid Crystalline Phase, J. Am. Chem. Soc., 120, 6836–6837, https://doi.org/10.1021/ja9812610, 1998. a
Daragan, V. A. and Mayo, K. H.: Using the Model Free Approach to Analyze NMR Relaxation Data in Cases of Anisotropic Molecular Diffusion, J. Phys. Chem. B, 103, 6829–6834, https://doi.org/10.1021/jp9911393, 1999. a
Dayie, K. T. and Wagner, G.: Carbonyl Carbon Probe of Local Mobility in 13C,15N-Enriched Proteins Using High-Resolution Nuclear Magnetic Resonance, J. Am. Chem. Soc., 119, 7797–7806, https://doi.org/10.1021/ja9633880, 1997. a
Deschamps, M.: Cross-Correlated Relaxation with Anisotropic Reorientation and Small Amplitude Local Motions, J. Phys. Chem. A, 106, 2438–2445, https://doi.org/10.1021/jp013407e, 2002. a
Deschamps, M. and Bodenhausen, G.: Anisotropy of Rotational Diffusion, Dipole–Dipole Cross-Correlated NMR Relaxation and Angles between Bond Vectors in Proteins, ChemPhysChem, 2, 539–543, https://doi.org/10.1002/1439-7641(20010917)2:8/9<539::AID-CPHC539>3.0.CO;2-M, 2001. a
Eastman, P., Swails, J., Chodera, J. D., McGibbon, R. T., Zhao, Y., Beauchamp, K. A., Wang, L.-P., Simmonett, A. C., Harrigan, M. P., Stern, C. D., Wiewiora, R. P., Brooks, B. R., and Pande, V. S.: OpenMM 7: Rapid development of high performance algorithms for molecular dynamics, PLOS Comput. Biol., 13, 1–17, https://doi.org/10.1371/journal.pcbi.1005659, 2017. a
Ferrage, F., Pelupessy, P., Cowburn, D., and Bodenhausen, G.: Protein Backbone Dynamics through Cross-Relaxation in NMR Spectroscopy, J. Am. Chem. Soc., 128, 11072–11078, https://doi.org/10.1021/ja0600577, 2006. a
Ghose, R., Huang, K., and Prestegard, J. H.: Measurement of Cross Correlation between Dipolar Coupling and Chemical Shift Anisotropy in the Spin Relaxation of 13C, 15N-Labeled Proteins, J. Magn. Reson., 135, 487–499, https://doi.org/10.1006/jmre.1998.1602, 1998. a, b, c
Gopal, S. M., Wingbermühle, S., Schnatwinkel, J., Juber, S., Herrmann, C., and Schäfer, L. V.: Conformational Preferences of an Intrinsically Disordered Protein Domain: A Case Study for Modern Force Fields, J. Phys. Chem. B, 125, 24–35, https://doi.org/10.1021/acs.jpcb.0c08702, 2021. a
Grudzia̧ż, K., Zawadzka-Kazimierczuk, A., and Koźmiński, W.: High-dimensional NMR methods for intrinsically disordered proteins studies, nMR Methods of Characterizing Biomolecular Structural Dynamics and Conformational Ensembles, Methods, 148, 81–87, https://doi.org/10.1016/j.ymeth.2018.04.031, 2018. a
Halle, B.: The physical basis of model-free analysis of NMR relaxation data from proteins and complex fluids, J. Chem. Phys., 131, 1–224507, https://doi.org/10.1063/1.3269991, 2009. a, b, c
Halle, B. and Wennerström, H.: Interpretation of magnetic resonance data from water nuclei in heterogeneous systems, J. Chem. Phys., 75, 1928–1943, https://doi.org/10.1063/1.442218, 1981. a, b
Hsu, A., Ferrage, F., and Palmer, A. G.: Analysis of NMR Spin-Relaxation Data Using an Inverse Gaussian Distribution Function, Biophys. J., 115, 2301–2309, https://doi.org/10.1016/j.bpj.2018.10.030, 2018. a, b
Idiyatullin, D., Daragan, V. A., and Mayo, K. H.: A New Approach to Visualizing Spectral Density Functions and Deriving Motional Correlation Time Distributions: Applications to an α-Helix-Forming Peptide and to a Well-Folded Protein, J. Magn. Reson., 152, 132–148, https://doi.org/10.1006/jmre.2001.2372, 2001. a, b, c, d
Iwahara, J., Schwieters, C. D., and Clore, G. M.: Ensemble Approach for NMR Structure Refinement against 1H Paramagnetic Relaxation Enhancement Data Arising from a Flexible Paramagnetic Group Attached to a Macromolecule, J. Am. Chem. Soc., 126, 5879–5896, https://doi.org/10.1021/ja031580d, 2004. a
Kadeřávek, P., Zapletal, V., Rabatinová, A., Krásný, L., Sklenář, V., and Žídek, L.: Spectral density mapping protocols for analysis of molecular motions in disordered proteins, J. Biomol. NMR, 58, 193–207, https://doi.org/10.1007/s10858-014-9816-4, 2014. a, b, c, d
Kadeřávek, P., Grutsch, S., Salvi, N., Tollinger, M., Žídek, L., Bodenhausen, G., and Ferrage, F.: Cross-correlated relaxation measurements under adiabatic sweeps: determination of local order in proteins, J. Biomol. NMR, 63, 353–365, https://doi.org/10.1007/s10858-015-9994-8, 2015. a, b
Kämpf, K., Izmailov, S. A., Rabdano, S. O., Groves, A. T., Podkorytov, I. S., and Skrynnikov, N. R.: What Drives 15N Spin Relaxation in Disordered Proteins? Combined NMR/MD Study of the H4 Histone Tail, Biophys. J., 115, 2348–2367, https://doi.org/10.1016/j.bpj.2018.11.017, 2018. a, b, c
Kauffmann, C., Zawadzka-Kazimierczuk, A., Kontaxis, G., and Konrat, R.: Using Cross-Correlated Spin Relaxation to Characterize Backbone Dihedral Angle Distributions of Flexible Protein Segments, ChemPhysChem, 22, 18–28, https://doi.org/10.1002/cphc.202000789, 2021. a
Khan, S., Charlier, C., Augustyniak, R., Salvi, N., Déjean, V., Bodenhausen, G., Lequin, O., Pelupessy, P., and Ferrage, F.: Distribution of Pico- and Nanosecond Motions in Disordered Proteins from Nuclear Spin Relaxation, Biophys. J., 109, 988–999, https://doi.org/10.1016/j.bpj.2015.06.069, 2015. a, b, c
Křížová, H., Žídek, L., Stone, M. J., Novotny, M. V., and Sklenář, V.: Temperature-dependent spectral density analysis applied to monitoring backbone dynamics of major urinary protein-I complexed with the pheromone 2-sec-butyl-4,5-dihydrothiazole*, J. Biomol. NMR, 28, 369–384, https://doi.org/10.1023/B:JNMR.0000015404.61574.65, 2004. a
Kroenke, C. D., Loria, J. P., Lee, L. K., Rance, M., and Palmer, A. G.: Longitudinal and Transverse 1H−15N Dipolar/15N Chemical Shift Anisotropy Relaxation Interference: Unambiguous Determination of Rotational Diffusion Tensors and Chemical Exchange Effects in Biological Macromolecules, J. Am. Chem. Soc., 120, 7905–7915, https://doi.org/10.1021/ja980832l, 1998. a, b, c
Kümmerer, F., Orioli, S., Harding-Larsen, D., Hoffmann, F., Gavrilov, Y., Teilum, K., and Lindorff-Larsen, K.: Fitting side-chain NMR relaxation data using molecular simulations, bioRxiv, https://doi.org/10.1101/2020.08.18.256024, 2020. a
Lienin, S. F., Bremi, T., Brutscher, B., Brüschweiler, R., and Ernst, R. R.: Anisotropic Intramolecular Backbone Dynamics of Ubiquitin Characterized by NMR Relaxation and MD Computer Simulation, J. Am. Chem. Soc., 120, 9870–9879, https://doi.org/10.1021/ja9810179, 1998. a
Lipari, G. and Szabo, A.: Model-free approach to the interpretation of nuclear magnetic resonance relaxation in macromolecules. 1. Theory and range of validity, J. Am. Chem. Soc., 104, 4546–4559, https://doi.org/10.1021/ja00381a009, 1982. a, b, c, d, e, f
Loth, K., Pelupessy, P., and Bodenhausen, G.: Chemical Shift Anisotropy Tensors of Carbonyl, Nitrogen, and Amide Proton Nuclei in Proteins through Cross-Correlated Relaxation in NMR Spectroscopy, J. Am. Chem. Soc., 127, 6062–6068, https://doi.org/10.1021/ja042863o, 2005. a, b, c
Mantsyzov, A. B., Maltsev, A. S., Ying, J., Shen, Y., Hummer, G., and Bax, A.: A maximum entropy approach to the study of residue-specific backbone angle distributions in α-synuclein, an intrinsically disordered protein, Protein Sci., 23, 1275–1290, https://doi.org/10.1002/pro.2511, 2014. a, b, c, d, e, f, g
Mantsyzov, A. B., Shen, Y., Lee, J. H., Hummer, G., and Bax, A.: MERA: a webserver for evaluating backbone torsion angle distributions in dynamic and disordered proteins from NMR data, J. Biomol. NMR, 63, 85–95, https://doi.org/10.1007/s10858-015-9971-2, 2015. a, b
Marcellini, M., Nguyen, M.-H., Martin, M., Hologne, M., and Walker, O.: Accurate Prediction of Protein NMR Spin Relaxation by Means of Polarizable Force Fields. Application to Strongly Anisotropic Rotational Diffusion, J. Phys. Chem. B, 124, 5103–5112, https://doi.org/10.1021/acs.jpcb.0c01922, 2020. a, b, c, d
Markwick, P. R. L., Sprangers, R., and Sattler, M.: Local Structure and Anisotropic Backbone Dynamics from Cross-Correlated NMR Relaxation in Proteins, Angew. Chem. Int. Edit., 44, 3232–3237, https://doi.org/10.1002/anie.200462495, 2005. a
Meirovitch, E., Shapiro, Y. E., Polimeno, A., and Freed, J. H.: Protein Dynamics from NMR: The Slowly Relaxing Local Structure Analysis Compared with Model-Free Analysis, J. Phys. Chem. A, 110, 8366–8396, https://doi.org/10.1021/jp056975t, 2006. a
Modig, K. and Poulsen, F. M.: Model-independent interpretation of NMR relaxation data for unfolded proteins: the acid-denatured state of ACBP, J. Biomol. NMR, 42, 163–177, https://doi.org/10.1007/s10858-008-9280-0, 2008. a, b
Nodet, G., Abergel, D., and Bodenhausen, G.: Predicting NMR Relaxation Rates in Anisotropically Tumbling Proteins through Networks of Coupled Rotators, ChemPhysChem, 9, 625–633, https://doi.org/10.1002/cphc.200700732, 2008. a
Ottiger, M. and Bax, A.: Determination of Relative N−HN, , , and Cα−Hα Effective Bond Lengths in a Protein by NMR in a Dilute Liquid Crystalline Phase, J. Am. Chem. Soc., 120, 12334–12341, https://doi.org/10.1021/ja9826791, 1998. a
Pelupessy, P., Espallargas, G. M., and Bodenhausen, G.: Symmetrical reconversion: measuring cross-correlation rates with enhanced accuracy, J. Magn. Reson., 161, 258–264, https://doi.org/10.1016/S1090-7807(02)00190-8, 2003. a, b, c
Pelupessy, P., Ferrage, F., and Bodenhausen, G.: Accurate Measurement of Longitudinal Cross-Relaxation Rates in Nuclear Magnetic Resonance, J. Chem. Phys., 126, 134 508, 1–10, https://doi.org/10.1063/1.2715583, 2007. a, b, c
Piana, S., Donchev, A. G., Robustelli, P., and Shaw, D. E.: Water Dispersion Interactions Strongly Influence Simulated Structural Properties of Disordered Protein States, J. Phys. Chem. B, 119, 5113–5123, https://doi.org/10.1021/jp508971m, 2015. a
Piana, S., Robustelli, P., Tan, D., Chen, S., and Shaw, D. E.: Development of a Force Field for the Simulation of Single-Chain Proteins and Protein–Protein Complexes, J. Chem. Theory Comput., 16, 2494–2507, https://doi.org/10.1021/acs.jctc.9b00251, 2020. a
Rauscher, S., Gapsys, V., Gajda, M. J., Zweckstetter, M., de Groot, B. L., and Grubmüller, H.: Structural Ensembles of Intrinsically Disordered Proteins Depend Strongly on Force Field: A Comparison to Experiment, J. Chem. Theory Comput., 11, 5513–5524, https://doi.org/10.1021/acs.jctc.5b00736, 2015. a
Richert, R. and Blumen, A. (Eds.): Disorder Effects on Relaxational Processes, Springer, Berlin Heidelberg, https://doi.org/10.1007/978-3-642-78576-4_1, 1994. a
Robustelli, P., Piana, S., and Shaw, D. E.: Developing a molecular dynamics force field for both folded and disordered protein states, P. Natl. Acad. Sci. USA, 115, E4758–E4766, https://doi.org/10.1073/pnas.1800690115, 2018. a
Salomon-Ferrer, R., Götz, A. W., Poole, D., Le Grand, S., and Walker, R. C.: Routine Microsecond Molecular Dynamics Simulations with AMBER on GPUs. 2. Explicit Solvent Particle Mesh Ewald, J. Chem. Theory Comput., 9, 3878–3888, https://doi.org/10.1021/ct400314y, 2013. a
Salvi, N., Abyzov, A., and Blackledge, M.: Multi-Timescale Dynamics in Intrinsically Disordered Proteins from NMR Relaxation and Molecular Simulation, J. Phys. Chem. Lett., 7, 2483–2489, https://doi.org/10.1021/acs.jpclett.6b00885, 2016. a
Salvi, N., Abyzov, A., and Blackledge, M.: Analytical Description of NMR Relaxation Highlights Correlated Dynamics in Intrinsically Disordered Proteins, Angew. Chem. Int. Edit., 56, 14020–14024, https://doi.org/10.1002/anie.201706740, 2017. a, b, c, d, e, f
Schanda, P.: Relaxing with liquids and solids – A perspective on biomolecular dynamics, J. Magn. Reson., 306, 180–186, https://doi.org/10.1016/j.jmr.2019.07.025, 2019. a
Schwalbe, H., Carlomagno, T., Hennig, M., Junker, J., Reif, B., Richter, C., and Griesinger, C.: [2] - Cross-Correlated Relaxation for Measurement of Angles between Tensorial Interactions, in: Nuclear Magnetic Resonance of Biological Macromolecules Part A, edited by: James, T. L., Dötsch, V., and Schmitz, U., Academic Press, London and San Diego, Methods in Enzymology, 338, 35–81, https://doi.org/10.1016/S0076-6879(02)38215-6, 2002. a
Shea, J.-E., Best, R. B., and Mittal, J.: Physics-based computational and theoretical approaches to intrinsically disordered proteins, Curr. Opin. Struc. Biol., 67, 219–225, https://doi.org/10.1016/j.sbi.2020.12.012, 2021. a
Smith, A. A., Ernst, M., and Meier, B. H.: Because the Light is Better Here: Correlation-Time Analysis by NMR Spectroscopy, Angew. Chem. Int. Edit., 56, 13590–13595, https://doi.org/10.1002/anie.201707316, 2017. a, b
Smith, A. A., Ernst, M., Meier, B. H., and Ferrage, F.: Reducing bias in the analysis of solution-state NMR data with dynamics detectors, J. Chem. Phys., 151, 034102, https://doi.org/10.1063/1.5111081, 2019. a, b
Stone, J. E., Phillips, J. C., Freddolino, P. L., Hardy, D. J., Trabuco, L. G., and Schulten, K.: Accelerating molecular modeling applications with graphics processors, J. Comput. Chem., 28, 2618–2640, https://doi.org/10.1002/jcc.20829, 2007. a
Stone, J. E., Hardy, D. J., Ufimtsev, I. S., and Schulten, K.: GPU-accelerated molecular modeling coming of age, J. Mol. Graph. Model., 29, 116–125, https://doi.org/10.1016/j.jmgm.2010.06.010, 2010. a
Tjandra, N., Szabo, A., and Bax, A.: Protein Backbone Dynamics and 15N Chemical Shift Anisotropy from Quantitative Measurement of Relaxation Interference Effects, J. Am. Chem. Soc., 118, 6986–6991, https://doi.org/10.1021/ja960510m, 1996. a, b, c, d
Tugarinov, V., Liang, Z., Shapiro, Y. E., Freed, J. H., and Meirovitch, E.: A Structural Mode-Coupling Approach to 15N NMR Relaxation in Proteins, J. Am. Chem. Soc., 123, 3055–3063, https://doi.org/10.1021/ja003803v, 2001. a
Vögeli, B.: Comprehensive description of NMR cross-correlated relaxation under anisotropic molecular tumbling and correlated local dynamics on all time scales, J. Chem. Phys., 133, 014 501, https://doi.org/10.1063/1.3454734, 2010. a, b
Vögeli, B.: The nuclear Overhauser effect from a quantitative perspective, Prog. Nucl. Mag. Res. Sp., 78, 1–46, https://doi.org/10.1016/j.pnmrs.2013.11.001, 2014. a
Vögeli, B. and Yao, L.: Correlated Dynamics between Protein HN and HC Bonds Observed by NMR Cross Relaxation, J. Am. Chem. Soc., 131, 3668–3678, https://doi.org/10.1021/ja808616v, 2009. a, b, c, d
Vugmeyster, L., Pelupessy, P., Vugmeister, B. E., Abergel, D., and Bodenhausen, G.: Cross-correlated relaxation in NMR of macromolecules in the presence of fast and slow internal dynamics, highly polarized nuclear spin systems and dipolar interactions in NMR, C. R. Phys., 5, 377–386, https://doi.org/10.1016/j.crhy.2004.02.004, 2004. a
Wang, T., Weaver, D. S., Cai, S., and Zuiderweg, E. R. P.: Quantifying Lipari–Szabo modelfree parameters from 13CO NMR relaxation experiments, J. Biomol. NMR, 36, 79–102, https://doi.org/10.1007/s10858-006-9047-4, 2006. a, b
Woessner, D. E.: Spin Relaxation Processes in a Two-Proton System Undergoing Anisotropic Reorientation, J. Chem. Phys., 36, 1–4, https://doi.org/10.1063/1.1732274, 1962. a
Xue, Y., Podkorytov, I. S., Rao, D. K., Benjamin, N., Sun, H., and Skrynnikov, N. R.: Paramagnetic relaxation enhancements in unfolded proteins: Theory and application to drkN SH3 domain, Protein Sci., 18, 1401–1424, https://doi.org/10.1002/pro.153, 2009. a
Ying, J., Roche, J., and Bax, A.: Homonuclear decoupling for enhancing resolution and sensitivity in NOE and RDC measurements of peptides and proteins, a special “JMR Perspectives” issue: Foresights in Biomolecular Solution-State NMR Spectroscopy – From Spin Gymnastics to Structure and Dynamics, J. Magn. Reson., 241, 97–102, https://doi.org/10.1016/j.jmr.2013.11.006, 2014. a
Zerbetto, M., Buck, M., Meirovitch, E., and Polimeno, A.: Integrated Computational Approach to the Analysis of NMR Relaxation in Proteins: Application to ps-ns Main Chain 15N−1H and Global Dynamics of the Rho GTPase Binding Domain of Plexin-B1, J. Phys. Chem. B, 115, 376–388, https://doi.org/10.1021/jp108633v, 2011. a
Zerze, G. H., Zheng, W., Best, R. B., and Mittal, J.: Evolution of All-Atom Protein Force Fields to Improve Local and Global Properties, J. Phys. Chem. Lett., 10, 2227–2234, https://doi.org/10.1021/acs.jpclett.9b00850, 2019. a
structural memory. By translating diffusion models of folded proteins to segmental motions in IDPs, we define and assess a sensitive experimental measure for the presence of anisotropic dynamics in the protein backbone.