the Creative Commons Attribution 4.0 License.
the Creative Commons Attribution 4.0 License.
 | 14 Sep 2021
Rapid assessment of Watson–Crick to Hoogsteen exchange in unlabeled DNA duplexes using high-power SELOPE imino 1H CEST
Atul Rangadurai
Honglue Shi
Hashim M. Al-Hashimi
In duplex DNA, Watson–Crick A–T and G–C base pairs (bp's) exist in dynamic equilibrium with an alternative Hoogsteen conformation, which is low in abundance and short-lived. Measuring how the Hoogsteen dynamics varies across different DNA sequences, structural contexts and physiological conditions is key for identifying potential Hoogsteen hot spots and for understanding the potential roles of Hoogsteen base pairs in DNA recognition and repair. However, such studies are hampered by the need to prepare 13C or 15N isotopically enriched DNA samples for NMR relaxation dispersion (RD) experiments. Here, using SELective Optimized Proton Experiments (SELOPE) 1H CEST experiments employing high-power radiofrequency fields (B1 > 250 Hz) targeting imino protons, we demonstrate accurate and robust characterization of Watson–Crick to Hoogsteen exchange, without the need for isotopic enrichment of the DNA. For 13 residues in three DNA duplexes under different temperature and pH conditions, the exchange parameters deduced from high-power imino 1H CEST were in very good agreement with counterparts measured using off-resonance 13C 15N spin relaxation in the rotating frame (R1ρ). It is shown that 1H–1H NOE effects which typically introduce artifacts in 1H-based measurements of chemical exchange can be effectively suppressed by selective excitation, provided that the relaxation delay is short (≤ 100 ms). The 1H CEST experiment can be performed with ∼ 10× higher throughput and ∼ 100× lower cost relative to 13C 15N R1ρ and enabled Hoogsteen chemical exchange measurements undetectable by R1ρ. The results reveal an increased propensity to form Hoogsteen bp's near terminal ends and a diminished propensity within A-tract motifs. The 1H CEST experiment provides a basis for rapidly screening Hoogsteen breathing in duplex DNA, enabling identification of unusual motifs for more in-depth characterization.
- Article
(3698 KB) - Full-text XML
-
Supplement
(21997 KB) - BibTeX
- EndNote


Soon after the discovery of the DNA double helix, it was shown that A–T and G–C could also pair in an alternative conformation known as the “Hoogsteen” base pair (bp) (Felsenfeld et al., 1957; Hoogsteen, 1959) (Fig. 1a). Starting from a canonical Watson–Crick G–C or A–T bp, the corresponding Hoogsteen bp's can be obtained by flipping the purine base 180∘ and bringing the two bases into proximity to create a new set of hydrogen bonds, which in the case of G–C bp's require protonation of cytosine N3 (Fig. 1a).
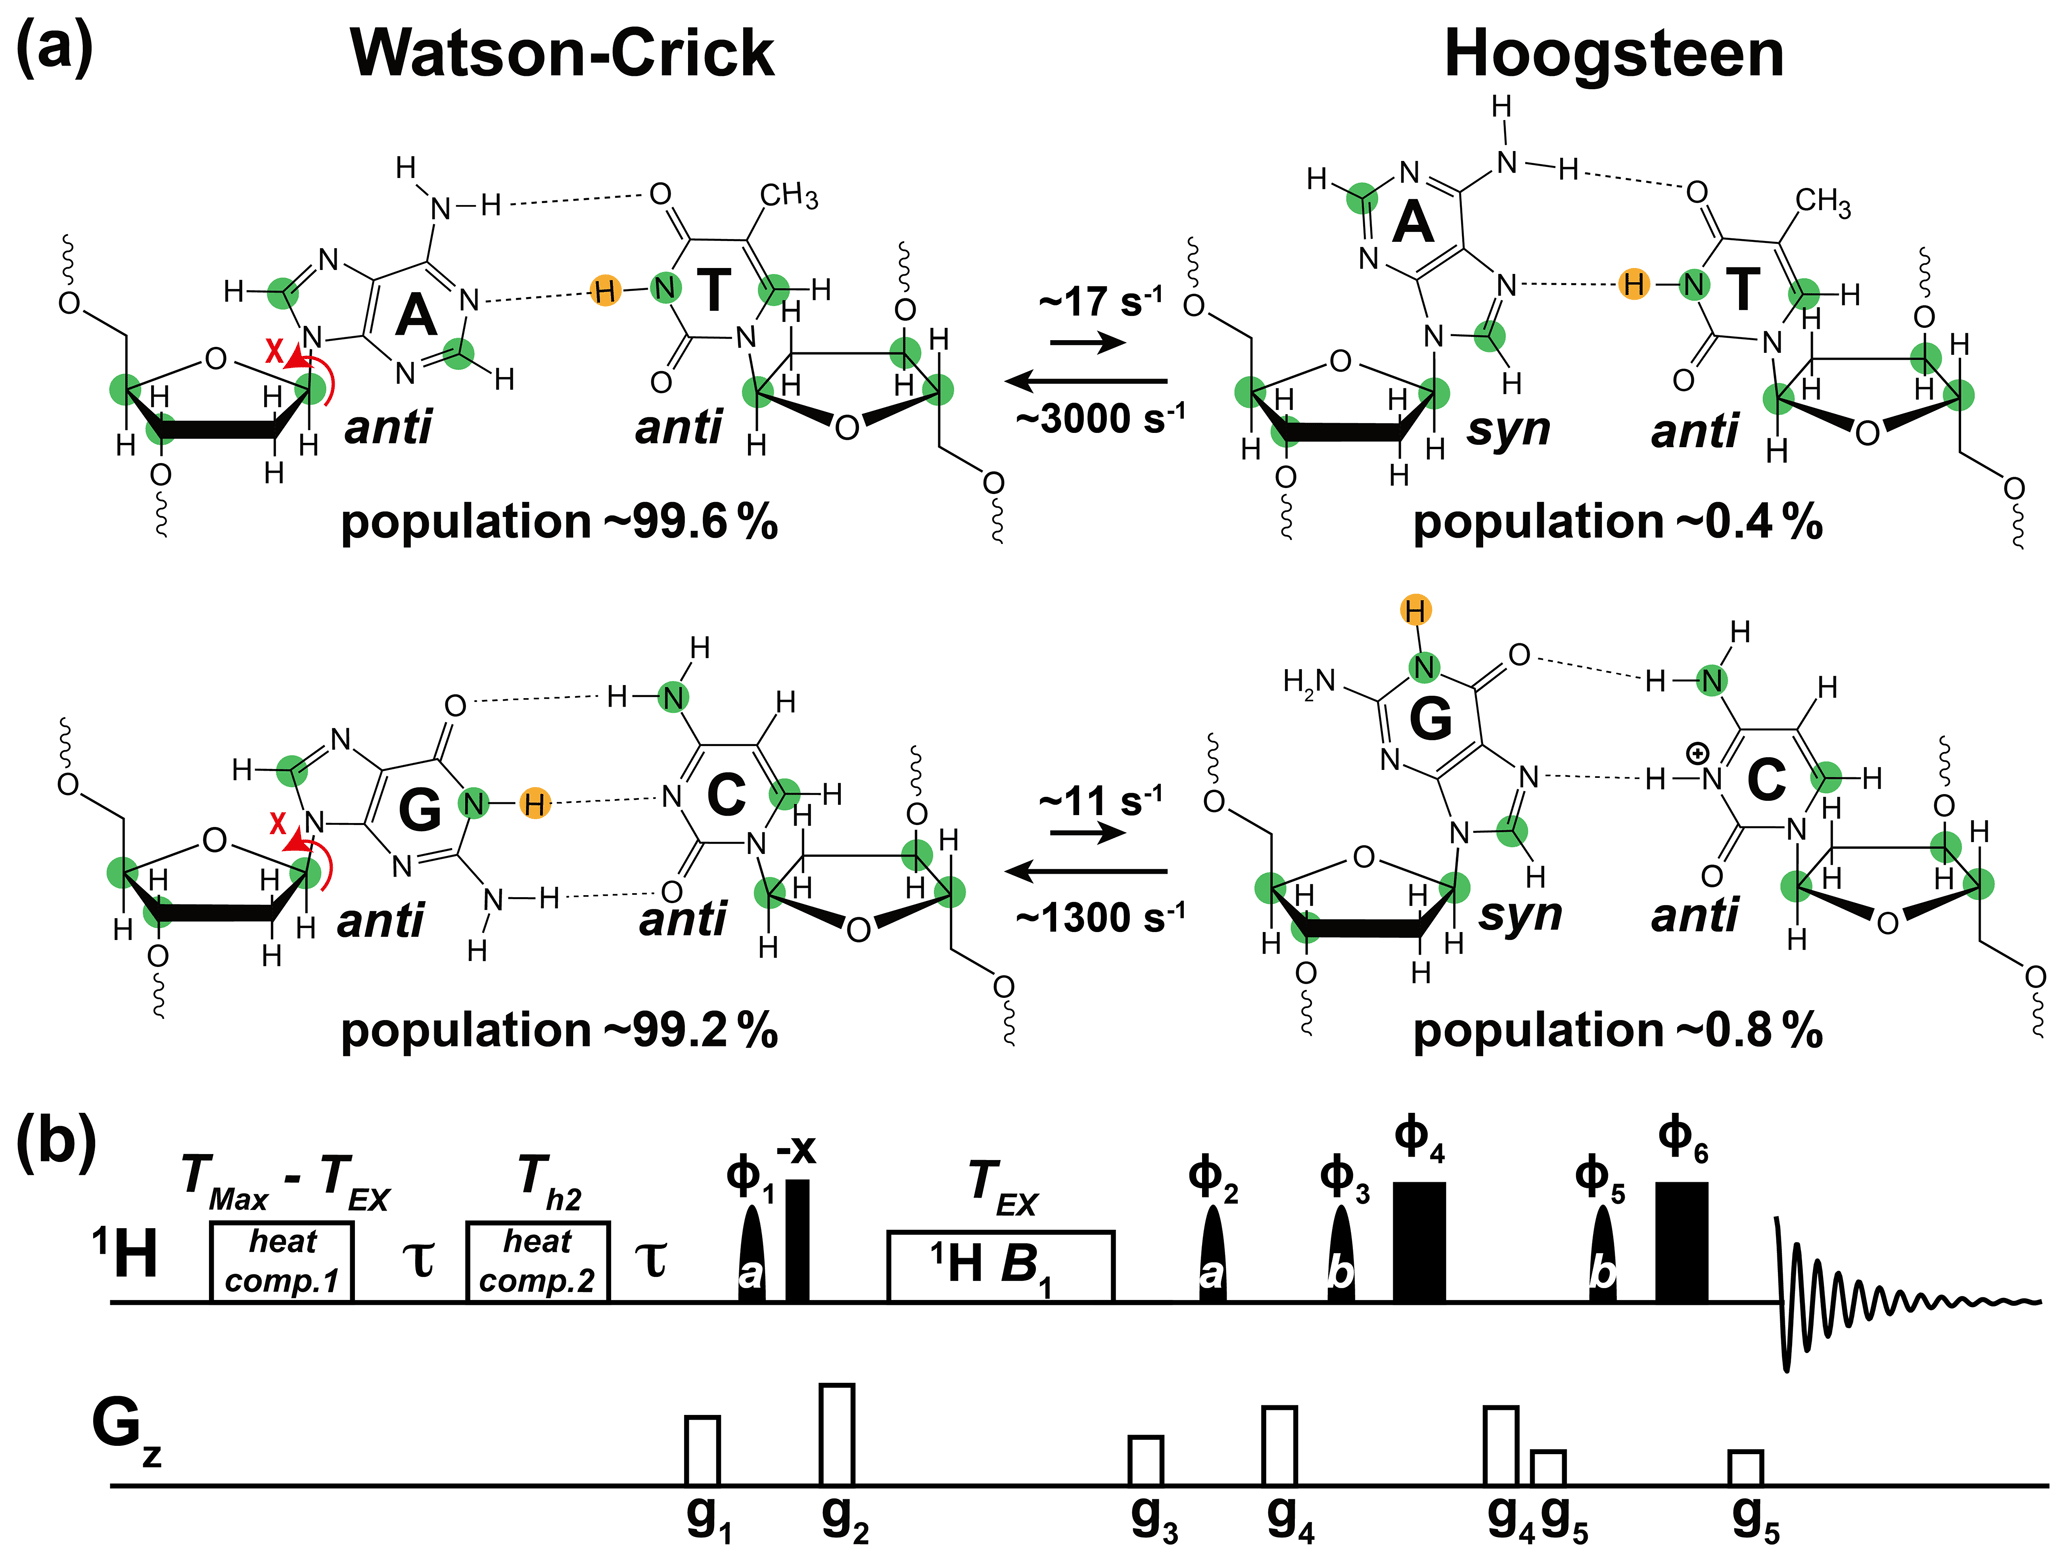
Figure 1Using 1H CEST to measure Watson–Crick to Hoogsteen exchange in unlabeled nucleic acid duplexes. (a) Watson–Crick G–C and A–T bp's in B-DNA exist in dynamic equilibrium with G–C+ and A–T Hoogsteen bp's, respectively. Filled green circles denote nuclei (13C and 15N) that have previously been used to probe the Watson–Crick to Hoogsteen exchange via RD measurements, while the yellow circle denotes the imino 1H probes used in this study. Rate constants and populations were obtained as described previously (Alvey et al., 2014). (b) The 1D SELOPE 1H CEST pulse sequence for characterizing chemical exchange in unlabeled nucleic acids. Narrow and wide filled rectangles denote 90 and 180∘ hard pulses. Semi-oval shapes denote selective pulses. Pulse a is a 90∘ Eburp2.1000 shape pulse (typically 3–4 ms) for selective excitation (excitation bandwidth ∼ 2–3 ppm) of imino protons, while pulse b is a 180∘ Squa100.1000 shape pulse with length 2 ms in an excitation sculpting scheme (Hwang and Shaka, 1995) for water suppression. Open rectangles denote the gradients and heat compensation elements. Delay s. To ensure uniform heating for experiments with variable lengths of TEX, the relaxation period during which a 1H B1 field is applied, two heat compensation modules were used according to a prior study (Schlagnitweit et al., 2018). The first heat compensation is applied far off-resonance with duration = ms, where TMax is the maximum relaxation delay time. The second heat compensation (1 kHz) applied far off-resonance has a duration Th2=150 ms. The phase cycles used are , , , , , and . Gradients (g1–g5) with SMSQ10.100 profiles are applied for 1 ms with the following amplitudes (G cm−1): 14.445, 26.215, 14.445, 16.585, 5.885. The 1H carrier is placed far offset (100 000 Hz) during the two heat compensation periods, then moved to the center of the imino resonances prior to the first pulse a. Next, the carrier is placed to a specified offset prior to the relaxation delay (TEX), then placed back to the center of the imino resonances following TEX. Finally, it is placed on-resonance with water for water suppression prior to pulse b. Briefly, imino 1H magnetization is selectively excited, aligned longitudinally and then relaxes under a 1H B1 field during TEX. 1H transverse magnetization is then created and directly detected following water suppression. This pulse sequence is adapted from Schlagnitweit et al. (2018).
Following their discovery, Hoogsteen bp's were observed in crystal structures of duplex DNA in complex with proteins (Kitayner et al., 2010; Aishima et al., 2002) and drugs (Wang et al., 1984; Ughetto et al., 1985) and shown to play a role in DNA recognition (Golovenko et al., 2018), damage induction (Xu et al., 2020), and repair (Lu et al., 2010), and in damage bypass during replication (Nair et al., 2006; Ling et al., 2003). NMR relaxation dispersion (RD) studies employing off-resonance 13C and 15N spin relaxation in the rotating frame (R1ρ) later showed that the G–C and A–T Watson–Crick bp's exist in a dynamic equilibrium with their Hoogsteen counterparts (Nikolova et al., 2011). The Hoogsteen bp's were shown to be lowly populated (population < 1 %) and short-lived (lifetime ∼ 1 ms) forming robustly as an excited conformational state (ES) in duplex DNA across a variety of sequence contexts (Alvey et al., 2014) (Fig. 1a).
There is growing interest in mapping the Watson–Crick to Hoogsteen exchange landscape across different DNA contexts, including for bp's in different sequence motifs (Alvey et al., 2014), near sites of damage and mismatches (Shi et al., 2021; Singh et al., 1993), and when DNA is bound to proteins (Nikolova et al., 2013b; Zhou et al., 2019) and drugs (Xu et al., 2018; Wang et al., 1984). Studies suggest an increased propensity to form Hoogsteen bp's in such environments (Shi et al., 2021), and this may in turn play a role in DNA recognition and damage repair (Afek et al., 2020). Furthermore, there is interest in understanding how the Hoogsteen exchange varies with temperature (Nikolova et al., 2011), pH (Nikolova et al., 2013a), salt concentration and buffer composition (Rangadurai et al., 2020b; Tateishi-Karimata et al., 2014), as well as in the presence of epigenetic modifications (Wang et al., 2017; Rangadurai et al., 2019a), all of which could shape these dynamics and consequently DNA biochemical transactions.
There are hundreds and thousands of motifs and conditions for which characterization of Hoogsteen dynamics is of biological interest. However, current approaches for measuring Hoogsteen dynamics are ill-suited for dynamics measurements at such a scale. The Watson–Crick to Hoogsteen chemical exchange process has been characterized with the use of 13C (Nikolova et al., 2011; Shi et al., 2018; Ben Imeddourene et al., 2020; Alvey et al., 2014) and 15N (Nikolova et al., 2012a; Rangadurai et al., 2019a; Alvey et al., 2014) off-resonance R1ρ, and more recently chemical exchange saturation transfer (CEST) experiments (Rangadurai et al., 2020b, a). However, these approaches require isotopically enriched DNA samples, making broad explorations of Hoogsteen exchange across even tens of motifs impractical. Furthermore, many motifs of interest involve damaged or modified nucleotides, which are difficult to isotopically enrich with 13C and 15N nuclei. It is therefore desirable to have more facile means to initially assess Watson–Crick to Hoogsteen exchange and to follow up with in-depth characterization for those motifs exhibiting interesting and unusual behavior. For such an initial screening application, we turned our attention to the imino 1H as a probe of the Watson–Crick to Hoogsteen exchange in unlabeled DNA samples.
The utility of protons as probes in CEST (Chen et al., 2016; Dubini et al., 2020; Wang et al., 2021; Liu et al., 2021a), Carr–Purcell–Meiboom–Gill (CPMG) (Juen et al., 2016; LeBlanc et al., 2018), and off-resonance R1ρ experiments (Wang and Ikuta, 1989; Lane et al., 1993; Steiner et al., 2016; Schlagnitweit et al., 2018; Baronti et al., 2020; Furukawa et al., 2021) to study conformational exchange in nucleic acids is now well-established. Many of these 1H-based approaches use experiments originally developed to study conformational exchange in proteins (Ishima et al., 1998; Eichmuller and Skrynnikov, 2005; Lundstrom and Akke, 2005; Lundstrom et al., 2009; Otten et al., 2010; Bouvignies and Kay, 2012; Hansen et al., 2012; Weininger et al., 2012, 2013; Smith et al., 2015; Sekhar et al., 2016; Yuwen et al., 2017a, b). The 1H experiments permit the use of higher effective fields allowing characterization of conformational exchange faster than is possible using 13C or 15N experiments (Steiner et al., 2016; Palmer, 2014). Furthermore, the relationship between 1H chemical shifts and structure is reasonably well understood and has been exploited in the conformational characterization of nucleic acids (Sripakdeevong et al., 2014; Frank et al., 2013; Wang et al., 2021; Swails et al., 2015; Czernek et al., 2000; Lam and Chi, 2010).
Recently, 1H R1ρ and CEST SELective Optimized Proton Experiments (SELOPE) were developed and applied to characterize conformational exchange in unlabeled RNA (Schlagnitweit et al., 2018). The SELOPE experiment has already found several applications in studies of unlabeled nucleic acids, including in the characterization of fast ( s−1) RNA secondary structural rearrangements (Baronti et al., 2020) and DNA base opening (Furukawa et al., 2021), as well as slower (kex < 100 s−1) DNA hybridization kinetics (Dubini et al., 2020). Many 1H relaxation dispersion (RD) studies have targeted exchangeable imino protons (Baronti et al., 2020; Furukawa et al., 2021), taking advantage of the well-known dependence of the imino 1H chemical shifts on secondary structure (Wang et al., 2021; Lam and Chi, 2010).
Although 1H RD experiments can obviate the need for isotopic labeling and offer other advantages such as high sensitivity, they have not been as widely used compared to 13C 15N RD experiments. One reason for this has to do with potential artifacts arising due to from 1H–1H cross-relaxation (Ishima et al., 1998; Eichmuller and Skrynnikov, 2005; Lundstrom and Akke, 2005; Bouvignies and Kay, 2012). Interestingly, in nucleic acids, such NOE effects appear to be effectively suppressed in the 1H SELOPE experiment through selective excitation of spins (Schlagnitweit et al., 2018). The exchange parameters obtained using 1H SELOPE experiments were shown to be in very good agreement with counterparts obtained using 13C and 15N off-resonance R1ρ (Baronti et al., 2020). In addition, similar exchange parameters were obtained when using variable tilt angles in R1ρ experiments, including tilt angle of 35.3∘ in which ROE and NOE cross-relaxation terms cancel (Eichmuller and Skrynnikov, 2005; Weininger et al., 2013; Steiner et al., 2016). No NOE dips or artifacts were observed in the majority of the 1H CEST or off-resonance R1ρ profiles (Steiner et al., 2016; Dubini et al., 2020; Furukawa et al., 2021). These results are consistent with a prior off-resonance 1H R1ρ studies showing that even without deuteration, it is feasible to effectively suppress cross-relaxation between amide and aliphatic protons through selective inversion of amide protons and use of short spin-lock relaxation delays (Lundstrom and Akke, 2005; Schlagnitweit et al., 2018). Nevertheless, NOE effects have been reported for select sites in 1H SELOPE studies of nucleic acids (Schlagnitweit et al., 2018) and in 1H CEST studies of proteins (Bouvignies and Kay, 2012; Sekhar et al., 2016; Yuwen et al., 2017a, b). This underscores the need to carefully analyze NOE effects, especially for unlabeled samples, in which spin-state-selective magnetization transfer schemes (Yuwen et al., 2017a, b) employing heteronuclei to suppress NOE effects are not feasible.
There are certain conditions in which the Hoogsteen bp becomes the dominant conformation in duplex DNA. These include chemically modified bases (Nikolova et al., 2011), when DNA is in complex with binding partners (Xu et al., 2018), and for specific sequence contexts under certain experimental conditions (Stelling et al., 2017). Based on NMR studies of such duplexes containing Hoogsteen bp's, there should be a sizable difference (Δω ∼ −1 to −2 ppm) between the imino proton chemical shifts of guanine (G-H1) and thymine (T-H3) in the Hoogsteen versus Watson–Crick conformation. These differences should render G-H1 and T-H3 suitable probes of Hoogsteen exchange in unlabeled DNA duplexes provided that NOE effects can be effectively suppressed. Imino protons are also attractive probes given that they are often well-resolved even in 1D 1H spectra of large RNAs. Since no other ESs have been detected to date in several NMR studies of unmodified canonical DNA duplexes (Nikolova et al., 2011; Alvey et al., 2014; Shi et al., 2018; Ben Imeddourene et al., 2020), a single imino 1H probe could be sufficient to reliably map and characterize the Watson–Crick to Hoogsteen exchange.
Here, we show that high-power 1H CEST SELOPE experiments targeting the imino protons G-H1 and T-H3 provide facile means for initially assessing Watson–Crick to Hoogsteen exchange of G–C and A–T bp's in DNA without the need for isotopic enrichment. NOE effects are shown to have a negligible contribution as short (≤ 100 ms) relaxation delays can be used to characterize the relatively fast (kex ∼ 500 to 8000 s−1) Watson–Crick to Hoogsteen exchange process (Alvey et al., 2014). The approach also takes advantage of high-power radio-frequency (RF) fields recently shown (Rangadurai et al., 2020a) to extend the timescale sensitivity of CEST to include faster exchange processes that traditionally are more effectively characterized with the use of R1ρ. The high-power 1H CEST experiment also enabled measurement of fast Hoogsteen exchange kinetics (kex > 20 000 s−1) inaccessible to conventional 13C or 15N off-resonance R1ρ RD. The 1H CEST experiment opens the door to more comprehensively and systematically exploring how the Watson–Crick to Hoogsteen exchange process varies with sequence and structural contexts and physiological conditions of interest.
2.1 Assessment of NOE effects
We used the SELOPE (Schlagnitweit et al., 2018) experiment (Fig. 1b) to measure 1H CEST profiles for G-H1 and T-H3 in unlabeled DNA duplexes (Fig. 2) at 25–26 ∘C. We used 1H CEST rather than R1ρ given the greater ease of collecting profiles for many spins simultaneously, and given that with the use of high-power RF fields, CEST can effectively characterize exchange processes over a wide range of timescales (Rangadurai et al., 2020a). Use of high-power RF fields was recently shown to be important to effectively characterize the comparatively fast (kex ∼ 3000 s−1) Watson–Crick to Hoogsteen exchange process using 13C and 15N CEST experiments (Rangadurai et al., 2020a). Here, we also employed high-power RF fields (> 250 Hz) to optimally characterize Watson–Crick to Hoogsteen exchange using 1H CEST.
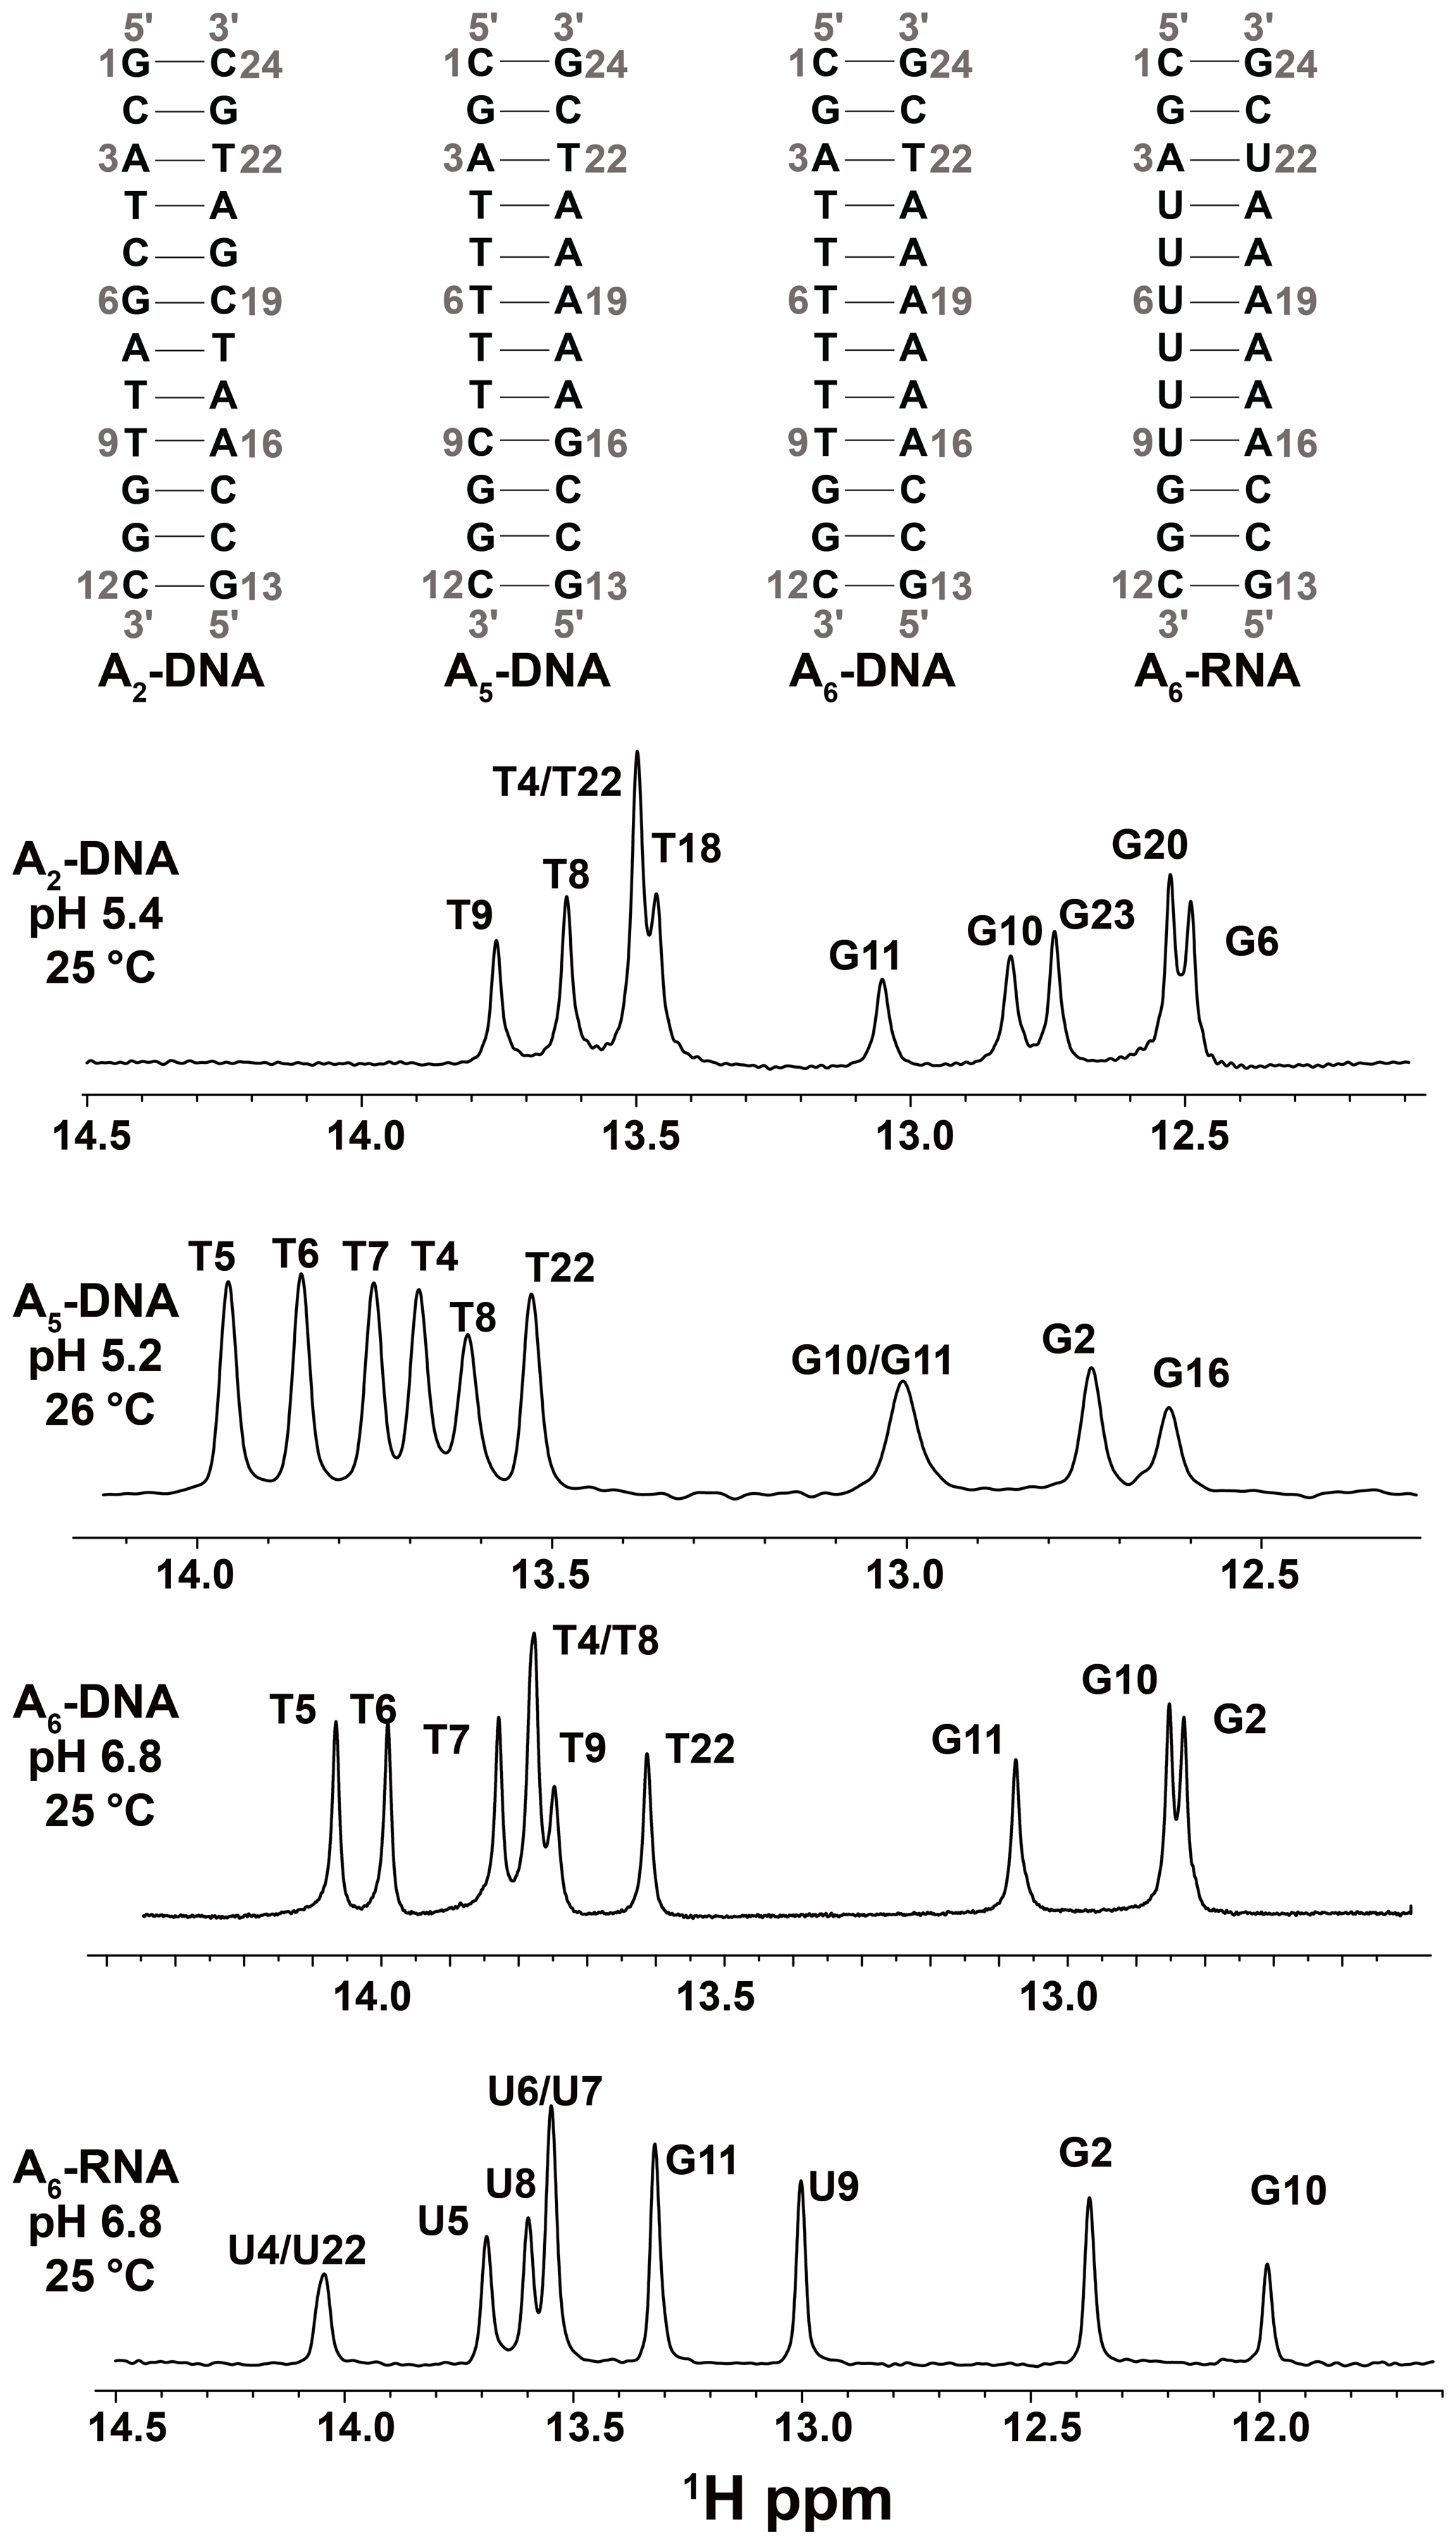
Figure 2DNA and RNA duplexes used in this study. Also shown are 1D 1H spectra of the imino region. The buffer conditions were 25 mM sodium chloride, 15 mM sodium phosphate, 0.1 mM EDTA and 10 % D2O. The pH and temperature are indicated on each spectrum.
An important consideration when performing 1H CEST experiments is contributions due to 1H–1H cross-relaxation, which may give rise to extraneous NOE dips in the 1H CEST profiles (Ishima et al., 1998; Lundstrom and Akke, 2005; Eichmuller and Skrynnikov, 2005; Bouvignies and Kay, 2012; Sekhar et al., 2016; Yuwen et al., 2017a, b). These contributions have been suppressed in proteins through deuteration (Eichmuller and Skrynnikov, 2005; Lundstrom and Akke, 2005; Lundstrom et al., 2009; Otten et al., 2010; Hansen et al., 2012; Weininger et al., 2012), in 15N isotopically labeled proteins (Yuwen et al., 2017a, b) and nucleic acids (Wang et al., 2021; Liu et al., 2021a) using spin-state-selective magnetization transfer schemes, and through selective inversion of protons combined with use of short relaxation times (Lundstrom and Akke, 2005; Schlagnitweit et al., 2018).
In the SELOPE experiment, imino protons are selectively excited, and the magnetization belonging to non-imino protons is dephased prior to application of the B1 field. This helps to suppress cross-relaxation (Yamazaki et al., 1994) between the imino and non-imino protons (vide infra). In addition, because the Watson–Crick to Hoogsteen exchange is relatively fast with kex = ∼ 500–8000 s−1 at 25 ∘C (Alvey et al., 2014), we could afford to use a relatively short relaxation delay of 100 ms, which also helped minimize NOE effects (vide infra) (Lundstrom and Akke, 2005; Schlagnitweit et al., 2018).
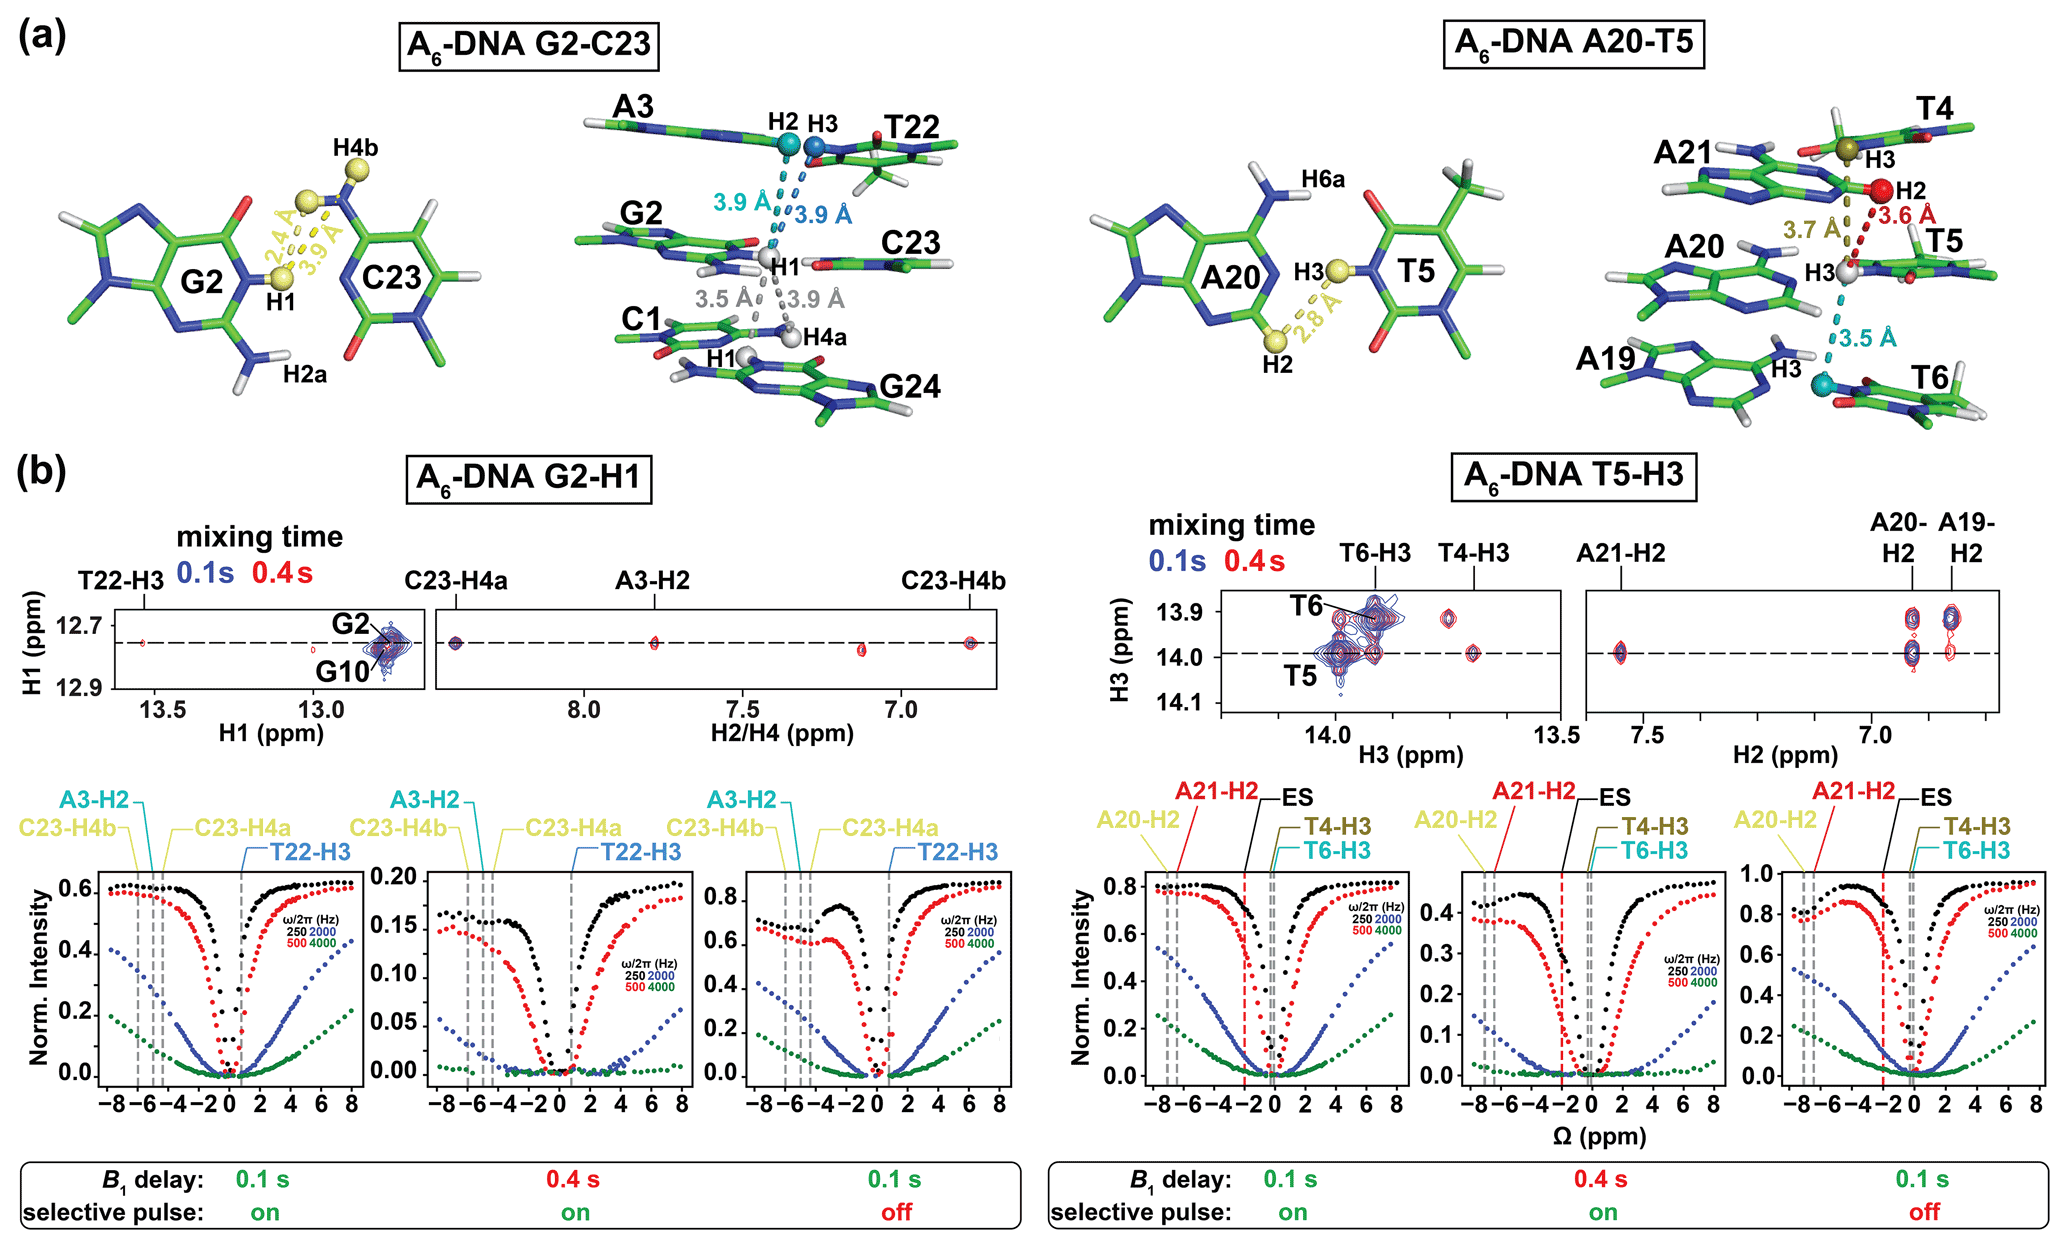
Figure 3Analysis of NOE effects in 1H CEST profiles. (a) Distances between the imino protons of G2-H1 and T5-H3 and nearby protons in the A6-DNA duplex (PDBID: 5UZF). Note that although the amino proton of G-H2a is in proximity (2.2 Å) to G-H1, while the amino proton of A-H6a is in proximity (2.4 Å) to the partner T-H3, these amino protons are not observable in 1D 1H or 2D [1H,1H] NOESY spectra caused by intermediate exchange due to the restricted rotation around the C–NH2 bond (Schnieders et al., 2019). (b) NOE dips in 1H CEST profiles for G2-H1 and T5-H3 in A6-DNA. The NOE diagonal and cross peaks for G2-H and T5-H3 in the 2D [1H, 1H] NOESY spectra with mixing time 100 ms (blue) and 400 ms (red) are shown on the top. The 1H CEST profiles for G2-H1 and T5-H3 with combinations of short (100 ms) and long (400 ms) relaxation delays, with and without selective excitation (Methods), are shown at the bottom. The ES frequency (black) obtained from fitting 1H CEST profiles with selective excitation and short relaxation delay (100 ms) as well as frequency positions corresponding to the NOE cross peaks in the 2D [1H, 1H] NOESY spectra (top) are highlighted according to the color scheme in (a) (bottom). Error bars for CEST profiles in (b), which are smaller than the data points, were obtained using triplicate experiments, as described in Methods. RF powers for CEST profiles are color-coded.
We initially performed experiments to evaluate contributions from 1H–1H cross-relaxation to the imino 1H CEST profiles. In canonical B-form DNA and A-form RNA duplexes (Fig. 2), G-H1 is in closest proximity to the partner base C-H4a (∼ 2.4 Å, Fig. 3a), while T/U-H3 is in closest proximity to the partner A-H2 (∼ 2.8 Å, Fig. 3a). Additional proximal protons include imino and H2 protons of neighboring residues (∼ 3.5–3.6 Å, Fig. 3a). These short internuclear distances are reflected in the intensity of cross peaks in 2D [1H, 1H] NOESY spectra of nucleic acid duplexes (Figs. 3b and S1 in the Supplement). Note that although the amino proton of G-H2a is in proximity (2.2 Å) to G-H1, while the amino proton of A-H6a is in proximity (2.4 Å) to the partner T-H3 (Fig. 3a), these amino protons are typically not observable in 1D 1H or 2D [1H,1H] NOESY spectra caused by intermediate exchange due to the restricted rotation around the C–NH2 bond (Schnieders et al., 2019).
1H CEST profiles (Figs. 3b and S2) for well-resolved imino resonances of A6-DNA (Fig. 2) were acquired simultaneously in a 1D manner using ∼ 3 h of acquisition time on a spectrometer operating at 600 MHz 1H frequency equipped with a cryogenic probe, using ∼ 1.0 mM unlabeled DNA (Methods). Data were initially collected at pH = 6.8. Under these near-neutral pH conditions, it is generally not feasible to detect the Watson–Crick to Hoogsteen exchange process for G–C bp's due to the low population of the protonated G–C+ Hoogsteen bp's (Nikolova et al., 2013a). The lack of expected dips for the ES G–C+ Hoogsteen bp's under these conditions provides an opportunity to better assess any extraneous 1H CEST dips arising due to NOE effects. Unlike for G–C bp's, the Hoogsteen exchange should still be detectable for A–T bp's under these pH conditions.
Shown in Fig. 3b is a representative imino 1H CEST profile measured for G2-H1 in the well-characterized A6-DNA duplex (Nikolova et al., 2011). Besides the major dip, no additional dips were visible in the 1H CEST profile. The major dip was also symmetric (Rangadurai et al., 2020a), indicating little to no contribution from Hoogsteen exchange or NOE effects, as expected for G–C bp's under these pH conditions (Nikolova et al., 2013a). On the other hand, a minor shoulder was observed in the 1H CEST profile of T5-H3 (Fig. 3b, the Δω is highlighted by a dashed red line and labeled “ES”). The shoulder occurs at an offset frequency that does not correspond with any other observable proton frequency in the A6-DNA duplex and is therefore unlikely to be the result of NOE effects (Fig. 3a). Rather, as will be described below, the shoulder corresponds to the ES Hoogsteen bp, which is to be expected for the A–T bp at pH = 6.8.
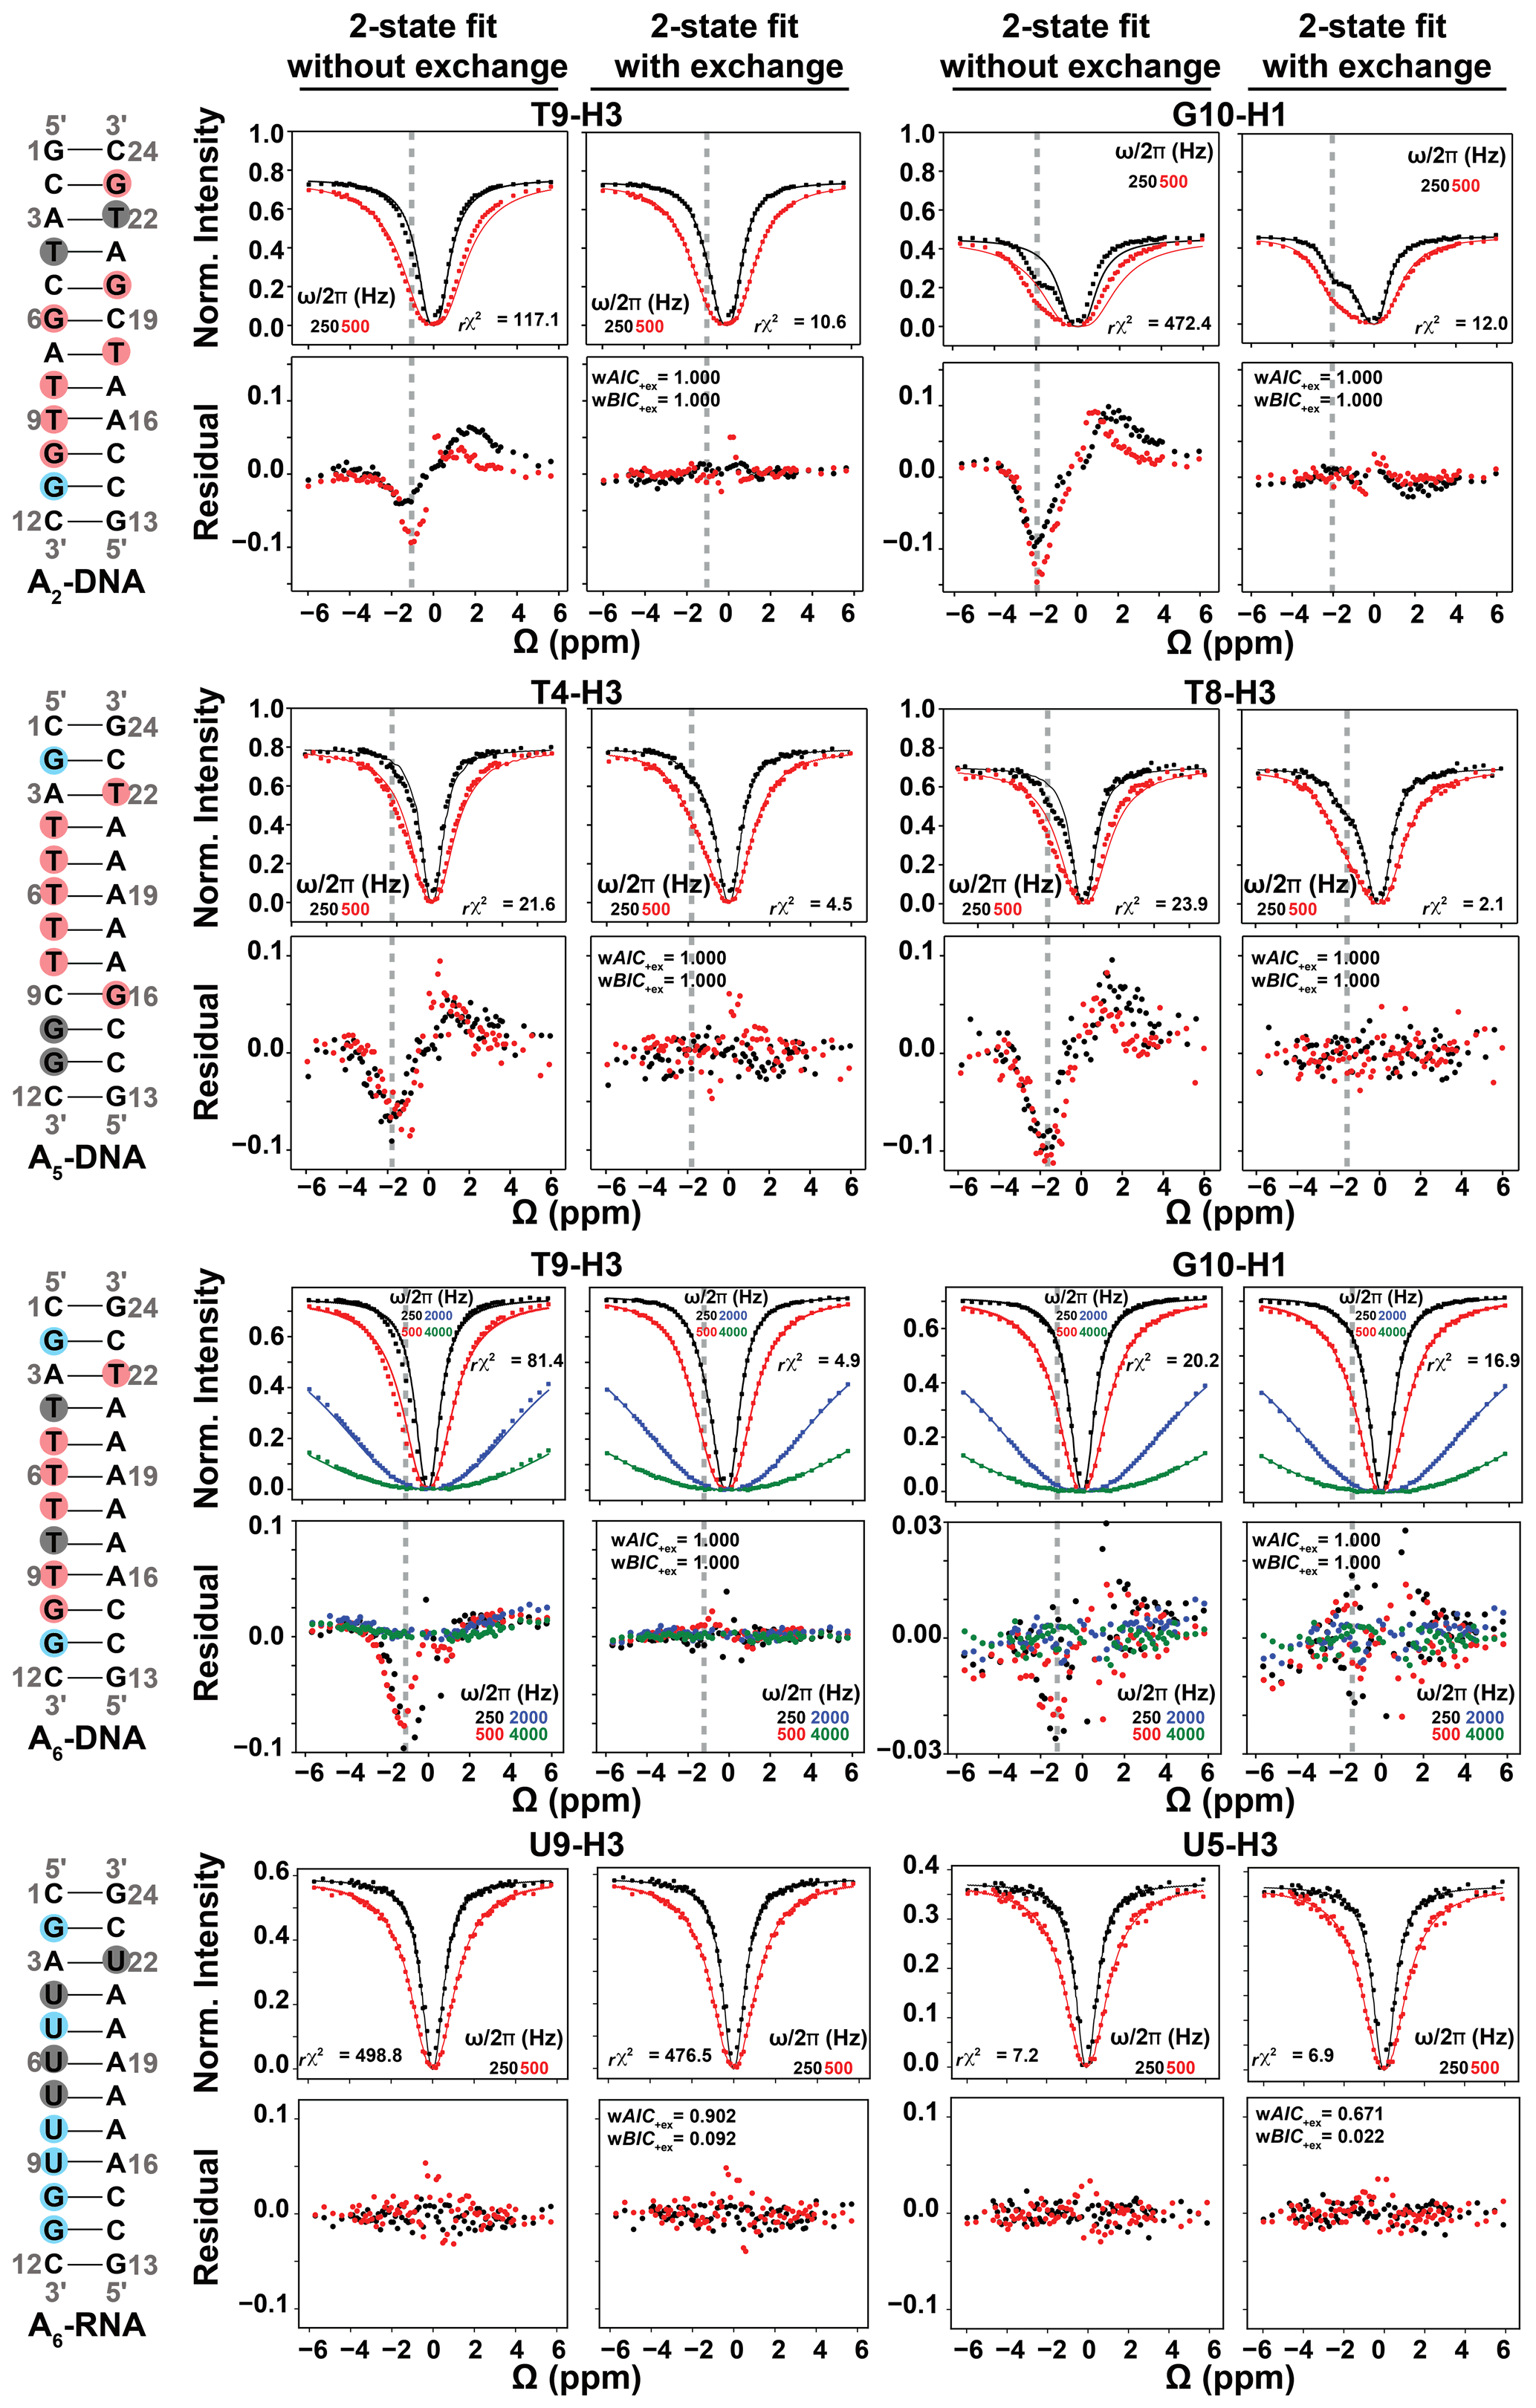
Figure 4Representative 1H CEST profiles measured for A2-DNA (pH 5.4) at 25 ∘C, A5-DNA (pH 5.2) at 26 ∘C, A6-DNA (pH 6.8) at 25 ∘C and A6-RNA (pH 6.8) at 25 ∘C. Residues with detectable RD, undetectable RD and overlapped 1D 1H resonances (see Fig. 2) are highlighted in red, blue and gray circles respectively. Shown are the fits of the 1H CEST data to a two-state Bloch–McConnell equation with and without () chemical exchange. Shown below the CEST profiles are residual (experimental normalized intensity – fitted normalized intensity) plots. Also shown are the reduced chi-square (rχ2), and Akaike's (wAIC) and Bayesian information criterion (wBIC) weights for fits with exchange (Methods). The dashed gray lines indicate the Hoogsteen Δω positions in both 1H CEST profiles and in residual plots. Error bars for CEST profiles, which are smaller than the data points, were obtained using triplicate experiments, as described in Methods. RF powers for CEST profiles are color-coded.
To further verify that the dips observed in the 1H CEST profile of T5-H3 and other thymine residues in A6-DNA (see Figs. 4 and S2) do not represent an NOE effect, but rather reflect the ES Hoogsteen bp, we performed 1H CEST experiments on a corresponding A6-RNA duplex (Fig. 2). Unlike in B-form DNA duplexes, G–C+ and A–U Hoogsteen bp's are both undetectable in A-form RNA duplexes by off-resonance 13C and 15N R1ρ RD, most likely due their much lower population (pES < 0.04 %) (Zhou et al., 2016; Rangadurai et al., 2018). If the shoulder observed in the 1H CEST profile of T5-H3 in A6-DNA is due to a Hoogsteen ES, and not NOE dips, we would expect to observe a symmetric profile without ES dips for U5-H3 in A6-RNA. Indeed, the corresponding 1H CEST profiles for U5-H3 (Fig. 4) and all other uridine and guanine (Fig. S3) imino protons in A6-RNA were symmetric, with no evidence for any asymmetry or shoulder, indicating the absence of exchange and NOE effects.
Therefore, the shoulders in the 1H CEST profiles (Figs. 3, 4, S2, S3) most likely rise due to chemical exchange with an ES. This was further confirmed by evaluating whether fits to the 1H CEST profiles show any statistically significant improvement with the inclusion of exchange, as described below. Based on a similar analysis, no NOE dips were observable in the 1H CEST profiles (Figs. 4, S2, S3) for all other residues in A6-DNA, A6-RNA, and in two other DNA duplexes across a range of pH and temperature conditions when using selective excitation and relaxation delay of 100 ms (Figs. 2, 4, S2, S3). These results indicate that any NOE effects between imino and non-imino protons are small under these experimental conditions.
Upon increasing the relaxation delay to 400 ms or using a non-selective 1H excitation pulse (pulse a in Fig. 1b) with a delay of 100 ms, NOE dips became visible in the 1H CEST profiles as shown for G2-H1 and T5-H3 (Fig. 3b) in A6-DNA. The dips occurred at the 1H resonance frequency of nearby protons and, as expected, were particularly pronounced for the partner C-H4a in the case of G2-H1 and the partner A-H2 in the case of T5-H3 (Fig. 3b). Nevertheless, even the 1H CEST profiles acquired with 400 ms delay could be fit when restricting the offset to the imino proton region (−3 to 3 ppm), and the fitted exchange parameters were similar to those obtained from fitting profiles with 100 ms relaxation delay in which no NOE dips were visible (Fig. S4, Table S1). In contrast, the 1H CEST profiles measured using non-selective excitation, which had larger NOE dips relative to using a selective excitation pulse, could not be satisfactorily fit (Fig. S4).
No NOE dips were observed at the chemical shift of imino protons belonging to neighboring residues in 1H CEST profiles measured in DNA and RNA duplexes, and none of the 1H CEST profiles collected in thus study yielded an ES with Δω compatible with the imino 1H chemical shift of a neighboring residue. Nevertheless, these NOE effects could be more difficult to assess given that they would be buried within the major dip. While imino–imino 1H NOEs are not suppressed by selective excitation, their contribution is expected to be smaller relative to other NOE dips observed when using non-selective excitation (distances ∼ 2.4–2.8 Å between guanosine/thymine imino and cytosine amino/adenine H2) due the larger distance of separation between neighboring imino protons (∼ 3.5–3.9 Å) (Fig. 3a).
To further assess the impact of imino–imino 1H NOEs on the 1H CEST profiles, we examined whether selective excitation of imino protons (but not their immediate neighbors) results in different 1H CEST profiles relative to an experiment in which all imino protons are excited. We performed an experiment selectively exciting G10-H1 and G2-H1 in A6-DNA without exciting the imino resonances belonging to either of their two immediate neighbors. Selective excitation of individual imino protons resulted in 1H CEST profiles (Fig. S2) and fitted parameters (Table S1) for G10-H1 and G2-H1 that are within error to those obtained when exciting all imino protons, again indicating that any imino–imino NOE contribution is negligible. Finally, the impact of imino–imino NOEs on the determination of the exchange parameters was also assessed (vide infra) through comparison of the exchange parameters derived from fitting the imino 1H CEST profiles with those measured independently using off-resonance 13C and 15N R1ρ RD measurements.
These results underscore the importance of critically evaluating the NOE contributions on a case-by-case basis (Schlagnitweit et al., 2018) and also suggest that NOE effects can be effectively suppressed for the canonical duplexes used in this study provided use of selective excitation and short relaxation delays.
It should be noted that to avoid any complexities due to NOE effects with water protons or hydrogen exchange, we restricted the offset to −6 to 6 ppm when analyzing and fitting the 1H CEST profiles. This is common practice as relatively narrow offsets (< 4 ppm) were used in prior 1H CEST studies of both nucleic acids (Dubini et al., 2020; Wang et al., 2021; Liu et al., 2021a) and proteins (Yuwen et al., 2017a, b). While we did not observe a dip near the water chemical shift in the 1H CEST profile for the internal residue T5-H3, a weak and broad dip near the water chemical shift was observed in the profile for the near-terminal residue G2-H1 (Fig. S2). The latter dip could be due to NOEs between G2-H1 and water protons and/or due to fast hydrogen exchange kinetics.
2.2 Benchmarking the utility of 1H CEST to probe Watson–Crick to Hoogsteen exchange in DNA duplexes
To examine the utility of the SELOPE 1H CEST experiment to characterize Watson–Crick to Hoogsteen exchange, we benchmarked the experiment by measuring conformational exchange in three DNA duplexes (A6-DNA, A2-DNA and A5-DNA, Fig. 2) for which we have previously extensively characterized the Watson–Crick to Hoogsteen exchange using 13C and 15N off-resonance R1ρ (Nikolova et al., 2011; Alvey et al., 2014; Shi et al., 2018) and CEST (Rangadurai et al., 2020a, b) experiments. We compared the exchange parameters derived using 1H CEST with counterparts derived using 13C 15N R1ρ or CEST for a variety of G–C and A–T bp's across three different DNA duplexes and varying pH (5.2–6.8) conditions. All 1H CEST experiments were performed using 100 ms relaxation delay and selective excitation.
As expected, for several thymine residues, the imino 1H CEST profile was visibly asymmetric (Figs. 4, S2, S3), consistent with relatively fast (kex > 1000 s−1) Watson–Crick to Hoogsteen exchange. The asymmetry manifests as an upfield shifted shoulder (e.g., T8-H3 in A5-DNA in Fig. 4) as expected for T-H3 Hoogsteen chemical shift (Δω ∼ −2 ppm) (Nikolova et al., 2011; Xu et al., 2018). In other cases, such as T9-H3 in A6-DNA, the asymmetry was less pronounced, and the exchange contribution was only apparent following comparison of fits with and without exchange (see Fig. 4).
As expected, at pH = 6.8, the imino 1H CEST profiles were symmetric for most guanine residues consistent with no observable exchange (Figs. 4, S2, S3). However, the major dip became asymmetric for several guanine residues when lowering the pH to 5.2 or 5.4, as expected for the Watson–Crick to Hoogsteen exchange of G–C bp's, which is favored at lower pH (Figs. 4 and S3). All minor dips occurred at resonance frequencies that did not correspond with any other protons in the molecule (Figs. 2, S1, S2). In all cases, the 1H CEST profiles could be satisfactorily fit to a two-state model with or without exchange, suggesting that any NOE contribution to the 1H CEST profile is likely to be insignificant.
To identify which imino 1H CEST profiles have significant chemical exchange contributions, each profile was subjected to a fit with or without () two-state chemical exchange (Methods). Akaike information criterion (AIC) and Bayesian information criterion (BIC) (Burnham and Anderson, 2004) weights were then used to evaluate whether any improvement in the fit due to inclusion of chemical exchange was statistically significant (Kimsey et al., 2018; Liu et al., 2021a). The improvement of fit was considered to be statistically significant when both AIC and BIC weights are > 0.995 and the reduced chi-square (rχ2) is reduced with the inclusion of exchange. Residual plots were also used to visualize changes in fit quality (Fig. 4).
Based on the AIC and BIC analysis, all thymine and guanine residues shown previously to undergo Watson–Crick to Hoogsteen exchange using off-resonance 13C and/or 15N R1ρ under these experimental conditions also showed statistically significant improvements when fitting the 1H CEST profiles with the inclusion of chemical exchange (Figs. 4, S2, S3). On the other hand, all guanine residues, including G2 and G11 in A6-DNA and G11 in A2-DNA, which did not show signs of Hoogsteen exchange in off-resonance 13C and/or 15N R1ρ (Nikolova et al., 2011; Shi et al., 2018) under these experimental conditions, also did not show statistically significant improvements when fitting their 1H CEST profiles with the inclusion of chemical exchange (Figs. 4, S2, S3).
Interestingly, a few residues, including T5, T6, T7 and T22 in A6-DNA and T18, G6 and G20 in A2-DNA (Figs. S2, S3), showed exchange based on 1H CEST but did not show evidence for Hoogsteen exchange based on prior off-resonance 13C and/or 15N R1ρ experiments (Nikolova et al., 2011; Alvey et al., 2014; Shi et al., 2018). As will be elaborated in the following section, these data provide new insights into the Watson–Crick to Hoogsteen exchange process and suggest that at least in some cases, 1H CEST can exceed the detection limits of 13C 15N-based methods.
In addition, T18 and G20 in A2-DNA were difficult to probe using 13C RD due to spectra overlap (Nikolova et al., 2011) but could easily be measured using 1H CEST (Figs. 2, 4 and S3). In contrast, other residues such as T8 and T4 in A6-DNA, T4 and T22 in A2-DNA, and G10 and G11 in A5-DNA could be targeted for 13C or 15N RD measurements (Nikolova et al., 2011; Alvey et al., 2014) but could not be measured by 1H CEST due to overlap in the 1D 1H imino spectra (Fig. 2). This highlights the complementarity of 1H and 13C 15N RD in characterizing Watson–Crick to Hoogsteen exchange.
To assess how well the exchange parameters are determined by the 1H CEST data, we subjected the 1H CEST profiles for residues T7 ( 0.2), T9 ( 0.82) and T22 ( 3.5), which exhibit exchange on the slow, intermediate and fast timescales (Rangadurai et al., 2019b) respectively, to a degeneracy analysis. We computed the reduced chi-square (rχ2) for a two-state fit as a function of varying kex, Δω or pES. In all cases, the rχ2 values increased significantly (up to 10-fold) when varying kex, Δω or pES by 3-fold (Fig. S5), indicating that the exchange parameters are well-defined by the 1H CEST data.
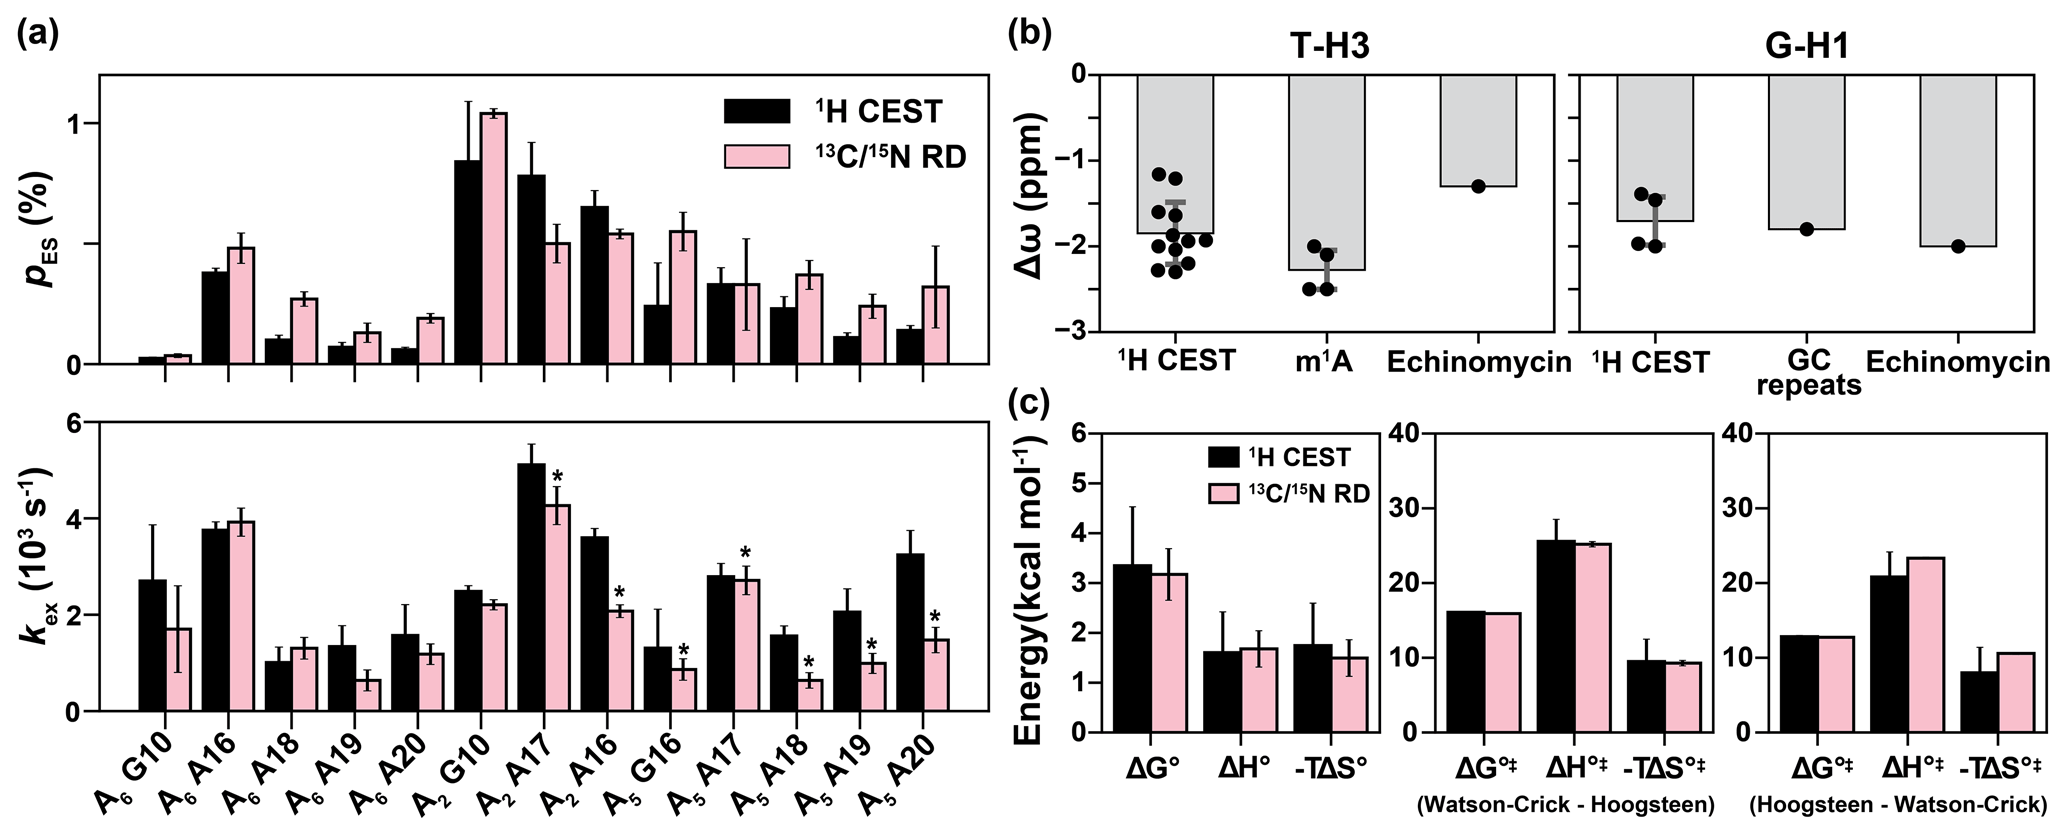
Figure 5Comparison of exchange parameters for the Watson–Crick to Hoogsteen exchange obtained from 1H CEST and 13C 15N R1ρ. (a) Comparison of exchange parameters (kex and pES) measured using 1H CEST with counterparts previously reported using 13C 15N off-resonance R1ρ (Nikolova et al., 2011; Alvey et al., 2014; Shi et al., 2018). 13C RD data for A18, A19 and A20 were measured using off-resonance R1ρ in this study (Fig. S7). Small systematic deviations in kex for the values indicated with asterisks could be due to small differences in temperature (< 0.8 ∘C) across different spectrometers. The bp's are specified by the corresponding purine residue. (b) Comparison of the Δω obtained from fitting 1H CEST profiles for T-H3 and G-H1 (Table S1) with the values expected for a Watson–Crick to Hoogsteen transition based on duplexes in which A–T or G–C+ Hoogsteen bp's were rendered the dominant state, by using N1-methylated adenine (m1A) (Nikolova et al., 2011; Sathyamoorthy et al., 2017; Rangadurai et al., 2020b), by binding of the drug (echinomycin) to a DNA duplex (Xu et al., 2018), or through use of GC repeat sequences (GC repeats) that predominantly form Hoogsteen bp's at low pH (Stelling et al., 2017). (c) Comparison of free energy (ΔG∘), enthalpy (ΔH∘) and entropy (−TΔS∘, T = 25 ∘C) of the Watson–Crick to Hoogsteen transition, and the activation free energy (ΔG∘‡), enthalpy (ΔH∘‡) and entropy (−TΔS∘‡, T = 25 ∘C) for Watson–Crick to Hoogsteen (Watson–Crick–Hoogsteen) and Hoogsteen to Watson–Crick (Hoogsteen–Watson–Crick) transitions measured using 1H CEST in this study and using 13C R1ρ from Nikolova et al. (2011). The energetics in (c) were measured for the Watson–Crick to Hoogsteen transition of A16-T9 in A6-DNA at pH 6.8. Errors in (a) were fitting errors of 1H CEST, calculated as described in Methods or errors of 13C 15N R1ρ calculated using a Monte Carlo scheme as described previously (Rangadurai et al., 2019b). Errors in (b) are the standard deviations of data points (shown as black dots) in each category. Error bars in (c) were propagated from the errors in the exchange parameters obtained from 1H CEST or 13C 15N R1ρ.
To test the accuracy of the exchange parameters obtained using 1H CEST, we compared the exchange parameters pES and kex, derived from a two-state fit of the data to values determined previously using off-resonance 13C and/or 15N R1ρ (Nikolova et al., 2011; Shi et al., 2018; Alvey et al., 2014) for Hoogsteen dynamics (Fig. 5a and Table S1). In total, we were able to compare 13 data points from 1H CEST and 13C 15N R1ρ for three different duplexes under different conditions of temperature and pH (Figs. 2, 5a). This comparison also allowed us to further verify that the exchange process detected by 1H CEST does indeed correspond to Watson–Crick to Hoogsteen exchange and to also further assess for potential contributions from NOE effects, which might cause deviations from agreement.
Indeed, the pES and kex values derived using 1H CEST were in very good agreement with their off-resonance 13C and/or 15N R1ρ counterparts (Fig. 5a). The differences between kex and pES measured using the two methods were often within error with the largest differences being < 3-fold. A small and systematic difference in kex was observed for a subset of the data (Fig. 5a), and this might be due to small temperature differences (< 0.8 ∘C) between spectrometers. Importantly, the ES imino 1H chemical shifts deduced from a two-state fit of the 1H CEST profiles ( −1 to −2 ppm and −1.5 to −2.0 ppm) were also in good agreement with the expected range of values ( to −2 ppm) for Hoogsteen bp's (Fig. 5b) based on studies of duplexes containing Hoogsteen bp's as the dominant conformation (Nikolova et al., 2011; Stelling et al., 2017; Xu et al., 2018; Rangadurai et al., 2020b).
As an additional test, we also measured temperature-dependent (5, 10, 20, 25, 30 and 45 ∘C) 1H CEST profiles for A6-DNA at pH 6.8 (Fig. S2) and then used the temperature dependence of the fitted kinetic rate constants (k1 and k−1) to determine the standard and activation enthalpy and entropy changes for the Watson–Crick to Hoogsteen transition (Fig. S6). These values were in excellent agreement with those measured from off-resonance 13C R1ρ (Nikolova et al., 2011) (Fig. 5c), further supporting the robustness of the 1H CEST methodology.
2.3 New insights into Hoogsteen breathing
1H CEST profiles for some residues show detectable exchange contributions when corresponding 13C 15N RD measurements do not or show only weak exchange. This suggests that 1H CEST can provide additional insights into Watson–Crick to Hoogsteen exchange and extend the detection limits of conventional 13C 15N RD measurements.
For example, using 1H CEST it was feasible to measure Watson–Crick to Hoogsteen exchange for T5-H3, T6-H3 and T7-H3 (Fig. S2) within the middle of the A-tract motif (defined as An-tract with n > 3) in A6-DNA. These residues had previously exhibited only weak on-resonance 13C R1ρ RD, and as a result, no off-resonance R1ρ data were ever recorded (Nikolova et al., 2011). Based on the 1H CEST measurements, residues within the A-tract motif have 10-fold lower Hoogsteen population (pES=0.06 ± 0.01 %–0.09 ± 0.03 %) relative to other A–T bp's in A6-DNA (pES > ∼ 0.10 %) (Table S1). These represent the lowest A–T Hoogsteen populations ever recorded to date in duplex DNA (Table S1). The exchange kinetics were also 2-fold slower (kex ∼ 1000 s−1) for the A-tract residues relative to other A–T bp's (kex > 2000 s−1) in A6-DNA (Table S1). Interestingly, the suppression of Hoogsteen dynamics within the A-tract motif appears to be A-tract length dependent, with both the Hoogsteen population and exchange kinetics increasing slightly for similar bp's in A5-DNA (Table S1). The suppression of Hoogsteen dynamics within A-tracts is consistent with prior studies showing them to be more rigid and stiff motifs relative to scrambled DNA (Nikolova et al., 2012b). We verified these 1H CEST-derived exchange parameters for A-tract residues in A6-DNA by performing off-resonance 13C R1ρ measurements (Fig. S7) on uniformly 13C 15N-labeled A6-DNA and did indeed observe the expected RD with pES and kex values similar (difference < 3-fold, Fig. 5a) to those measured using 1H CEST. These prospective tests of the 1H CEST data using off-resonance 13C 15N R1ρ RD data further support the methodology.
The ability to characterize fast exchange kinetics has long been a motivation for using 1H in RD experiments to characterize conformational exchange (Ishima et al., 1998; Ishima and Torchia, 2003; Eichmuller and Skrynnikov, 2005; Lundstrom and Akke, 2005; Otten et al., 2010; Hansen et al., 2012; Smith et al., 2015; Steiner et al., 2016; Furukawa et al., 2021). Indeed, 1H CEST made it possible to measure fast Watson–Crick to Hoogsteen exchange kinetics which were undetectable by off-resonance 13C R1ρ. In particular, it was possible to measure Watson–Crick to Hoogsteen exchange for T22 in A6-DNA with kex > 20 000 s−1 (Fig. S2 and Table S1), which is the fastest ever recorded Hoogsteen exchange process at 25 ∘C (Table S1). In contrast, the off-resonance 13C R1ρ RD profiles reported for this residue in prior studies were flat (Nikolova et al., 2011; Shi et al., 2018), and simulations show that such an exchange process is too fast for reliable detection using 13C R1ρ (Fig. S8a). Similarly, it was feasible to measure Watson–Crick to Hoogsteen exchange for G6 (pES ∼ 0.3 %, kex ∼ 3000 s−1) in A2-DNA using 1H CEST, yet no off-resonance 13C R1ρ RD on C1′ was previously detected (Shi et al., 2018), which based on simulations, was likely due to a combination of exchange kinetics and small Δω value (Fig. S8b).
One of the potential utilities of the 1H CEST experiment is the measurement of very fast exchange kinetics at high temperatures and in a manner insensitive to melting of duplexes, shown previously to complicate analysis of Hoogsteen exchange using 13C and 15N RD (Shi et al., 2019). Melting of duplexes should not yield any exchange dips around the imino 1H region given that the imino protons of single-stranded species (ssDNA) exchange rapidly with solvent.
We therefore measured 1H CEST profiles for A6-DNA at 45 ∘C (Fig. S2), in which the ssDNA population is ∼ 10 % (Shi et al., 2019). We did not observe any evidence for the ssDNA species in the 1H CEST profiles. Instead, we were able to observe ultra-fast (kex ∼ 10 000 s−1, see Table S1) Hoogsteen exchange which could not previously be detected by 13C or 15N RD experiments at the same temperature (Shi et al., 2019).
Taken together, these results demonstrate that the 1H CEST experiment broadens the range of populations and exchange rates over which Hoogsteen breathing can be effectively characterized.
Building on prior studies showing the utility of the SELOPE 1H RD experiment in measuring conformational exchange in unlabeled RNA (Schlagnitweit et al., 2018) and DNA (Furukawa et al., 2021; Dubini et al., 2020), our study establishes the utility of high-power 1H CEST SELOPE as a facile means for rapidly assessing the Watson–Crick to Hoogsteen exchange process in nucleic acids without the need for isotopic enrichment. The methodology is supported by the very good agreement observed between the measured exchange parameters and values measured independently using 13C and/or 15N R1ρ for a variety of bp's in three duplexes under different conditions of temperature and pH, as well as by the good agreement seen between the imino 1H chemical shifts and those expected based on duplexes containing Hoogsteen bp's as the dominant GS conformation. The high throughput nature of the experiment and simple sample requirements enabled us to measure Hoogsteen dynamics for 37 data points corresponding to 22 distinct bp's for three different pH conditions and seven different temperatures (Table S1), the largest collection of Hoogsteen dynamics from a single study to date. We envision using the 1H CEST SELOPE experiments to pre-screen DNA duplexes and to perform follow-up 13C and 15N RD experiments to confirm any interesting outliers, particularly regions showing substantially elevated Hoogsteen dynamics.
An important consideration when applying 1H CEST to the study of chemical exchange are contributions due to 1H–1H cross-relaxation originating from cross-relaxation, which may give rise to extraneous NOE dips that complicate data analysis (Yuwen et al., 2017a; Bouvignies and Kay, 2012; Eichmuller and Skrynnikov, 2005). These contributions have been shown to be significant in proteins particularly when characterizing slow exchange (kex < 200 s−1) necessitating use of relatively long relaxation delays (Bouvignies and Kay, 2012). Consistent with prior studies of nucleic acids (Schlagnitweit et al., 2018; Steiner et al., 2016; Baronti et al., 2020) and proteins (Lundstrom and Akke, 2005). Our results indicate that NOE effects from cross-relaxation between imino and non-imino protons can be effectively suppressed for DNA and RNA duplexes in the 1H CEST experiments through selective excitation provided that the relaxation delays are short on the order of 100 ms (Fig. 3b). However, care should be exercised to assess imino–imino NOE effects (Fig. 3b), which may also be more substantial for certain non-canonical motifs. Data should be discarded if the ES chemical shifts match those of nearby imino protons identified using 2D [1H, 1H] NOESY experiments or if the magnitude of the dip of interest varies substantially with or without selective excitation, as this could be an indication of NOE effect. Finally, we recommend independent verification of the exchange parameters with the use of other methods such as 13C and 15N experiments for motifs exhibiting highly unusual exchange parameters or ES 1H chemical shifts, and this can also help to confirm Hoogsteen bp's as the ES.
Prior studies showed that Watson–Crick to Hoogsteen bp transitions exhibit large variations in the forward rate constants (k1), while the backward rate constants (k−1) are relatively constant across different sequence contexts, consistent with a late transitional state (Alvey et al., 2014). We observe a similar trend in which k−1 varied < 5-fold, while k1 varied by ∼ 50-fold (Fig. S9). The 1H CEST data also revealed significantly lower Hoogsteen abundance (pES < 0.1 %) in addition to slower exchange kinetics (kex ∼ 1000 s−1) within A-tract motifs (Nikolova et al., 2011; Alvey et al., 2014) while also reinforcing prior data (Xu et al., 2018), suggesting increased exchange kinetics near terminal ends. Collectively, these data show that the Hoogsteen population can vary by as much as ∼ 14-fold, while kex can vary by ∼ 20-fold only due to changes in sequence and positional context (Table S1). These strong sequence and position dependencies could play important roles in biochemical processes acting on DNA.
A recent study (Furukawa et al., 2021) reported on-resonance imino 1H R1ρ RD for a guanine residue in a DNA duplex at pH = 7.5, T = 30 ∘C, and in 150 mM NaCl. Because off-resonance measurements were not performed, only kex ∼ 10 000 s−1 could be determined, while the values of Δω and pES were not determined. The study noted that a Hoogsteen bp as the ES was unlikely given that G–C+ Hoogsteen bp's are disfavored at pH = 7.5 and because the observed rate of exchange (kex ∼ 10 000 s−1) was much faster than is typically observed for Watson–Crick to Hoogsteen exchange. Instead, the data were interpreted as evidence for a base opened state. However, the observed rate of exchange kex ∼ 10 000 s−1 falls comfortably within the range of values measured here for Watson–Crick to Hoogsteen exchange using 1H CEST at similar pH conditions. For example, for the G10-C15 bp's in A6-DNA at the same temperature and pH = 6.8, kex for Watson–Crick to Hoogsteen exchange was ∼ 6000 s−1 (Fig. 4 and Table S1). Similar Watson–Crick to Hoogsteen exchange parameters (pES ∼ 0.05 % and kex ∼ 2000 s−1) were recently reported for this bp at 25 ∘C and pH 6.8 using cytosine amino 15N RD (Rangadurai et al., 2019a), and the ES ppm was shown to be in excellent agreement with values expected for a G–C+ Hoogsteen bp. In addition, based on hydrogen exchange measurements, pES ∼ 0.00001 % to 0.01 % and kex (kcl+kop, kcl and kop are the base closing and opening rate constant, respectively) ∼ 105 to 107 s−1 for the base-opened ES, and this process should fall outside RD detection (Gueron and Leroy, 1995; Gueron et al., 1987; Leroy et al., 1988; Leijon and Graslund, 1992; Snoussi and Leroy, 2001). Therefore, the ES detected by Furukawa et al. (2021) is more likely a Hoogsteen bp.
In conclusion, by obviating the need for isotopic enrichment, the 1H CEST experiment expands the scope of characterizing Watson–Crick to Hoogsteen exchange in nucleic acids by NMR. We are presently applying the experiment to map the sequence dependence of Hoogsteen breathing dynamics and systematically, how it varies with pH, salt and crowding, and following the introduction of lesions, mismatches and molecules that bind to the DNA.
4.1 Sample preparation
Unlabeled DNA and RNA oligonucleotides. Unmodified DNA oligonucleotides were purchased from Integrated DNA Technologies with standard desalting purification. RNA oligonucleotides were synthesized using a MerMade 6 Oligo Synthesizer employing 2′-tBDSilyl protected phosphoramidites (n-acetyl protected rC, rA and rG, and rU phosphoramidites were purchased from ChemGenes) and 1 µmol standard synthesis columns (1000 Å) (BioAutomation). RNA oligonucleotides were synthesized with the final 5′-protecting group, 4,4′-dimethoxytrityl (DMT) retained. RNA oligonucleotides were cleaved from columns using 1 mL AMA (1 : 1 ratio of 30 % ammonium hydroxide and 30 % methylamine) and incubated at room temperature for 2 h. The sample was then air-dried and dissolved in 115 µL DMSO, 60 µL TEA, and 75 µL TEA.3HF, and then incubated at T = 65 ∘C for 2.5 h to remove 2′-O protecting groups. The Glen-Pak RNA cartridges (Glen Research Corporation) were then used to purify the samples followed by ethanol precipitation.
Labeled DNA oligonucleotides. The uniformly 13C, 15N-labeled A6-DNA sample was prepared using chemically synthesized DNA (purchased from IDT), Klenow fragment DNA polymerase (New England Biolab) and 13C 15N isotopically labeled dNTPs (Silantes) using the Zimmer and Crothers method (Zimmer and Crothers, 1995). The oligonucleotide was purified using 20 % 29 : 1 polyacrylamide denaturing gel with 8 M urea, 20 mM Tris borate and 1 mM EDTA, and then using electro-elution (Whatman, GE Healthcare) in 40 mM Tris acetate and 1 mM EDTA, followed by ethanol precipitation.
Sample annealing and buffer exchange. DNA/RNA oligonucleotides were re-suspended in water (200–500 µM). To prepare duplex samples, equimolar amounts of the constituent single-stranded DNA/RNA samples were mixed and then heated at T = 95 ∘C for ∼ 5 min followed by cooling at room temperature for ∼ 1 h. All samples were exchanged three times into the desired buffer using centrifugal concentrators (4 mL, Millipore Sigma). A total of 10 % D2O (Millipore Sigma) was added to the samples prior to the NMR measurements.
Sample concentrations and buffer conditions. Unless mentioned otherwise, the NMR buffer contains 25 mM sodium chloride, 15 mM sodium phosphate, 0.1 mM EDTA and 10 % D2O. Sample concentrations and buffer pH are as follows: A6-DNA, 1.0 mM, pH 6.8; A2-DNA, 1.0 mM, pH 5.4; A5-DNA, 0.2 mM, pH 5.2; A6-RNA, 0.5 mM, pH 6.8. Concentration was estimated by measuring the absorbance of the sample at 260 nm and using extinction coefficients from the ADT Biol Oligo calculator (https://www.atdbio.com/tools/oligo-calculator, last access: 12 September 2021).
4.2 NMR spectroscopy
All NMR experiments were performed on a 600 Bruker Avance 3 spectrometer equipped with a triple-resonance HCN cryogenic probe. The NMR data were processed and analyzed with NMRPipe (Delaglio et al., 1995) and SPARKY (Thomas D. Goddard and Donald G. Kneller, SPARKY 3, University of California, San Francisco).
Resonance assignments. Imino resonances were assigned using a combination of 2D [1H, 1H] NOESY and [15N,1H] SOFAST-HMQC (Sathyamoorthy et al., 2014) experiments. Assignments for A6-DNA, A2-DNA and A6-RNA were reported previously (Sathyamoorthy et al., 2017; Zhou et al., 2016; Nikolova et al., 2011). The [1H, 1H] NOESY spectrum for A5-DNA is shown in Fig. S1.
1H CEST. The pulse sequence is shown in Fig. 1b and was adapted from Schlagnitweit et al. (2018). The g1 gradient (Fig. 1b) destroys transverse 1H magnetization prior to excitation of imino resonances. This helps to avoid any accidental offset dependence of the starting 1H magnetization. Relaxation delays TEX=100 ms were used for all 1H CEST measurements at low temperatures (5–30 ∘C), while a shorter TEX=80 ms was used for high (45 ∘C) temperature measurements. A longer TEX=400 ms was used to illustrate artifacts arising due to NOE dips (Fig. 3b). RF power and offset combinations used in the CEST measurements are given in Table S2. Calibration of RF field powers for the 1H CEST measurements was performed as described previously (Rangadurai et al., 2019b) using the same pulse sequence. Field inhomogeneity was also measured (Fig. S10) using the same sequence and the procedure as described previously (Guenneugues et al., 1999). 1H inhomogeneity was measured by performing on-resonance 1H CEST experiments on G2-H1 of A6-DNA, chosen as it does not experience conformational exchange. The longest relaxation delays used for the measurements were 10, 2, 1, 0.4, 0.1 and 0.04 s for RF fields 10, 50, 100, 200, 1000 and 4000 Hz, respectively. The resulting nutation curve was Fourier transformed and was fit to a Gaussian function (blue lines in Fig. S10) to extract the full width at half maximum, which was used for defining the inhomogeneity as described previously (Guenneugues et al., 1999). The selective pulse was set to be off (Fig. 3b) by replacing pulse a (Fig. 1b) with a non-selective 1H hard 90∘ pulse. A total of 16 scans were used for A6-DNA (1.0 mM) at 5, 10, 20, 25, 30 ∘C, and A2-DNA (1.0 mM) at 25 ∘C. A total of 32 scans were used for A6-RNA (0.5 mM) at 25 ∘C. A total of 64 scans were used for A5-DNA (0.2 mM) at 25 ∘C and for A6-DNA (1.0 mM) at 45 ∘C.
Fitting of 1H CEST data. When performing two-state CEST fitting with and without exchange, we restricted the offset to −6 to 6 ppm for the 1H CEST experiment with relaxation delay ≤ 100 ms and to −3 to 3 ppm for experiments with relaxation delay = 400 ms, to obviate any potential effects from 1H–1H cross-relaxation artifacts (Fig. 3b). Peak intensities of all imino protons in the 1D spectra as a function of RF power and offset frequency were extracted using NMRPipe (Delaglio et al., 1995). The peak intensity at a given RF power and offset is normalized by the average peak intensity over the triplicate CEST measurements with zero relaxation delay under the same RF power. The uncertainty in the measured peak intensity at each offset frequency and RF power combination was assumed to be equal to the standard deviation of the peak intensities for triplicate CEST experiments with zero relaxation delay under the same RF power (Zhao et al., 2014; Shi et al., 2019). CEST profiles were generated by plotting the normalized intensity as a function of offset , where ωobs is the Larmor frequency of the observed resonance and ωRF is the angular frequency of the applied RF field. RF field inhomogeneity (Fig. S10) was taken into account during CEST fitting as described previously (Rangadurai et al., 2020a). The normalized CEST profiles were then fit via numerical integration of the Bloch–McConnell (B–M) equations as described previously (Rangadurai et al., 2020a). Fitting of CEST profiles without exchange (Figs. 4, S2–S4) was performed by setting . Errors in exchange parameters were set to be equal to the fitting errors which were obtained as the square root of the diagonal elements of the covariance matrix. Reduced chi-square (rχ2) was calculated to assess the goodness of fit (Rangadurai et al., 2019b). Note that the variations in rχ2 values for different 1H CEST profiles in Fig. 4 and Fig. S2–4 are most likely due to differences in the quality of the NMR data and poor estimation of the real experimental uncertainty. The residual sum of squares (RSS) was computed as follows:
where and are the ith fit and experimentally measured intensity in the CEST profile respectively, and the summation is over all RF power and offset combinations (N).
Model selection for fits with and without exchange (Figs. 4, S2–S4) was performed by computing AIC and BIC weights as follows (Burnham and Anderson, 2004):
where K is the number of floating parameters when fitting, and are the differences between two AIC values (fitting without and with exchange). The AIC (wAIC+ex) and BIC (wBIC+ex) weights for fits with exchange are reported in Figs. 4 and S2–S4. The improvement in the fit was considered statistically significant if both wAIC+ex and wBIC+ex values are > 0.995, and rχ2 is reduced with the inclusion of exchange. For some resonances, the improvement in the fit with exchange is statistically significant, but the resulting exchange parameters are not reliable and have large errors (see Figs. S2, S3). For T4 in A5-DNA, pES=0.2 ± 0.1 % measured using 1H CEST was ∼ 10-fold smaller than pES=2.7 ± 1.5 % measured previously using 15N RD (Alvey et al., 2014), whereas kex (∼ 3000 s−1) was in good agreement. However, simulations show that due to the small Δω for 15N (∼ 1 ppm) and fast exchange kinetics kex (∼ 3000 s−1) the pES and Δω are not well-determined by the 15N RD data (Fig. S6c). For this reason, this data point was excluded for 1H CEST and 13C 15N RD comparison (Fig. 5a).
Off-resonance 13CR1ρ relaxation dispersion. 13C R1ρ experiments were performed using 1D R1ρ schemes as described previously (Nikolova et al., 2012a, 2011; Hansen et al., 2009). The spin-lock powers and offsets are listed in Table S3. The spin-lock was applied for a maximal duration < 60 ms to achieve ∼ 70 % loss of peak intensity at the end of relaxation delay. Off-resonance R1ρ profiles (Fig. S8) were generated by plotting , where θ is the angle between the effective field of the observed resonance and the z axis, as a function of , where , where ωobs is the Larmor frequency of the spin and ωRF is the carrier frequency of the applied spin-lock.
Fitting of 13CR1ρ data. One-dimensional peak intensities were measured using NMRPipe (Delaglio et al., 1995). R1ρ values for a given spin-lock power and offset were calculated by fitting the intensities as a function of delay time to a mono-exponential decay (Kimsey et al., 2015). A Monte Carlo approach was used to calculate the uncertainties of R1ρ (Bothe et al., 2014). Alignment of initial magnetization during the Bloch–McConnell fitting was performed based on the value (Rangadurai et al., 2019b). Chemical exchange parameters were obtained by fitting experimental R1ρ values to numerical solutions of a two-state Bloch–McConnell (B–M) equations (Mcconnell, 1958). A Monte Carlo approach was used to calculate the errors of exchange parameters (Bothe et al., 2014) . Reduced chi-square (rχ2) was calculated to assess the goodness of fit (Rangadurai et al., 2019b).
4.3 Thermodynamic Analysis
The observed temperature dependence of k1, k−1 for the Watson–Crick to Hoogsteen exchange measuring using 1H CEST was fit to a modified van 't Hoff equation that accounts for statistical compensation effects and assumes a smooth energy surface as described previously (Nikolova et al., 2011; Coman and Russu, 2005):
ki (i = 1, −1) is the forward and backward rate constants, and and are the free energy (at temperature T, in kelvin) and enthalpy of activation (i = 1) or deactivation (i = −1) respectively. R is the universal gas constant (kcal mol−1 K−1) and Thm is the harmonic mean of the experimental temperatures (Ti in K) computed as , kB is the Boltzmann's constant (J K−1), κ is the transmission coefficient (assumed to be unity), and h is the Planck constant (J s).
The goodness-of-fit indicator R2 (coefficient of determination) (Fig. S6) between the measured and fitted rate constants was calculated as follows: , , . ki,fit and ki,exp (i = 1, −1) are fitted and experimentally measured rate constants. is the mean of all ki,exp. Errors of fitting for and were calculated as the square root of the diagonal elements of the covariance matrix. is calculated as .
The data that support this study are contained in the published article (Tables S1–S3) or are available from the corresponding author on reasonable request. The Python scripts for 1H CEST data fitting are available at https://github.com/alhashimilab/1H-CEST (last access: 12 September 2021) (DOI: https://doi.org/10.5281/zenodo.5502219, Liu et al., 2021b).
The supplement related to this article is available online at: https://doi.org/10.5194/mr-2-715-2021-supplement.
BL, AR and HMAH conceived the project and experimental design. BL, AR and HS prepared the samples and set up the imino 1H CEST experiment. BL performed 1H CEST experiments and data analysis. HS performed 13C R1ρ experiments. HMAH, BL and AR wrote the manuscript with critical input from HS.
Hashim M. Al-Hashimi is a member of the editorial board of Magnetic Resonance.
Publisher’s note: Copernicus Publications remains neutral with regard to jurisdictional claims in published maps and institutional affiliations.
This article is part of the special issue “Geoffrey Bodenhausen Festschrift”. It is not associated with a conference.
We thank Katja Petzold for sharing the 1H CEST pulse sequence. We thank Or Szekely for general input and Ainan Geng for help with the 1H inhomogeneity measurements.
This research has been supported by the National Institutes of Health (grant no. R01GM089846).
This paper was edited by Fabien Ferrage and reviewed by two anonymous referees.
Afek, A., Shi, H., Rangadurai, A., Sahay, H., Senitzki, A., Xhani, S., Fang, M., Salinas, R., Mielko, Z., Pufall, M. A., Poon, G. M. K., Haran, T. E., Schumacher, M. A., Al-Hashimi, H. M., and Gordan, R.: DNA mismatches reveal conformational penalties in protein-DNA recognition, Nature, 587, 291–296, https://doi.org/10.1038/s41586-020-2843-2, 2020.
Aishima, J., Gitti, R. K., Noah, J. E., Gan, H. H., Schlick, T., and Wolberger, C.: A Hoogsteen base pair embedded in undistorted B-DNA, Nucleic Acids Res., 30, 5244–5252, 2002.
Alvey, H. S., Gottardo, F. L., Nikolova, E. N., and Al-Hashimi, H. M.: Widespread transient Hoogsteen base pairs in canonical duplex DNA with variable energetics, Nat. Commun., 5, 4786, https://doi.org/10.1038/ncomms5786, 2014.
Baronti, L., Guzzetti, I., Ebrahimi, P., Friebe Sandoz, S., Steiner, E., Schlagnitweit, J., Fromm, B., Silva, L., Fontana, C., Chen, A. A., and Petzold, K.: Base-pair conformational switch modulates miR-34a targeting of Sirt1 mRNA, Nature, 583, 139–144, https://doi.org/10.1038/s41586-020-2336-3, 2020.
Ben Imeddourene, A., Zargarian, L., Buckle, M., Hartmann, B., and Mauffret, O.: Slow motions in A.T rich DNA sequence, Sci. Rep., 10, 19005, https://doi.org/10.1038/s41598-020-75645-x, 2020.
Bothe, J. R., Stein, Z. W., and Al-Hashimi, H. M.: Evaluating the uncertainty in exchange parameters determined from off-resonance R1rho relaxation dispersion for systems in fast exchange, J. Magn. Reson., 244, 18–29, https://doi.org/10.1016/j.jmr.2014.04.010, 2014.
Bouvignies, G. and Kay, L. E.: Measurement of proton chemical shifts in invisible states of slowly exchanging protein systems by chemical exchange saturation transfer, J. Phys. Chem. B, 116, 14311–14317, https://doi.org/10.1021/jp311109u, 2012.
Burnham, K. P. and Anderson, D. R.: Multimodel inference – understanding AIC and BIC in model selection, Sociol. Method. Res., 33, 261–304, https://doi.org/10.1177/0049124104268644, 2004.
Chen, B., LeBlanc, R., and Dayie, T. K.: SAM-II Riboswitch Samples at least Two Conformations in Solution in the Absence of Ligand: Implications for Recognition, Angew. Chem. Int. Edit., 55, 2724–2727, https://doi.org/10.1002/anie.201509997, 2016.
Coman, D. and Russu, I. M.: A nuclear magnetic resonance investigation of the energetics of basepair opening pathways in DNA, Biophys. J., 89, 3285–3292, https://doi.org/10.1529/biophysj.105.065763, 2005.
Czernek, J., Fiala, R., and Sklenar, V.: Hydrogen bonding effects on the (15)N and (1)H shielding tensors in nucleic acid base pairs, J. Magn. Reson., 145, 142–146, https://doi.org/10.1006/jmre.2000.2091, 2000.
Delaglio, F., Grzesiek, S., Vuister, G. W., Zhu, G., Pfeifer, J., and Bax, A.: NMRPipe: a multidimensional spectral processing system based on UNIX pipes, J. Biomol. NMR, 6, 277–293, https://doi.org/10.1007/BF00197809, 1995.
Dubini, R. C. A., Schon, A., Muller, M., Carell, T., and Rovo, P.: Impact of 5-formylcytosine on the melting kinetics of DNA by 1H NMR chemical exchange, Nucleic Acids Res., 48, 8796–8807, https://doi.org/10.1093/nar/gkaa589, 2020.
Eichmuller, C. and Skrynnikov, N. R.: A new amide proton R1rho experiment permits accurate characterization of microsecond time-scale conformational exchange, J. Biomol. NMR, 32, 281–293, https://doi.org/10.1007/s10858-005-0658-y, 2005.
Felsenfeld, G., Davies, D. R., and Rich, A.: Formation of a 3-Stranded Polynucleotide Molecule, J. Am. Chem. Soc., 79, 2023–2024, https://doi.org/10.1021/ja01565a074, 1957.
Frank, A. T., Horowitz, S., Andricioaei, I., and Al-Hashimi, H. M.: Utility of 1H NMR chemical shifts in determining RNA structure and dynamics, J. Phys. Chem. B, 117, 2045–2052, https://doi.org/10.1021/jp310863c, 2013.
Furukawa, A., Walinda, E., Arita, K., and Sugase, K.: Structural dynamics of double-stranded DNA with epigenome modification, Nucleic Acids Res., 49, 1152–1162, https://doi.org/10.1093/nar/gkaa1210, 2021.
Golovenko, D., Brauning, B., Vyas, P., Haran, T. E., Rozenberg, H., and Shakked, Z.: New Insights into the Role of DNA Shape on Its Recognition by p53 Proteins, Structure, 26, 1237–1250 e1236, https://doi.org/10.1016/j.str.2018.06.006, 2018.
Guenneugues, M., Berthault, P., and Desvaux, H.: A method for determining B1 field inhomogeneity. Are the biases assumed in heteronuclear relaxation experiments usually underestimated?, J. Magn. Reson., 136, 118–126, https://doi.org/10.1006/jmre.1998.1590, 1999.
Gueron, M. and Leroy, J. L.: Studies of base pair kinetics by NMR measurement of proton exchange, Methods Enzymol., 261, 383–413, https://doi.org/10.1016/s0076-6879(95)61018-9, 1995.
Gueron, M., Kochoyan, M., and Leroy, J. L.: A single mode of DNA base-pair opening drives imino proton exchange, Nature, 328, 89–92, https://doi.org/10.1038/328089a0, 1987.
Hansen, A. L., Nikolova, E. N., Casiano-Negroni, A., and Al-Hashimi, H. M.: Extending the range of microsecond-to-millisecond chemical exchange detected in labeled and unlabeled nucleic acids by selective carbon R(1rho) NMR spectroscopy, J. Am. Chem. Soc., 131, 3818–3819, https://doi.org/10.1021/ja8091399, 2009.
Hansen, A. L., Lundstrom, P., Velyvis, A., and Kay, L. E.: Quantifying millisecond exchange dynamics in proteins by CPMG relaxation dispersion NMR using side-chain 1H probes, J. Am. Chem. Soc., 134, 3178–3189, https://doi.org/10.1021/ja210711v, 2012.
Hoogsteen, K.: The Structure of Crystals Containing a Hydrogen-Bonded Complex of 1-Methylthymine and 9-Methyladenine, Acta Crystallogr., 12, 822–823, https://doi.org/10.1107/S0365110x59002389, 1959.
Hwang, T. L. and Shaka, A. J.: Water Suppression That Works – Excitation Sculpting Using Arbitrary Wave-Forms and Pulsed-Field Gradients, J. Magn. Reson. Ser. A, 112, 275–279, https://doi.org/10.1006/jmra.1995.1047, 1995.
Ishima, R. and Torchia, D. A.: Extending the range of amide proton relaxation dispersion experiments in proteins using a constant-time relaxation-compensated CPMG approach, J. Biomol. NMR, 25, 243–248, https://doi.org/10.1023/a:1022851228405, 2003.
Ishima, R., Wingfield, P. T., Stahl, S. J., Kaufman, J. D., and Torchia, D. A.: Using amide H-1 and N-15 transverse relaxation to detect millisecond time-scale motions in perdeuterated proteins: Application to HIV-1 protease, J. Am. Chem. Soc., 120, 10534–10542, https://doi.org/10.1021/ja981546c, 1998.
Juen, M. A., Wunderlich, C. H., Nussbaumer, F., Tollinger, M., Kontaxis, G., Konrat, R., Hansen, D. F., and Kreutz, C.: Excited States of Nucleic Acids Probed by Proton Relaxation Dispersion NMR Spectroscopy, Angew. Chem. Int. Ed. Engl., 55, 12008–12012, https://doi.org/10.1002/anie.201605870, 2016.
Kimsey, I. J., Petzold, K., Sathyamoorthy, B., Stein, Z. W., and Al-Hashimi, H. M.: Visualizing transient Watson-Crick-like mispairs in DNA and RNA duplexes, Nature, 519, 315–320, https://doi.org/10.1038/nature14227, 2015.
Kimsey, I. J., Szymanski, E. S., Zahurancik, W. J., Shakya, A., Xue, Y., Chu, C. C., Sathyamoorthy, B., Suo, Z., and Al-Hashimi, H. M.: Dynamic basis for dG*dT misincorporation via tautomerization and ionization, Nature, 554, 195–201, https://doi.org/10.1038/nature25487, 2018.
Kitayner, M., Rozenberg, H., Rohs, R., Suad, O., Rabinovich, D., Honig, B., and Shakked, Z.: Diversity in DNA recognition by p53 revealed by crystal structures with Hoogsteen base pairs, Nat. Struct. Mol. Biol., 17, 423–429, https://doi.org/10.1038/nsmb.1800, 2010.
Lam, S. L. and Chi, L. M.: Use of chemical shifts for structural studies of nucleic acids, Prog. Nucl. Magn. Reson. Spectrosc., 56, 289–310, https://doi.org/10.1016/j.pnmrs.2010.01.002, 2010.
Lane, A. N., Bauer, C. J., and Frenkiel, T. A.: Determination of conformational transition rates in the trp promoter by 1H NMR rotating-frame T1 and cross-relaxation rate measurements, Eur. Biophys. J., 21, 425–431, https://doi.org/10.1007/BF00185870, 1993.
LeBlanc, R. M., Longhini, A. P., Tugarinov, V., and Dayie, T. K.: NMR probing of invisible excited states using selectively labeled RNAs, J. Biomol. NMR, 71, 165–172, https://doi.org/10.1007/s10858-018-0184-3, 2018.
Leijon, M. and Graslund, A.: Effects of sequence and length on imino proton exchange and base pair opening kinetics in DNA oligonucleotide duplexes, Nucleic Acids Res., 20, 5339–5343, https://doi.org/10.1093/nar/20.20.5339, 1992.
Leroy, J. L., Kochoyan, M., Huynh-Dinh, T., and Gueron, M.: Characterization of base-pair opening in deoxynucleotide duplexes using catalyzed exchange of the imino proton, J. Mol. Biol., 200, 223–238, https://doi.org/10.1016/0022-2836(88)90236-7, 1988.
Ling, H., Boudsocq, F., Plosky, B. S., Woodgate, R., and Yang, W.: Replication of a cis-syn thymine dimer at atomic resolution, Nature, 424, 1083–1087, https://doi.org/10.1038/nature01919, 2003.
Liu, B., Shi, H., Rangadurai, A., Nussbaumer, F., Chu, C.-C., Erharter, K. A., Case, D. A., Kreutz, C., and Al-Hashimi, H. M.: A quantitative model predicts how m6A reshapes the kinetic landscape of nucleic acid hybridization and conformational transitions, Nat. Commun., 12, 5201, https://doi.org/10.1038/s41467-021-25253-8, 2021a.
Liu, B., Rangadurai, A., Shi, H., and Al-Hashimi, H.: Rapid measurement of Watson-Crick to Hoogsteen exchange in unlabeled DNA duplexes using high-power SELOPE imino 1H CEST, Bei-1205/1H-CEST, Zenodo [data set], https://doi.org/10.5281/zenodo.5502219, 2021b.
Lu, L., Yi, C., Jian, X., Zheng, G., and He, C.: Structure determination of DNA methylation lesions N1-meA and N3-meC in duplex DNA using a cross-linked protein-DNA system, Nucleic Acids Res., 38, 4415–4425, https://doi.org/10.1093/nar/gkq129, 2010.
Lundstrom, P. and Akke, M.: Off-resonance rotating-frame amide proton spin relaxation experiments measuring microsecond chemical exchange in proteins, J. Biomol. NMR, 32, 163–173, https://doi.org/10.1007/s10858-005-5027-3, 2005.
Lundstrom, P., Hansen, D. F., Vallurupalli, P., and Kay, L. E.: Accurate measurement of alpha proton chemical shifts of excited protein states by relaxation dispersion NMR spectroscopy, J. Am. Chem. Soc., 131, 1915–1926, https://doi.org/10.1021/ja807796a, 2009.
Mcconnell, H. M.: Reaction Rates by Nuclear Magnetic Resonance, J. Chem. Phys., 28, 430–431, https://doi.org/10.1063/1.1744152, 1958.
Nair, D. T., Johnson, R. E., Prakash, L., Prakash, S., and Aggarwal, A. K.: Hoogsteen base pair formation promotes synthesis opposite the 1,N6-ethenodeoxyadenosine lesion by human DNA polymerase iota, Nat. Struct. Mol. Biol., 13, 619–625, https://doi.org/10.1038/nsmb1118, 2006.
Nikolova, E. N., Kim, E., Wise, A. A., O'Brien, P. J., Andricioaei, I., and Al-Hashimi, H. M.: Transient Hoogsteen base pairs in canonical duplex DNA, Nature, 470, 498–502, https://doi.org/10.1038/nature09775, 2011.
Nikolova, E. N., Gottardo, F. L., and Al-Hashimi, H. M.: Probing transient Hoogsteen hydrogen bonds in canonical duplex DNA using NMR relaxation dispersion and single-atom substitution, J. Am. Chem. Soc., 134, 3667–3670, https://doi.org/10.1021/ja2117816, 2012a.
Nikolova, E. N., Bascom, G. D., Andricioaei, I., and Al-Hashimi, H. M.: Probing Sequence-Specific DNA Flexibility in A-Tracts and Pyrimidine-Purine Steps by Nuclear Magnetic Resonance C-13 Relaxation and Molecular Dynamics Simulations, Biochemistry, 51, 8654–8664, https://doi.org/10.1021/bi3009517, 2012b.
Nikolova, E. N., Goh, G. B., Brooks, C. L., 3rd, and Al-Hashimi, H. M.: Characterizing the protonation state of cytosine in transient G.C Hoogsteen base pairs in duplex DNA, J. Am. Chem. Soc., 135, 6766–6769, https://doi.org/10.1021/ja400994e, 2013a.
Nikolova, E. N., Zhou, H., Gottardo, F. L., Alvey, H. S., Kimsey, I. J., and Al-Hashimi, H. M.: A historical account of Hoogsteen base-pairs in duplex DNA, Biopolymers, 99, 955–968, https://doi.org/10.1002/bip.22334, 2013b.
Otten, R., Villali, J., Kern, D., and Mulder, F. A.: Probing microsecond time scale dynamics in proteins by methyl (1)H Carr-Purcell-Meiboom-Gill relaxation dispersion NMR measurements. Application to activation of the signaling protein NtrC(r), J. Am. Chem. Soc., 132, 17004–17014, https://doi.org/10.1021/ja107410x, 2010.
Palmer III, A. G.: Chemical exchange in biomacromolecules: past, present, and future, J. Magn. Reson., 241, 3–17, https://doi.org/10.1016/j.jmr.2014.01.008, 2014.
Rangadurai, A., Zhou, H., Merriman, D. K., Meiser, N., Liu, B., Shi, H., Szymanski, E. S., and Al-Hashimi, H. M.: Why are Hoogsteen base pairs energetically disfavored in A-RNA compared to B-DNA?, Nucleic Acids Res., 46, 11099–11114, https://doi.org/10.1093/nar/gky885, 2018.
Rangadurai, A., Kremser, J., Shi, H., Kreutz, C., and Al-Hashimi, H. M.: Direct evidence for (G)O6H2-N4(C)(+) hydrogen bonding in transient G(syn)-C(+) and G(syn)-m(5)C(+) Hoogsteen base pairs in duplex DNA from cytosine amino nitrogen off-resonance R1rho relaxation dispersion measurements, J. Magn. Reson., 308, 106589, https://doi.org/10.1016/j.jmr.2019.106589, 2019a.
Rangadurai, A., Szymaski, E. S., Kimsey, I. J., Shi, H., and Al-Hashimi, H. M.: Characterizing micro-to-millisecond chemical exchange in nucleic acids using off-resonance R1rh-o relaxation dispersion, Prog. Nucl. Magn. Reson. Spectrosc., 112–113, 55-102, https://doi.org/10.1016/j.pnmrs.2019.05.002, 2019b.
Rangadurai, A., Shi, H., and Al-Hashimi, H. M.: Extending the Sensitivity of CEST NMR Spectroscopy to Micro-to-Millisecond Dynamics in Nucleic Acids Using High-Power Radio-Frequency Fields, Angew. Chem. Int. Ed. Engl., 59, 11262–11266, https://doi.org/10.1002/anie.202000493, 2020a.
Rangadurai, A., Shi, H., Xu, Y., Liu, B., Abou Assi, H., Zhou, H., Kimsey, I., and Al-Hashimi, H.: delta-Melt: Nucleic acid conformational penalties from melting experiments, bioRxiv, https://doi.org/10.1101/2020.12.26.424438, 2020b.
Sathyamoorthy, B., Lee, J., Kimsey, I., Ganser, L. R., and Al-Hashimi, H.: Development and application of aromatic [(13)C, (1)H] SOFAST-HMQC NMR experiment for nucleic acids, J. Biomol. NMR, 60, 77–83, https://doi.org/10.1007/s10858-014-9856-9, 2014.
Sathyamoorthy, B., Shi, H., Zhou, H., Xue, Y., Rangadurai, A., Merriman, D. K., and Al-Hashimi, H. M.: Insights into Watson-Crick/Hoogsteen breathing dynamics and damage repair from the solution structure and dynamic ensemble of DNA duplexes containing m1A, Nucleic Acids Res., 45, 5586–5601, https://doi.org/10.1093/nar/gkx186, 2017.
Schlagnitweit, J., Steiner, E., Karlsson, H., and Petzold, K.: Efficient Detection of Structure and Dynamics in Unlabeled RNAs: The SELOPE Approach, Chemistry, 24, 6067–6070, https://doi.org/10.1002/chem.201800992, 2018.
Schnieders, R., Wolter, A. C., Richter, C., Wohnert, J., Schwalbe, H., and Furtig, B.: Novel (13) C-detected NMR Experiments for the Precise Detection of RNA Structure, Angew. Chem. Int. Ed. Engl., 58, 9140–9144, https://doi.org/10.1002/anie.201904057, 2019.
Sekhar, A., Rosenzweig, R., Bouvignies, G., and Kay, L. E.: Hsp70 biases the folding pathways of client proteins, Proc. Natl. Acad. Sci. USA, 113, 2794–2801, https://doi.org/10.1073/pnas.1601846113, 2016.
Shi, H., Clay, M. C., Rangadurai, A., Sathyamoorthy, B., Case, D. A., and Al-Hashimi, H. M.: Atomic structures of excited state A-T Hoogsteen base pairs in duplex DNA by combining NMR relaxation dispersion, mutagenesis, and chemical shift calculations, J. Biomol. NMR, 70, 229–244, https://doi.org/10.1007/s10858-018-0177-2, 2018.
Shi, H., Liu, B., Nussbaumer, F., Rangadurai, A., Kreutz, C., and Al-Hashimi, H. M.: NMR Chemical Exchange Measurements Reveal That N(6)-Methyladenosine Slows RNA Annealing, J. Am. Chem. Soc., 141, 19988–19993, https://doi.org/10.1021/jacs.9b10939, 2019.
Shi, H., Kimsey, I., Liu, H., Pham, U., Schumacher, M. A., and Al-Hashimi, H.: Revealing A-T and G-C Hoogsteen base pairs in stressed protein-bound duplex DNA, bioRxiv, https://doi.org/10.1101/2021.06.05.447203, 2021.
Singh, U. S., Moe, J. G., Reddy, G. R., Weisenseel, J. P., Marnett, L. J., and Stone, M. P.: 1H NMR of an oligodeoxynucleotide containing a propanodeoxyguanosine adduct positioned in a (CG)3 frameshift hotspot of Salmonella typhimurium hisD3052: Hoogsteen base-pairing at pH 5.8, Chem. Res. Toxicol., 6, 825–836, https://doi.org/10.1021/tx00036a012, 1993.
Smith, C. A., Ban, D., Pratihar, S., Giller, K., Schwiegk, C., de Groot, B. L., Becker, S., Griesinger, C., and Lee, D.: Population shuffling of protein conformations, Angew. Chem. Int. Ed. Engl., 54, 207–210, https://doi.org/10.1002/anie.201408890, 2015.
Snoussi, K. and Leroy, J. L.: Imino proton exchange and base-pair kinetics in RNA duplexes, Biochemistry, 40, 8898–8904, https://doi.org/10.1021/bi010385d, 2001.
Sripakdeevong, P., Cevec, M., Chang, A. T., Erat, M. C., Ziegeler, M., Zhao, Q., Fox, G. E., Gao, X., Kennedy, S. D., Kierzek, R., Nikonowicz, E. P., Schwalbe, H., Sigel, R. K., Turner, D. H., and Das, R.: Structure determination of noncanonical RNA motifs guided by (1)H NMR chemical shifts, Nat. Methods, 11, 413–416, https://doi.org/10.1038/nmeth.2876, 2014.
Steiner, E., Schlagnitweit, J., Lundstrom, P., and Petzold, K.: Capturing Excited States in the Fast-Intermediate Exchange Limit in Biological Systems Using (HNMR)-H-1 Spectroscopy, Angew. Chem. Int. Edit., 55, 15869–15872, https://doi.org/10.1002/anie.201609102, 2016.
Stelling, A. L., Xu, Y., Zhou, H., Choi, S. H., Clay, M. C., Merriman, D. K., and Al-Hashimi, H. M.: Robust IR-based detection of stable and fractionally populated G-C(+) and A-T Hoogsteen base pairs in duplex DNA, FEBS Lett., 591, 1770–1784, https://doi.org/10.1002/1873-3468.12681, 2017.
Swails, J., Zhu, T., He, X., and Case, D. A.: AFNMR: automated fragmentation quantum mechanical calculation of NMR chemical shifts for biomolecules, J. Biomol. NMR, 63, 125–139, https://doi.org/10.1007/s10858-015-9970-3, 2015.
Tateishi-Karimata, H., Nakano, M., and Sugimoto, N.: Comparable stability of Hoogsteen and Watson-Crick base pairs in ionic liquid choline dihydrogen phosphate, Sci. Rep., 4, 3593, https://doi.org/10.1038/srep03593, 2014.
Ughetto, G., Wang, A. H., Quigley, G. J., van der Marel, G. A., van Boom, J. H., and Rich, A.: A comparison of the structure of echinomycin and triostin A complexed to a DNA fragment, Nucleic Acids Res., 13, 2305–2323, https://doi.org/10.1093/nar/13.7.2305, 1985.
Wang, A. H., Ughetto, G., Quigley, G. J., Hakoshima, T., van der Marel, G. A., van Boom, J. H., and Rich, A.: The molecular structure of a DNA-triostin A complex, Science, 225, 1115–1121, https://doi.org/10.1126/science.6474168, 1984.
Wang, S., Song, Y., Wang, Y., Li, X., Fu, B., Liu, Y., Wang, J., Wei, L., Tian, T., and Zhou, X.: The m(6)A methylation perturbs the Hoogsteen pairing-guided incorporation of an oxidized nucleotide, Chem. Sci., 8, 6380–6388, https://doi.org/10.1039/c7sc02340e, 2017.
Wang, Y., Han, G., Jiang, X., Yuwen, T., and Xue, Y.: Chemical shift prediction of RNA imino groups: application toward characterizing RNA excited states, Nat. Commun., 12, 1595, https://doi.org/10.1038/s41467-021-21840-x, 2021.
Wang, Y. S. and Ikuta, S.: Proton on-Resonance Rotating Frame Spin-Lattice Relaxation Measurements of B and Z Double-Helical Oligodeoxyribonucleotides in Solution, J. Am. Chem. Soc., 111, 1243–1248, https://doi.org/10.1021/ja00186a013, 1989.
Weininger, U., Liu, Z., McIntyre, D. D., Vogel, H. J., and Akke, M.: Specific 12CbetaD(2)12CgammaD(2)S13CepsilonHD(2) isotopomer labeling of methionine to characterize protein dynamics by 1H and 13C NMR relaxation dispersion, J. Am. Chem. Soc., 134, 18562–18565, https://doi.org/10.1021/ja309294u, 2012.
Weininger, U., Blissing, A. T., Hennig, J., Ahlner, A., Liu, Z., Vogel, H. J., Akke, M., and Lundstrom, P.: Protein conformational exchange measured by 1H R1rho relaxation dispersion of methyl groups, J. Biomol. NMR, 57, 47–55, https://doi.org/10.1007/s10858-013-9764-4, 2013.
Xu, Y., McSally, J., Andricioaei, I., and Al-Hashimi, H. M.: Modulation of Hoogsteen dynamics on DNA recognition, Nat. Commun., 9, 1473, https://doi.org/10.1038/s41467-018-03516-1, 2018.
Xu, Y., Manghrani, A., Liu, B., Shi, H., Pham, U., Liu, A., and Al-Hashimi, H. M.: Hoogsteen base pairs increase the susceptibility of double-stranded DNA to cytotoxic damage, J. Biol. Chem., 295, 15933–15947, https://doi.org/10.1074/jbc.RA120.014530, 2020.
Yamazaki, T., Muhandiram, R., and Kay, L. E.: NMR Experiments for the Measurement of Carbon Relaxation Properties in Highly Enriched, Uniformly 13C,15N-Labeled Proteins: Application to 13C.alpha. Carbons, J. Am. Chem. Soc., 116, 8266–8278, https://doi.org/10.1021/ja00097a037, 1994.
Yuwen, T., Sekhar, A., and Kay, L. E.: Separating Dipolar and Chemical Exchange Magnetization Transfer Processes in (1) H-CEST, Angew. Chem. Int. Ed. Engl., 56, 6122–6125, https://doi.org/10.1002/anie.201610759, 2017a.
Yuwen, T. R., Huang, R., and Kay, L. E.: Probing slow timescale dynamics in proteins using methyl H-1 CEST, J. Biomol. NMR, 68, 215–224, https://doi.org/10.1007/s10858-017-0121-x, 2017b.
Zhao, B., Hansen, A. L., and Zhang, Q.: Characterizing slow chemical exchange in nucleic acids by carbon CEST and low spin-lock field R(1rho) NMR spectroscopy, J. Am. Chem. Soc., 136, 20–23, https://doi.org/10.1021/ja409835y, 2014.
Zhou, H., Kimsey, I. J., Nikolova, E. N., Sathyamoorthy, B., Grazioli, G., McSally, J., Bai, T., Wunderlich, C. H., Kreutz, C., Andricioaei, I., and Al-Hashimi, H. M.: m(1)A and m(1)G disrupt A-RNA structure through the intrinsic instability of Hoogsteen base pairs, Nat. Struct. Mol. Biol., 23, 803–810, https://doi.org/10.1038/nsmb.3270, 2016.
Zhou, H., Sathyamoorthy, B., Stelling, A., Xu, Y., Xue, Y., Pigli, Y. Z., Case, D. A., Rice, P. A., and Al-Hashimi, H. M.: Characterizing Watson-Crick versus Hoogsteen Base Pairing in a DNA-Protein Complex Using Nuclear Magnetic Resonance and Site-Specifically (13)C- and (15)N-Labeled DNA, Biochemistry, 58, 1963–1974, https://doi.org/10.1021/acs.biochem.9b00027, 2019.
Zimmer, D. P. and Crothers, D. M.: NMR of enzymatically synthesized uniformly 13C15N-labeled DNA oligonucleotides, Proc. Natl. Acad. Sci. USA, 92, 3091–3095, https://doi.org/10.1073/pnas.92.8.3091, 1995.