the Creative Commons Attribution 4.0 License.
the Creative Commons Attribution 4.0 License.
 | 06 Oct 2021
Signal-to-noise ratio in diffusion-ordered spectroscopy: how good is good enough?
Jamie Guest
Peter Kiraly
Mathias Nilsson
Gareth A. Morris
Diffusion-ordered NMR spectroscopy (DOSY) constructs multidimensional spectra displaying signal strength as a function of Larmor frequency and of diffusion coefficient from experimental measurements using pulsed field gradient spin or stimulated echoes. Peak positions in the diffusion domain are determined by diffusion coefficients estimated by fitting experimental data to some variant of the Stejskal–Tanner equation, with the peak widths determined by the standard error estimated in the fitting process. The accuracy and reliability of the diffusion domain in DOSY spectra are therefore determined by the uncertainties in the experimental data and thus in part by the signal-to-noise ratio of the experimental spectra measured. Here the Cramér–Rao lower bound, Monte Carlo methods, and experimental data are used to investigate the relationship between signal-to-noise ratio, experimental parameters, and diffusion domain accuracy in 2D DOSY experiments. Experimental results confirm that sources of error other than noise put an upper limit on the improvement in diffusion domain accuracy obtainable by time averaging.
- Article
(622 KB) - Full-text XML
- BibTeX
- EndNote


The utility of pulsed field gradient spin or stimulated echo (PFGSE) experiments for distinguishing between the NMR signals of different species was first pointed out by Stilbs (Stilbs, 1981), but practical applications of this principle only became common with the introduction of diffusion-ordered spectroscopy (DOSY) by Morris and Johnson (1992). In DOSY (Johnson, 1999; Morris, 2007), a pseudo-2D (or higher-dimensional) spectrum is synthesized in which the signals of an NMR spectrum are dispersed into an extra dimension according to the estimated diffusion coefficient D. This is obtained by fitting experimental measurements of signal attenuation as a function of pulsed field gradient amplitude to a theoretical model, usually some variation on the Stejskal–Tanner equation (Stejskal and Tanner, 1965; Sinnaeve, 2012). The value added by the DOSY approach over simple PFGSE measurements is that since all signals from spins within a given species should show the same diffusion, in favourable cases cross sections through the DOSY spectrum at different D values give separate spectra – which can be interpreted just as normal 1D spectra – for each of the components of a mixture. This paper examines the impact of one crucial determinant of the success or failure of a DOSY experiment, the signal-to-noise ratio (SNR) of the experimental data.
One common analogy is that DOSY is akin to performing chromatography within an NMR tube, separating spectra rather than physically separating analytes. The name DOSY is, however, misleading in some respects. In conventional 2D NMR methods such as COSY, NOESY, and TOCSY, the 2D spectrum can be obtained by direct Fourier transformation of signals that are phase or amplitude modulated as a function of an evolution period t1. The frequency F1 at which a given signal appears is determined directly by the frequency of evolution in t1: while the phase or amplitude of a signal may behave unexpectedly, the frequency is determined directly by the quantum mechanics, so signals should always appear at the “correct” frequency. In pseudo-2D methods such as DOSY (and relaxation-based analogues, often referred to as relaxation-ordered spectroscopy, ROSY; Lupulescu et al., 2003; Gilard et al., 2008; Nishiyama et al., 2010; Dal Poggetto et al., 2017), this is not the case: the diffusion dimension is a statistical construct, and the positions of signals in the diffusion dimension are scattered about the true D values. When a DOSY spectrum is constructed, peaks in the diffusion domain are conventionally given Gaussian shapes with widths that reflect the uncertainty in D estimated from the fitting statistics. Thus, in COSY spectra, peaks with the same chemical shift are exactly aligned; in DOSY spectra, peaks with the same diffusion coefficient have Gaussian shapes that should overlap but are not coincident. This is just one reason why the interpretation of DOSY spectra demands more of the spectroscopist's skill and judgment than most other types of NMR spectrum; others include the effects of signal overlap and of systematic errors introduced by imperfect experiments.
In simple mixtures in which the NMR signals are well resolved and the individual species have very different diffusion coefficients, even a crude DOSY experiment will work well. Where species of similar size, and hence similar D, are to be resolved, however, high-quality experimental data are essential. One of the key determinants of the utility of a DOSY spectrum is its diffusion resolution, the minimum difference in D that can safely be distinguished. In an ideal experiment, this is determined by the signal-to-noise ratio of the experimental data. Here we use theory, empiricism and simulated and experimental data to answer some key questions. How good do our experimental data need to be to resolve a given difference in D? How is the uncertainty in D related to the signal-to-noise ratio (SNR) of raw experimental data, and can this relationship be expressed in a simple form? At what point do improvements in SNR stop translating into improved resolution in the diffusion domain?
While it is to be hoped that a clearer understanding of the role that signal-to-noise ratio plays in limiting the quality of DOSY spectra will prove useful, it should be stressed that SNR is just one of many factors involved. In particular, the analysis presented here takes no account of the effects of the systematic and reproducible experimental imperfections that all DOSY experiments are affected by. These include for example the spatial non-uniformity of pulsed magnetic field gradients (Damberg et al., 2001; Connell et al., 2009) and the effects of peak overlap (Botana et al., 2011). Questions such as choosing the optimum balance between time averaging and the number of different field gradient values to be used require many different factors to be taken into account, of which SNR is just one.
In its commonest (“high-resolution”) form, DOSY uses least squares fitting of the amplitudes of peaks in pulsed field gradient echo spectra to determine diffusion coefficients D. A series of N otherwise identical experiments is carried out in which the amplitudes G of diffusion-encoding field gradient pulses are varied to map out the decay of signal amplitude as a function of G. In the great majority of experiments, a simple fit to a single exponential is used; multiexponential fitting is possible but is extremely demanding of SNR (Nilsson et al., 2006) and is not considered here. The diffusional attenuation in successive measurements takes the form
where the form of bi is determined by the pulse sequence used (Sinnaeve, 2012). In the simple case of a pulsed field gradient spin or stimulated echo in which spatial encoding and decoding are performed by two gradient pulses of duration δ a time Δ−δ apart,
if the gradient pulses are rectangular in shape, or
if half-sine-shaped gradient pulses are used. In the former case the effective gradient Gi is equal to the peak gradient applied in a given pulse; in the latter Gi is equal to the peak gradient multiplied by . These expressions assume that the field gradient is constant across the sample, which is not always a good approximation; the effects of field gradient non-uniformity can be taken into account by replacing the term G2 by an appropriate power series in G2 (Connell et al., 2009).
Experimental data are imperfect, most notably because of the presence of a background of random electronic noise. In a well-conducted experiment the effect of this on the measurement of the amplitude S of a signal, whether in terms of peak height or of signal integral, is well described by the addition of a Gaussian distribution of standard deviation σS. In the case of peak height, the SNR is by convention defined as in NMR spectroscopy. In a DOSY dataset using N different gradient strengths Gi, each of the N measurements Si of the amplitude of a given peak will have the same standard deviation σS. The effect of this uncertainty on the value of D determined by nonlinear least squares fitting can easily be found by brute force Monte Carlo simulation or directly from the Cramér–Rao lower bound (CRLB). The latter has been extensively used in NMR, notably for selecting “optimum” sampling patterns Gi for the simultaneous determination of the diffusion coefficients of species of different D or for the estimation of diffusion distributions S(D) (see e.g. Brihuega-Moreno et al., 2003; Franconi et al., 2018; Reci et al., 2019; note that the derivations given in the first two references contain some minor typographical errors). The question of optimum sampling is considerably complicated by the presence of multiple sources of systematic error in diffusion NMR experiments and the need to allow for the likelihood of signal overlap, and is largely avoided here; rather, we use the CRLB for the much more pedestrian purpose of quantifying limiting diffusion resolution in DOSY.
A convenient measure of resolution RD in the diffusion dimension of the DOSY spectrum is the inverse of the coefficient of variation of D, that is the ratio of the estimated D to its estimated standard deviation σD. Using the conventional definition of SNR given above, expression (10) of Franconi et al. (2018) becomes
where
and
For a given diffusion coefficient D and choice of N gradient values Gi, therefore, the dependence of the resolution RD on the signal-to-noise ratio of a given signal can be calculated. Here RD was evaluated as a function of the number N of gradient values sampled, the maximum exponent ϵmax, and the form of the sampling scheme.
Expressions (4) and (5) allow direct calculation of RD. Equivalent results can be obtained easily by Monte Carlo methods, constructing an attenuation table and then repeatedly adding Gaussian noise n of standard deviation to each point of the table and fitting it to a function of the form . The standard deviation σβ of the parameter β is then the inverse of RD. Again, RD was evaluated as a function of the number N of gradient values sampled, the maximum exponent ϵmax, and the form of the sampling scheme.
Experimental 1H DOSY data were acquired for a 100 mM solution of quinine in DMSO-d6, with 50 mM sodium trimethylsilylpropionate (TSP) as a reference, using the Oneshot pulse sequence (Pelta et al., 2002) on a 500 MHz Varian VNMRS spectrometer equipped with a 5 mm triaxial gradient probe at 25 ∘C nominal temperature. Twelve quadratically spaced (equally spaced in gradient squared) nominal gradient amplitudes from 12.5 to 52.8 G cm−1 were used, with a net gradient-encoding rectangular pulse width of 1 ms and a diffusion delay Δ of 0.16 s. Eight transients of 16 384 complex points were acquired for each gradient value in a total experiment time of 5 min. The data were subjected to standard DOSY processing in VnmrJ, consisting of zero-filling, reference deconvolution (Morris et al., 1997) with a target Lorentzian linewidth of 1.3 Hz, baseline correction, peak picking, fitting to a Stejskal–Tanner equation modified to compensate for the measured gradient non-uniformity of the probe used (Damberg et al., 2001; Connell et al., 2009), and construction of the DOSY spectrum using the fitted signal amplitude, diffusion coefficient D, and standard error σD. The signal decay for the quinine methoxy peak at 3.9 ppm, which had a SNR of 14 400 : 1 at the lowest gradient used, was extracted, and the Stejskal–Tanner fit repeated with different additions of synthetic Gaussian noise to investigate the influence of SNR on RD.
Equation (4) shows that, as is intuitively reasonable, the diffusion resolution is directly proportional to SNR (provided that systematic sources of error are negligible). The proportionality constant is, however, a complicated function of the choice of sampling function and its relation to the diffusion coefficient: the more data points are measured, the better RD will be, but just how good depends on what parts of the attenuation curve those points sample. If only the early part of the curve is sampled (ϵmax < 1, where ϵmax is the maximum value of ϵ), then the effect of diffusion on the measured points will be small, or if too wide a range of gradients G is sampled (), then many of the measured points will contain very little signal, and in both cases RD will suffer. In a typical high-resolution DOSY experiment, the sample will contain species of different sizes with a range of diffusion coefficients D. Where the range is not too wide, it is common practice to use a simple sampling scheme in which the field gradient pulse amplitude is incremented either linearly, from some minimum value Gmin to a maximum Gmax in equal steps of G:
or, quadratically, from Gmin to Gmax in equal steps of G2:
Because the diffusion-encoding gradient pulses G also play a part in determining coherence transfer pathways in many NMR methods for measuring diffusion and complementing and reinforcing the effects of phase cycling, it is important in practice that small values of Gmin be avoided. This is particularly important if experiments such as Oneshot (Pelta et al., 2002) that employ unbalanced bipolar gradient pulse pairs are used with low numbers of transients (and hence incomplete phase cycling). Common practice is therefore to use a constant ratio , where κ=0.05–0.25, so that G varies from κGmax to Gmax. Linear and quadratic sampling give similar diffusion resolution, as is shown below. Quadratic sampling can make it easier to detect systematic deviations from exponential decay as a function of gradient squared, and hence to identify peaks in which the signals of species of different D overlap.
For a given set of experimental delays and pulse durations, linear and quadratic spacing in G will give different sets of Stejskal–Tanner exponents ϵi. Different diffusion coefficients D will give different maxima ϵmax, and because the attenuation caused by the minimum gradient Gmin depends on D, the minimum Stejskal–Tanner exponent ϵmin will vary slightly with ϵmax. Thus for linear sampling the Stejskal–Tanner exponents are
and for quadratic sampling
Figure 1 compares the results of Monte Carlo simulations (small filled circles) of exponential fits for the two sampling schemes, with SNR = 100 and κ=0.05 in both cases, as a function of N and ϵmax with the Cramér–Rao upper bounds (open circles) for RD. As expected, there is excellent agreement between the Monte Carlo and analytical results. The lines for linear regression confirm that there is a direct proportionality with for low ϵmax but that for higher ϵmax, where the signal is strongly attenuated for greater ϵi values, the line of best fit is displaced. The slope of the line of best fit for RD as a function of rises as ϵmax increases until it reaches a maximum at around , after which it decreases again. This is again as expected: for low ϵmax the data are dominated by points that have high precision but low attenuation, while for high ϵmax the converse is true.
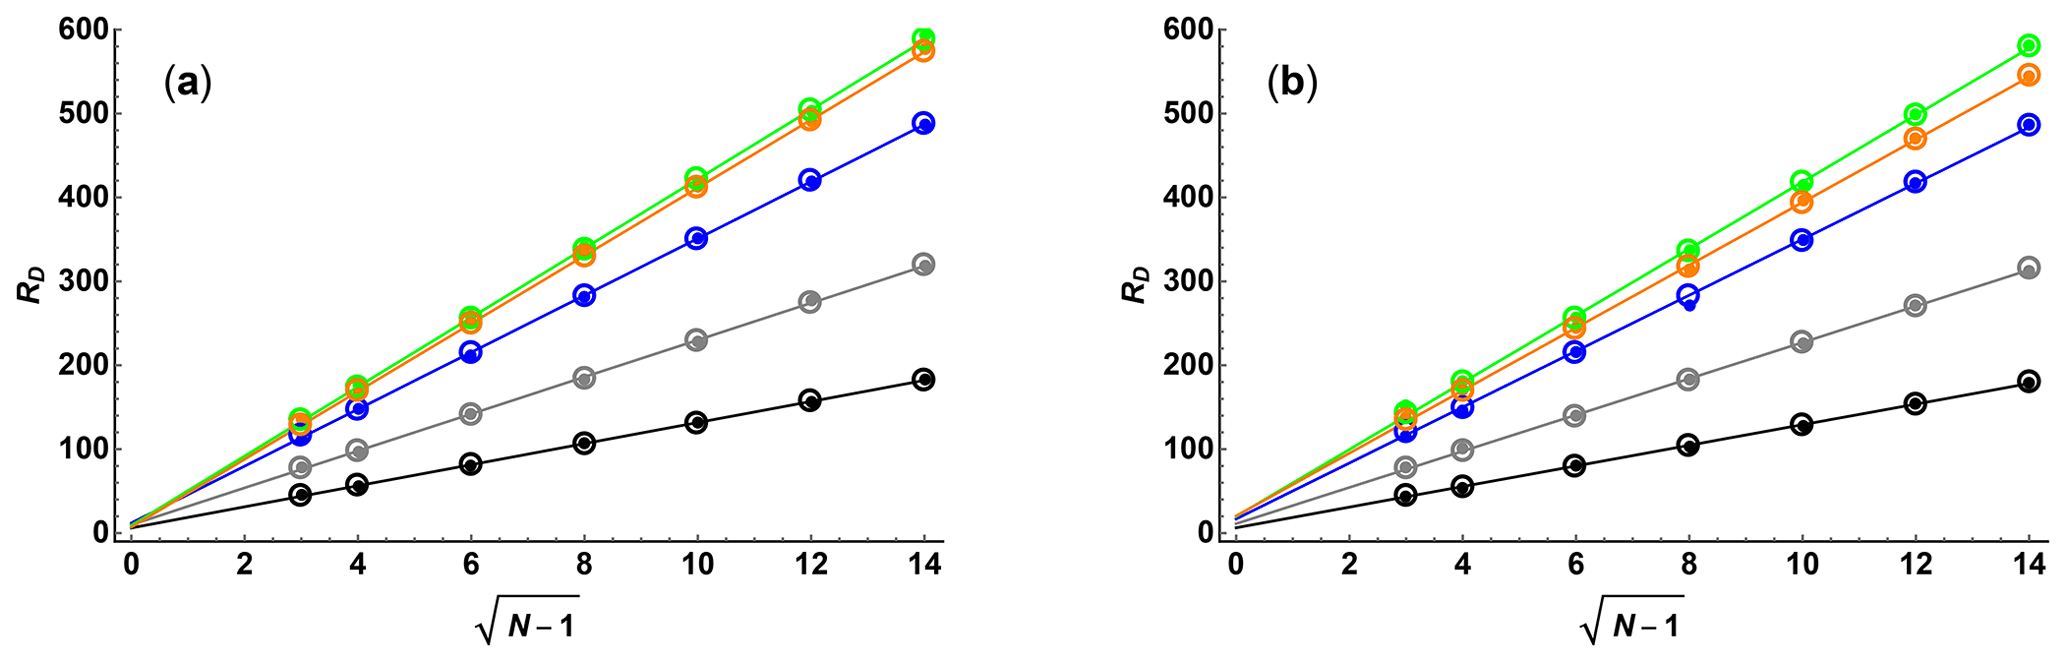
Figure 1Diffusion resolution RD as a function of , where N is the number of gradient values used, for (a) linear and (b) quadratic sampling in the gradient domain, determined by Monte Carlo simulation (small filled circles) and Cramér–Rao least bounds analysis (open circles), for SNR = 100 and maximum Stejskal–Tanner exponents ϵmax of 0.25 (black), 0.5 (grey), 1 (blue), 2 (green), and 3 (orange). Solid lines show the results of linear regression of the Cramér–Rao data.
The predicted diffusion resolution RD is a function of the sampling scheme, SNR, maximum Stejskal–Tanner exponent ϵmax, and number of gradient values used N. Given the nature of Eqs. (4) and (5), it is clear that no simple analytical form exists for . Equally, it is known that RD is directly proportional to SNR, and it is reasonable to expect RD to be proportional to the square root of N−1, since (a) increasing N will decrease the effects of random errors in proportion to the square root of the effective number of independent measures of D and (b) that number will be dependent on N−1, since it is the change in signal amplitude that provides information on D, reducing the number of degrees of freedom by 1. In general the effective number will be less than N−1 for all but low values of ϵmax, because signal attenuation will reduce the information content for higher values ϵi. It is thus reasonable to seek an approximate analytical representation of the form
Figure 2 shows the variation of f as a function of ϵmax, calculated numerically using Eqs. (4), (5), (8), and (9) for values of N between 10 and 200 for linear and quadratic sampling, together with fits to a three-parameter function of the form
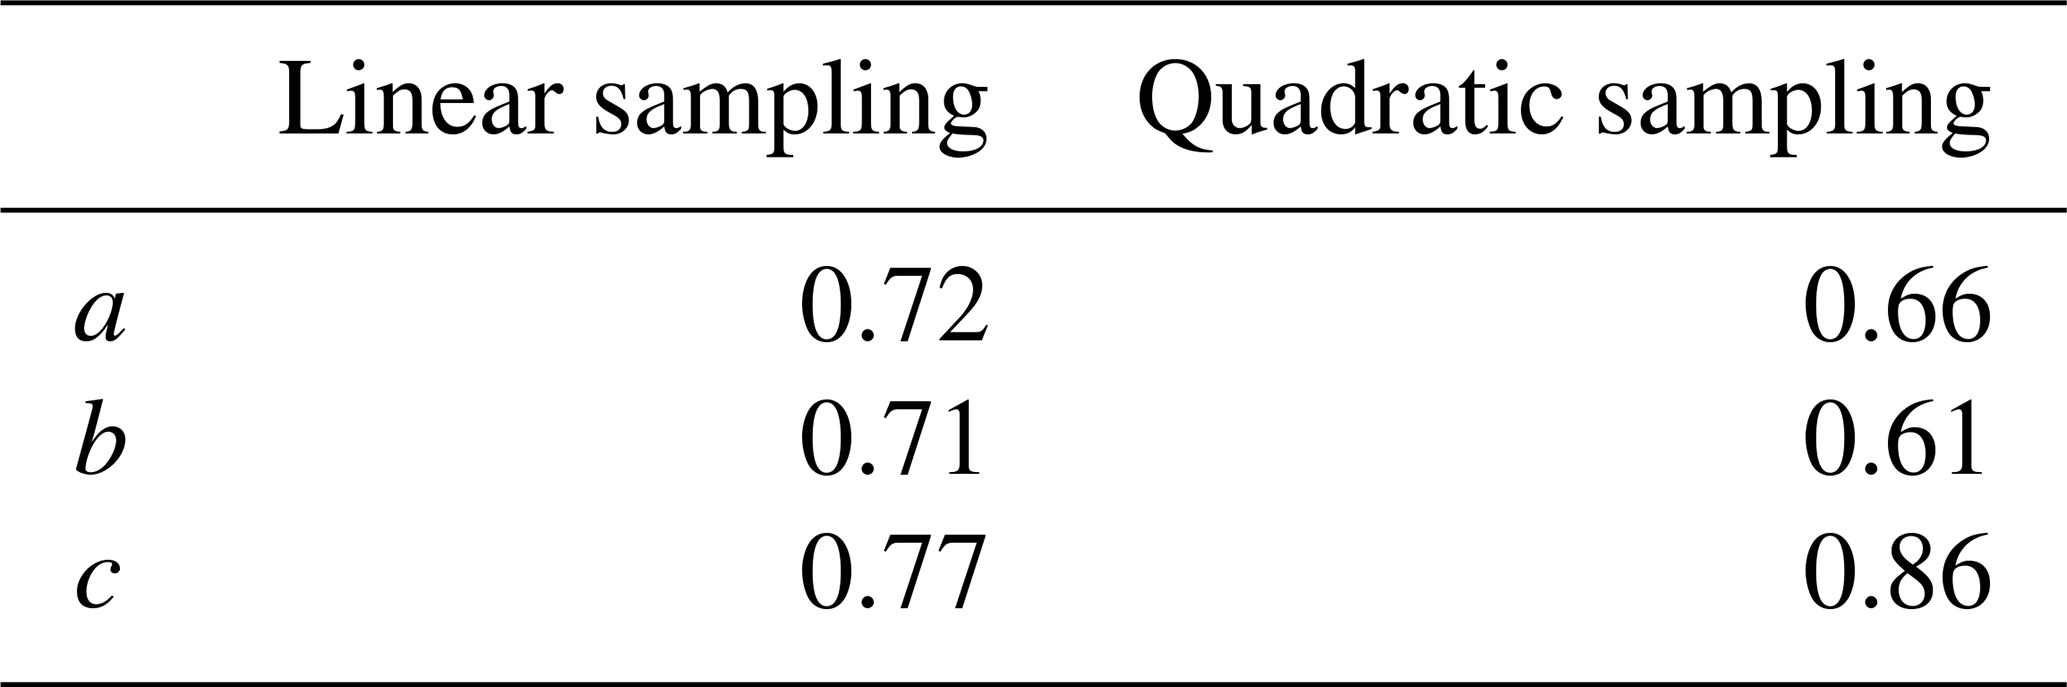
The quality of fit is more than adequate for practical use, establishing a simple relationship between diffusion resolution, signal-to-noise ratio, and experimental parameters; fit parameters are given in Table 1.

Figure 2Relative diffusion resolution f(ϵmax) determined Cramér–Rao least bounds analysis (open circles) as a function of maximum Stejskal–Tanner exponent ϵmax, for (a) linear and (b) quadratic sampling in the gradient domain with 10 (black), 17 (grey), 37 (blue), 65 (green), 101 (yellow), and 197 (red) gradient values. Solid lines show the results of nonlinear regression of the data points shown to the three-parameter function Eq. (11).
Table 1Fitted parameters for Eq. (11) obtained from the data of Fig. 2. No error estimates are given as the data fitted are not normally distributed.
In principle, diffusion accuracy should increase indefinitely as the signal-to-noise ratio of the experimental data increases. (“Accuracy” is used here in the sense of the reliance that can be placed on the positions of peaks in the diffusion dimension of a DOSY spectrum, i.e. the “trueness” of the diffusion dimension.) In practice diffusion accuracy does not increase indefinitely, because spectral noise is far from the only source of uncertainty in the signal attenuations measured in DOSY experiments. Radio-frequency pulse irreproducibility, field-frequency ratio instability, gradient noise, temperature variation, and a range of other sources all limit the reliability of signal intensity measurements in NMR, limiting resolution in DOSY and causing t1 noise in multidimensional spectra (Mehlkopf et al., 1984; Morris, 1992). In general, the accuracy and reproducibility of NMR data tend to deteriorate as the number of pulses used in a sequence increases (because of pulse phase and amplitude jitter caused by limited radio-frequency spectral purity), as the durations of the delays used increase (because of the cumulative effect of field-frequency fluctuations), and as the overall duration of an experiment increases (because of slow changes in environmental factors such as room temperature and air pressure). Most such perturbations are at least semi-systematic in nature, but many (particularly pulse-phase instability) have effects that can appear random and can therefore decrease, at least to some extent, with time averaging. Other sources of distortion in the measured signal decay are both systematic and reproducible and therefore do not decrease with time averaging. These include changes in signal attenuation caused by convection (never wholly absent in practical NMR experiments on liquids; Swan et al., 2015; Barbosa et al., 2016) and by the presence of signals from unwanted coherence transfer pathways. Distortions caused by spatial non-uniformity of the field gradient can be corrected for if appropriate calibration is performed (Damberg et al., 2001; Connell et al., 2009).
There is thus a practical limit to the benefits to be gained by increasing SNR, whether by time averaging, increasing the signal strength (e.g. by increasing sample concentration), or reducing the noise (e.g. by using a cold probe and preamp). This is illustrated here with experimental data obtained as described earlier for the methoxy signal from a sample of quinine. The starting SNR of the quinine methoxy peak in the lowest gradient spectrum was 14 400 : 1; successively greater amounts of synthetic Gaussian noise were added and fitting repeated, averaging the results of 100 additions, to show the influence of SNR on the diffusion resolution RD. If the contributions from sources other than noise to the errors in the experimental peak height as a function of gradient strength are normally distributed and have a root mean square deviation which is a fraction of the initial peak amplitude, then the effect on fitting, and hence on diffusion resolution, of adding uncorrelated noise is to degrade the effective signal-to-noise ratio SNR in Eq. (10) to
This gives a final predicted diffusion resolution for given experimental conditions of
where f(ϵmax) can be approximated by Eq. (11). Thus, if the noise contribution to the experimental uncertainty is dominant, the effective signal-to-noise ratio is the actual SNR, but at high SNR the effective signal-to-noise ratio for the purposes of Stejskal–Tanner fitting is the limit SNRlim imposed by other error sources.
To investigate the effect of signal-to-noise ratio on diffusion resolution, synthetic noise was added to the experimental data used to construct the 1H DOSY spectrum of quinine shown in Fig. 3. Figure 4 shows the effect of SNR on the measured RD for experimental data for the quinine methoxy peak, found by titrating in extra noise as described above. The experimental signal-to-noise ratio of the first gradient increment was 14 400 : 1, but the diffusion resolution RD found when the raw experimental data were fitted was only 420, a small fraction of the predicted value of almost 15 000. As Fig. 4 shows, at low SNR the observed diffusion resolution follows the line expected for the unmodified Cramér–Rao limit of Eq. (11), but as SNR increases the improvement in RD levels off, slowly approaching the limit seen for the data with no noise added. Fitting of Eq. (13) to the noise-supplemented experimental data gave a value of just over 300 for SNRlim. To put this value in context, it corresponds to a respectably small root mean square uncertainty in the signal amplitudes measured of % of the original peak intensity, typical of good-quality results obtained with multiple pulse sequences on a modern spectrometer. With extended time averaging and appropriate precautions and instrumental interventions, it is possible to obtain data with significantly smaller uncertainties than this (see e.g. Power et al., 2016), but the cost in time and effort can be considerable.

Figure 3500 MHz Oneshot 1H DOSY spectrum of 100 mM quinine in DMSO-d6 with 50 mM sodium trimethylsilylpropionate as a reference, acquired as described in the text.
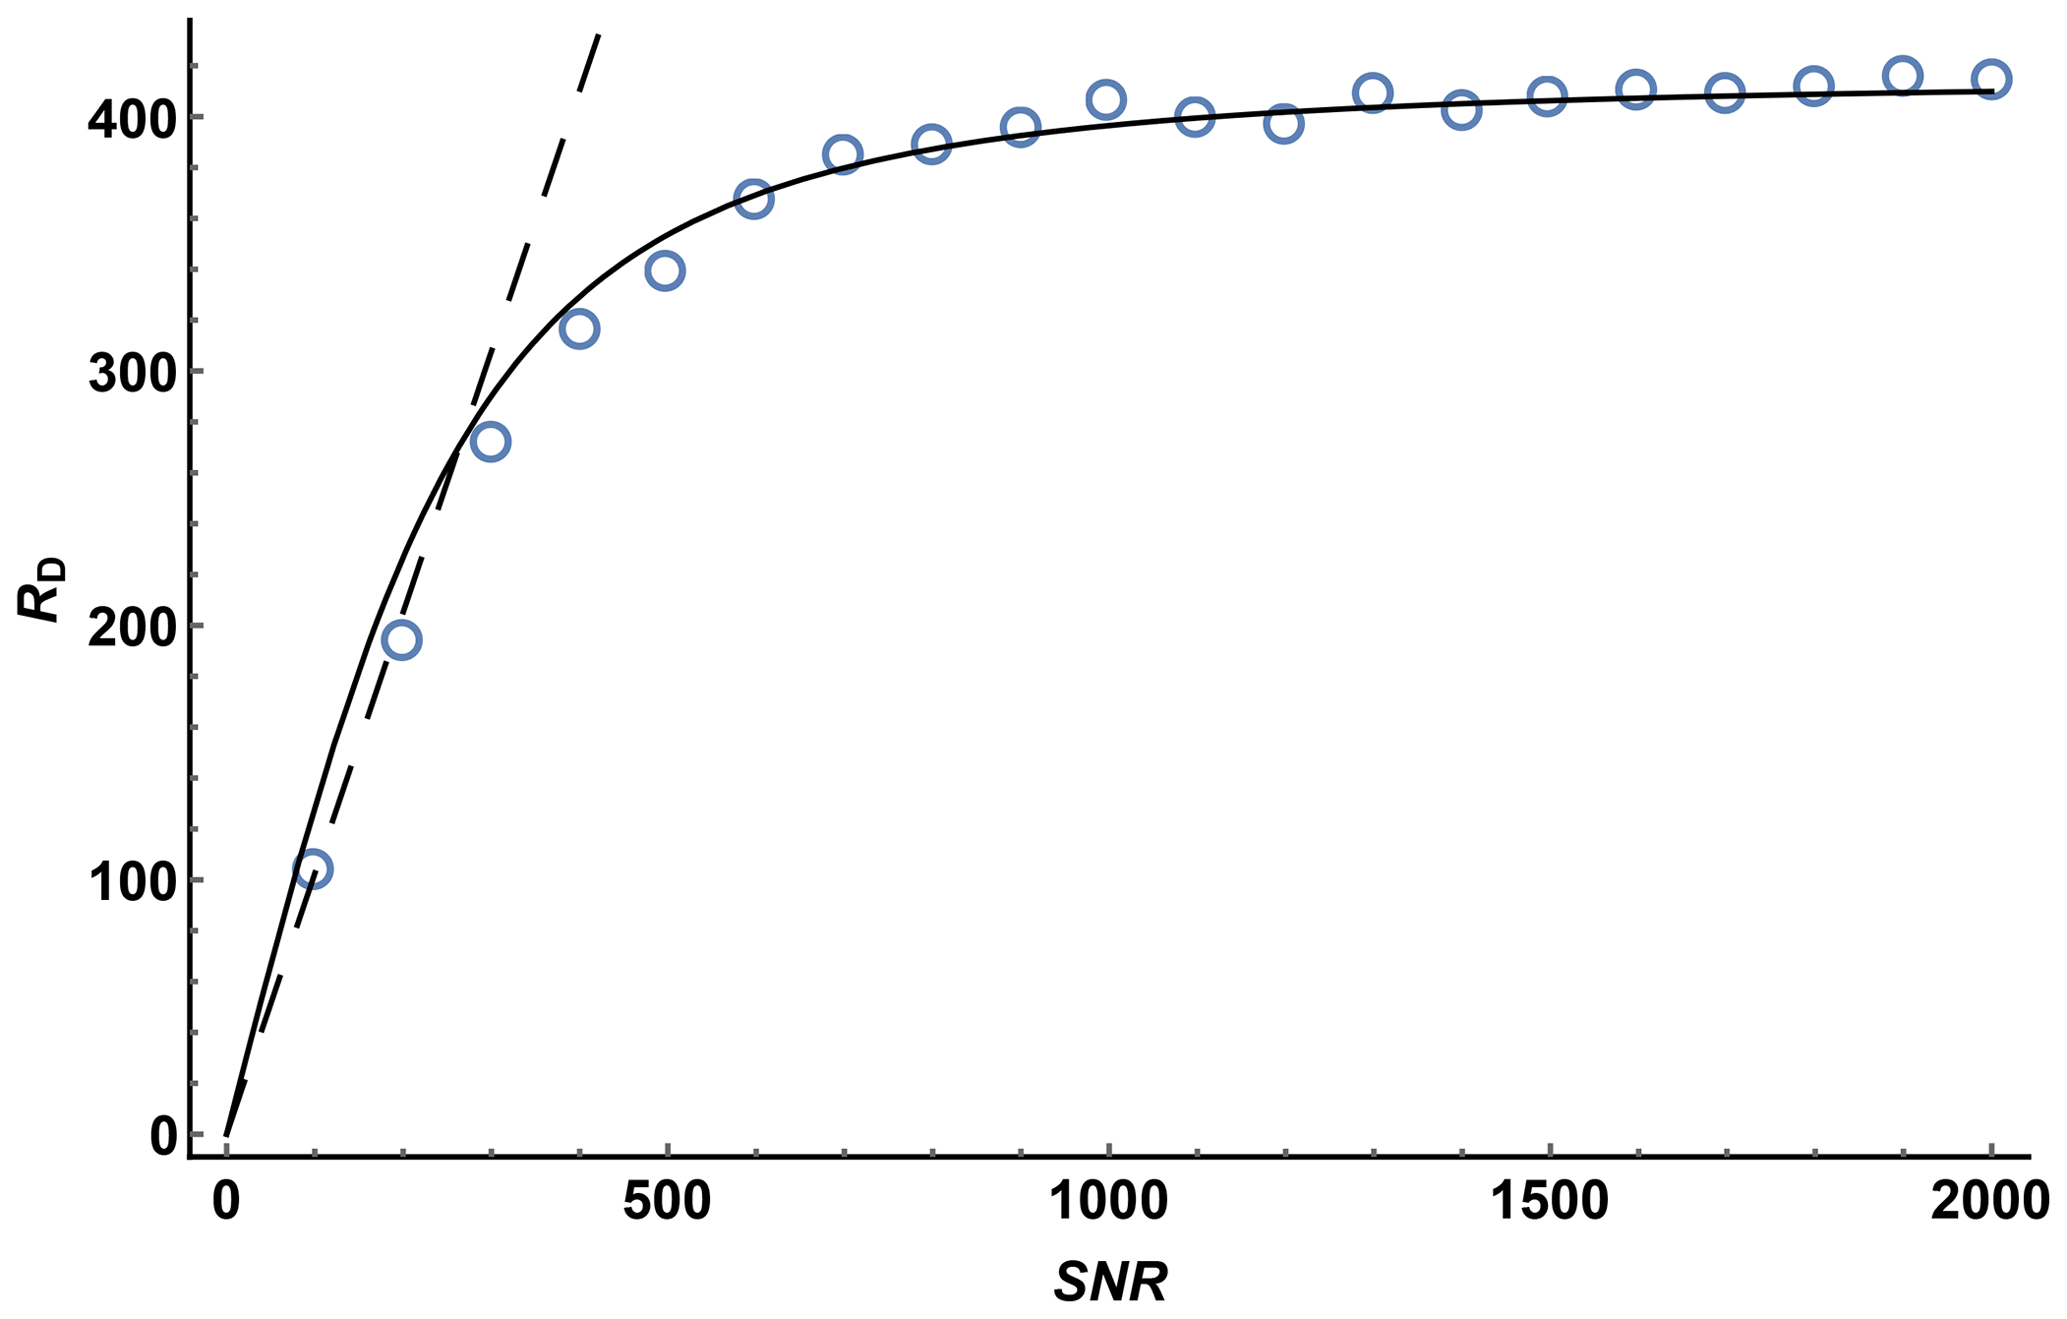
Figure 4Diffusion resolution RD as a function of signal-to-noise ratio for the methoxy signal of quinine in a Oneshot experiment on a 100 mM solution of quinine in DMSO-d6. Open circles show the average of 100 values of RD by fitting of the experimental data with the addition of synthetic Gaussian noise for each value of SNR, the dashed line shows the predicted Cramér–Rao limit, Eq. (11), for the experimental parameters used (N=12, ), and the solid line the result of nonlinear least squares fitting of the Cramér–Rao limit modified to take into account the presence of other errors in the signal intensity, Eq. (12), with SNRlim=305.
It is well known that the signal-to-noise ratio of diffusion-weighted experimental NMR data plays a critical role in determining the diffusion resolution of a DOSY spectrum constructed from it. There is thus a temptation to conduct very long experiments with extensive time averaging in order to obtain the best possible results. Conversely, in dilute systems the temptation is to conduct equally long experiments in the hope of obtaining results with sufficient diffusion resolution to shed light on speciation, etc. In both cases it is possible, and indeed common, to waste a great deal of instrument time for no good result, either because sources of error other than noise dominate the fitting statistics, or because the final signal-to-noise ratio is insufficient. Here it is shown that a trivial calculation with Eq. (11) will show both whether or not such experiments may be worth attempting in the first place, and what limiting diffusion resolution is achievable.
Raw experimental data for Fig. 3 and the Mathematica code used to generate Figs. 1, 2, and 4 can be downloaded from DOI https://doi.org/10.17632/d7bdxz9hsk.1 (Morris, 2021).
GAM and MN designed the experiments and simulations. JG and PK carried out the experimental work. JG and GAM performed the simulations and analysis. GAM prepared the manuscript with contributions from all the co-authors.
Mathias Nilsson is an editor of Magnetic Resonance.
Publisher's note: Copernicus Publications remains neutral with regard to jurisdictional claims in published maps and institutional affiliations.
This article is part of the special issue “Geoffrey Bodenhausen Festschrift”. It is not associated with a conference.
This work was supported by the Engineering and Physical Sciences Research Council (grant numbers EP/N033949/1 and EP/R018790/1).
This research has been supported by the Engineering and Physical Sciences Research Council (grant nos. EP/R018790/1 and EP/N033949/1).
This paper was edited by Fabien Ferrage and reviewed by two anonymous referees.
Barbosa, T. M., Rittner, R., Tormena, C. F., Morris, G. A., and Nilsson, M.: Convection in liquid-state NMR: expect the unexpected, RSC Advs. 6, 95173–95176, https://doi.org/10.1039/C6RA23427E, 2016.
Botana, A., Aguilar, J. A., Nilsson, M., and Morris, G. A.: J-modulation effects in DOSY experiments and their suppression: The Oneshot45 experiment, J. Magn. Reson., 208, 270–278, https://doi.org/10.1016/j.jmr.2010.11.012, 2011.
Brihuega-Moreno, O., Heese, F. P., and Hall, L. D.: Optimization of Diffusion Measurements Using Cramer-Rao Lower Bound Theory and Its Application to Articular Cartilage, Magn. Reson. Med., 50, 1069–1076, https://doi.org/10.1002/mrm.10628, 2003.
Connell, M. A., Bowyer, P. J., Bone, P. A., Davis, A. L., Swanson, A. G., Nilsson, M., and Morris, G. A.: Improving the accuracy of pulsed field gradient NMR diffusion experiments: Correction for gradient non-uniformity, J. Magn. Reson., 198, 121–131, https://doi.org/10.1016/j.jmr.2009.01.025, 2009.
Dal Poggetto, G., CastanÞar, L., Adams, R. W., Morris, G. A., and Nilsson, M: Relaxation-encoded NMR experiments for mixture analysis: REST and beer, Chem. Commun., 53, 7461–7464, https://doi.org/10.1039/c7cc03150e, 2017.
Damberg, P., Jarvet, J., and Gräslund, A.: Accurate measurement of translational diffusion coefficients: a practical method to account for nonlinear gradients, J. Magn. Reson., 148, 343–348, https://doi.org/10.1006/jmre.2000.2260, 2001.
Franconi, F., Lemaire, L., Siegler, B., Gimel, J.-C., and Saulnier, P.: NMR diffusometry data sampling optimization for mixture analysis, J. Pharm. Biomed. Anal., 148, 156–162, https://doi.org/10.1016/j.jpba.2017.09.028, 2018.
Gilard, V., Trefi, S., Balayssac, S., Delsuc, M. A., Gostan, T., Malet-Martino, M., Martino, R., Pringent, Y., and Taulelle, F.: DOSY NMR for Drug analysis, in: NMR Spectroscopy in Pharmaceutical Analysis, edited by: Holzgrabe, U., Wawer, I., and Diehl, B., Elsevier, Amsterdam, the Netherlands, chap. 6, 269–289, https://doi.org/10.1016/B978-0-444-53173-5.X0001-7, 2008.
Johnson, C. S.: Diffusion ordered nuclear magnetic resonance spectroscopy: principles and applications, Prog. Nucl. Magn. Reson. Spectrosc., 34, 203–256, https://doi.org/10.1016/S0079-6565(99)00003-5, 1999.
Lupulescu, A., Kotecha, M., and Frydman, L.: Relaxation-Assisted Separation of Chemical Sites in NMR Spectroscopy of Static Solids, J. Am. Chem. Soc., 125, 3376–3383, https://doi.org/10.1021/ja021173m, 2003.
Mehlkopf, A. F., Korbee, D., Tiggelman, T. A., and Freeman, R.: Sources of tI Noise in Two-Dimensional NMR, J. Magn. Reson., 58, 315–323, https://doi.org/10.1016/0022-2364(84)90221-X, 1984.
Morris, G.: DOSY_SNR, Mendeley Data [data set, code], V1, https://doi.org/10.17632/d7bdxz9hsk.1, 2021.
Morris, G. A.: Systematic Sources of Signal Irreproducibility and t1 Noise in High-Field NMR Spectrometers, J. Magn. Reson., 100, 316–328, https://doi.org/10.1016/0022-2364(92)90264-8, 1992.
Morris, G. A.: Diffusion-ordered spectroscopy (DOSY), eMagRes, https://doi.org/10.1002/9780470034590.emrstm0119.pub2, 2007.
Morris, G. A., Barjat, H., and Horne, T. J.: Reference deconvolution methods, Prog. Nucl. Magn. Reson. Spectrosc., 31, 197–257, https://doi.org/10.1016/S0079-6565(97)00011-3, 1997.
Morris, K. F. and Johnson, C. S.: Diffusion-ordered two-dimensional nuclear magnetic resonance spectroscopy, J. Am. Chem. Soc., 114, 3139–3141, https://doi.org/10.1021/ja00034a071, 1992.
Nilsson, M., Connell, M. A., Davis, A. L., and Morris, G. A.: Biexponential fitting of diffusion-ordered NMR data: practicalities and limitations, Anal. Chem. 78, 3040–3045, https://doi.org/10.1021/ac060034a, 2006.
Nishiyama, Y., Frey, M. H., Mukasa, S., and Utsumi, H.: 13C solid-state NMR chromatography by magic angle spinning 1H T1 relaxation ordered spectroscopy, J. Magn. Reson., 202, 135–139, https://doi.org/10.1016/j.jmr.2009.10.009, 2010.
Pelta, M. D., Morris, G. A., Stchedroff, M. J., and Hammond, S. J.: A one-shot sequence for high-resolution diffusion-ordered spectroscopy, Magn. Reson. Chem., 40, S147–s152, https://doi.org/10.1002/mrc.1107, 2002.
Power, J. E., Foroozandeh, M., Adams, R. W., Nilsson, M., Coombes, S. R., Phillips, A. R., and Morris, G. A.: Increasing the quantitative bandwidth of NMR measurements, Chem. Commun., 59, 2916–2919, https://doi.org/10.1039/c5cc10206e, 2016.
Reci, A., Ainte, M. I., Sederman, A. J., Mantle, M. D., and Gladden, L. F.: Optimising sampling patterns for bi-exponentially decaying signals, Magn. Reson. Imaging, 56, 14–18, https://doi.org/10.1016/j.mri.2018.09.029, 2019.
Sinnaeve, D.: The Stejskal-Tanner equation generalized for any gradient shape – an overview of most pulse sequences measuring free diffusion, Concepts Magn. Reson. A, 40A, 39–65, https://doi.org/10.1002/cmr.a.21223, 2012.
Stejskal, E. O. and Tanner, J. E: Spin diffusion measurements: spin echoes in the presence of a time-dependent field gradient, J. Chem. Phys., 42, 288–292, https://doi.org/10.1063/1.1695690, 1965.
Stilbs, P.: Molecular self-diffusion coefficients in fourier transform nuclear magnetic resonance spectrometric analysis of complex mixtures, Anal. Chem., 53, 2135–2137, https://doi.org/10.1021/ac00236a044, 1981.
Swan, I., Reid, M., Howe, P. W. A., Connell, M. A., Nilsson, M., Moore, M. A., and Morris, G. A.: Sample convection in liquid-state NMR: why it is always with us, and what we can do about it, J. Magn. Respn., 252, 120–129, https://doi.org/10.1016/j.jmr.2014.12.006, 2015.