the Creative Commons Attribution 4.0 License.
the Creative Commons Attribution 4.0 License.
 | 03 Nov 2021
Analysis of conformational exchange processes using methyl-TROSY-based Hahn echo measurements of quadruple-quantum relaxation
John Christodoulou
Transverse nuclear spin relaxation is a sensitive probe of chemical exchange on timescales on the order of microseconds to milliseconds. Here we present an experiment for the simultaneous measurement of the relaxation rates of two quadruple-quantum transitions in 13CH3-labelled methyl groups. These coherences are protected against relaxation by intra-methyl dipolar interactions and so have unexpectedly long lifetimes within perdeuterated biomacromolecules. However, these coherences also have an order of magnitude higher sensitivity to chemical exchange broadening than lower order coherences and therefore provide ideal probes of dynamic processes. We show that analysis of the static magnetic field dependence of zero-, double- and quadruple-quantum Hahn echo relaxation rates provides a robust indication of chemical exchange and can determine the signed relative magnitudes of proton and carbon chemical shift differences between ground and excited states. We also demonstrate that this analysis can be combined with established Carr–Purcell–Meiboom–Gill (CPMG) relaxation dispersion measurements, providing improved precision in parameter estimates, particularly in the determination of 1H chemical shift differences.
- Article
(3942 KB) - Full-text XML
-
Supplement
(2276 KB) - BibTeX
- EndNote


Solution NMR spectroscopy is a powerful tool for the characterisation of macromolecular dynamics over a range of timescales relevant to biological function (Sekhar and Kay, 2019): from backbone and sidechain disorder on ps–ns timescales, characterised by S2 order parameters (Frederick et al., 2007; Stetz et al., 2019; Sun et al., 2011); rotational diffusion and domain motions, characterised by rotational correlation times, τc (Ryabov et al., 2009; Waudby et al., 2021); through to real-time measurements of kinetics on timescales of seconds and beyond, following rapid mixing, temperature or pressure jumps (Charlier et al., 2018; Franco et al., 2017; Waudby et al., 2018). NMR is also particularly well suited to the analysis of reversible chemical exchange on timescales of the order of microseconds to milliseconds, via lineshape analysis across a titration series (Stadmiller et al., 2020; Waudby et al., 2016, 2020) or using sophisticated pulse sequences such as ZZ-exchange spectroscopy, chemical exchange saturation transfer (CEST) and Carr–Purcell–Meiboom–Gill (CPMG) and R1ρ relaxation dispersion (Alderson et al., 2020; Boswell and Latham, 2019).
An NMR-active spin in chemical exchange between two conformations experiences an additional contribution, Rex, to its observed transverse relaxation rate:
where R2,0 is the relaxation rate in the absence of exchange. For exchange between two conformations, labelled A and B, the magnitude of Rex depends on the populations, pA and pB, the exchange rate, , and the difference in frequency of the observed coherence between states A and B, Δω. For a single quantum coherence of nucleus X, this frequency difference, ΔωX=γXB0ΔδX, depends on the gyromagnetic ratio of the nucleus, γ, the chemical shift difference, Δδ, and the magnetic field strength, B0, while for multiple quantum coherences, frequency differences reflect linear combinations of the individual coherences. We assume that exchange-induced fluctuations in chemical shift are correlated between nuclei; uncorrelated behaviour (e.g. as observed for T4 lysozyme; Toyama et al., 2017) would indicate the presence of an additional state. In the fast exchange limit, the focus of much of this paper, the exchange contribution to relaxation for a single quantum coherence of nucleus X is
where
represents the chemical shift difference, normalised by the particular parameters of the exchange process. The exchange term therefore in principle contains information on thermodynamic, kinetic and structural aspects of the chemical exchange process, and a variety of methods have been developed to extract this information, adapted to varying functional groups, molecular weights, populations and timescales (Alderson et al., 2020; Sekhar and Kay, 2019).
Although the overall R2 (Eq. 1) is readily measured by Hahn echo (HE) experiments (provided only that the timescale of exchange is much shorter than the echo duration), for the analysis of exchange it is necessary to quantify the exchange term Rex, either by direct modulation through application of radio frequency (rf) fields or by determination of the exchange-free relaxation rate, R2,0. CPMG experiments, and related R1ρ measurements, are a popular example of the former approach, in which the application of a train of refocusing pulses, with frequency νCPMGkex, reduces the magnitude of the exchange contribution. Analysis of the static field and frequency dependence of this effect can be used to quantify chemical shift differences and the populations and timescales of exchange (Millet et al., 2000). CPMG experiments have now been developed for a variety of spin systems, enabling the analysis of dynamics in protein backbone and sidechains, as well as nucleic acids (Hansen et al., 2008; Juen et al., 2016; Korzhnev et al., 2004a, 2005; Loria et al., 1999; Tugarinov et al., 2020; Yuwen et al., 2019; Yuwen and Kay, 2019).
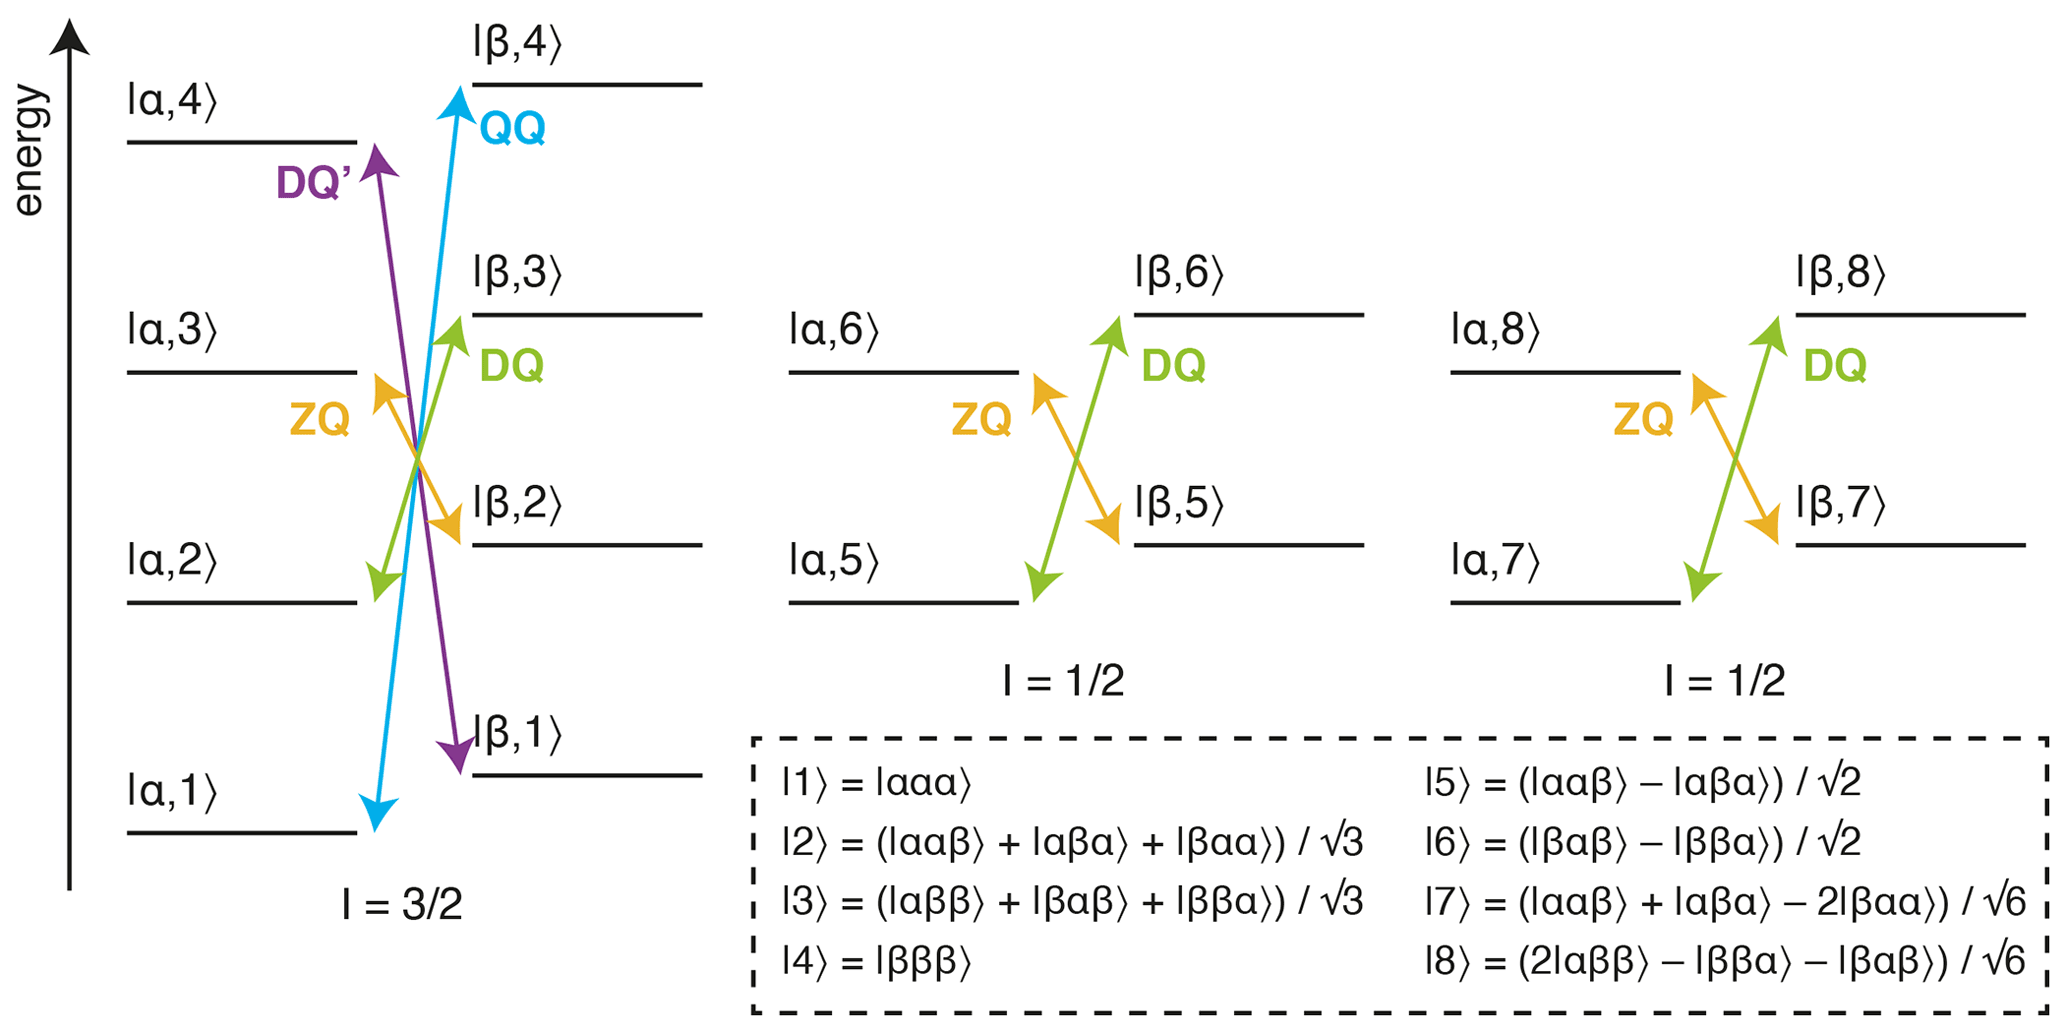
Figure 1Energy level diagram for an isolated 13CH3 spin system. The multiple quantum transitions analysed in this work are indicated with arrows. Energy levels are indexed |C,H〉 according to 13C and 1H spin states, where symmetrised combinations of 1H spins are indicated in the inset box (Tugarinov and Kay, 2006).
The analysis of methyl groups is particularly interesting, as these groups are well suited to the observation of high-molecular-weight systems through the combination of 13CH3 labelling against a perdeuterated background, reducing dipolar relaxation pathways, with methyl-TROSY (transverse relaxation optimised) pulse sequences, such as the HMQC (heteronuclear multiple quantum coherence), which select for slowly relaxing coherences within the complex energy levels of the spin system (Fig. 1) (Tugarinov et al., 2003). Given this, the multiple quantum (MQ) CPMG experiment, based on the analysis of zero-quantum (ZQ) and double-quantum (DQ) coherences, provides the greatest sensitivity, although the analysis is complex as dispersions depend on both 1H and 13C chemical shift differences (Korzhnev et al., 2004b, a). In other experiments, pulse imperfections can cause unwanted mixing between energy levels, requiring the use of compensation elements (e.g. 1H SQ) (Yuwen et al., 2019), while in addition, back-transfer from Cz coherences is inefficient, so 13C SQ measurements can be challenging without the use of complex pulse sequences or labelling schemes (Lundström et al., 2007; Skrynnikov et al., 2001; Tugarinov et al., 2020; Weininger et al., 2012). Higher order coherences can also be exploited within fully 13CH3-labelled methyl groups, such as 1H DQ or triple-quantum (TQ) CPMG experiments, which provide exquisite sensitivity to small 1H chemical shift differences as the effective frequency difference, Δω, is magnified 2- or 3-fold, resulting in 4- to 9-fold increases in Rex (Eq. 2) (Gopalan et al., 2018; Yuwen et al., 2016). However, the sensitivity of these experiments is somewhat low, particularly for large systems, due to rapid relaxation through C–H dipolar interactions during the constant-time (CT) CPMG relaxation period.
An alternative approach to the detection of chemical exchange is the analysis of the relaxation and cross-correlated relaxation of multiple quantum coherences, RMQ and ΔRMQ, defined as the sum and difference of ZQ and DQ relaxation rates (Fig. 1):
Originally measured in amide spin systems, multiple quantum cross-correlated relaxation in particular was identified as being sensitive to chemical exchange through correlated fluctuations in the component proton and nitrogen frequencies, as well as being sensitive to correlated fluctuations between anisotropic chemical shifts due to rotational diffusion (Kloiber and Konrat, 2000; Tessari and Vuister, 2000). CPMG pulse trains may be combined with these measurements to identify the contributions to ΔRMQ due exclusively to chemical exchange (Dittmer and Bodenhausen, 2004). Leveraging the multi-spin nature of MQ coherences, measurements of MQ cross-correlated relaxation have since been applied to other extended spin systems, such as adjacent Cα and Cβ spins, adjacent Cα(i) and Cα(i−1) spins and 15N spins separated by hydrogen bonds, to detect long-range conformational exchange processes (Chiarparin et al., 2001; Früh et al., 2001; Lundstrom et al., 2005).
Within methyl groups, multiple quantum relaxation and cross-correlated relaxation rates can be determined indirectly, by measurement of ZQ and DQ relaxation rates using methyl-TROSY HE experiments that incorporate a filter to select only the slowly relaxing inner lines (Gill and Palmer, 2011). CPMG pulse trains may again be employed to distinguish the effects of cross-correlations in chemical shift anisotropy (CSA) from chemical exchange (Toyama et al., 2016). Alternatively, deviations from an empirical correlation established between ΔRMQ and measurements of cross-correlated dipole–dipole relaxation between methyl protons (ηHH, which is proportional to may be used to identify methyl groups involved in chemical exchange processes (Gill et al., 2019). However, a more detailed analysis may also be carried out, wherein the magnetic field dependence of RMQ and ΔRMQ rates is analysed and the field-dependent contributions from the 1H and 13C CSAs measured and subtracted to determine the contributions due to chemical exchange (Toyama et al., 2017) (re-cast from the original according to Eq. 3):
These expressions may be used to compare the calculated RMQ,ex and ΔRMQ,ex terms with the chemical shift differences to some known reference state, assuming that all spins are part of the same exchange process and so have identical excited state populations and exchange rates (Toyama et al., 2017). However, as the expressions are symmetric in ξC and ξH, these parameters themselves cannot be determined unambiguously. While it is possible to determine the relative sign of ξC and ξH from the sign of ΔRMQ,ex, additional approaches based on R1ρ measurements, or the analysis of peak positions between single and multiple quantum correlation experiments or between fields, are required to determine their absolute signs (Auer et al., 2010; Bouvignies et al., 2010; Gopalan and Vallurupalli, 2018; Skrynnikov et al., 2002).
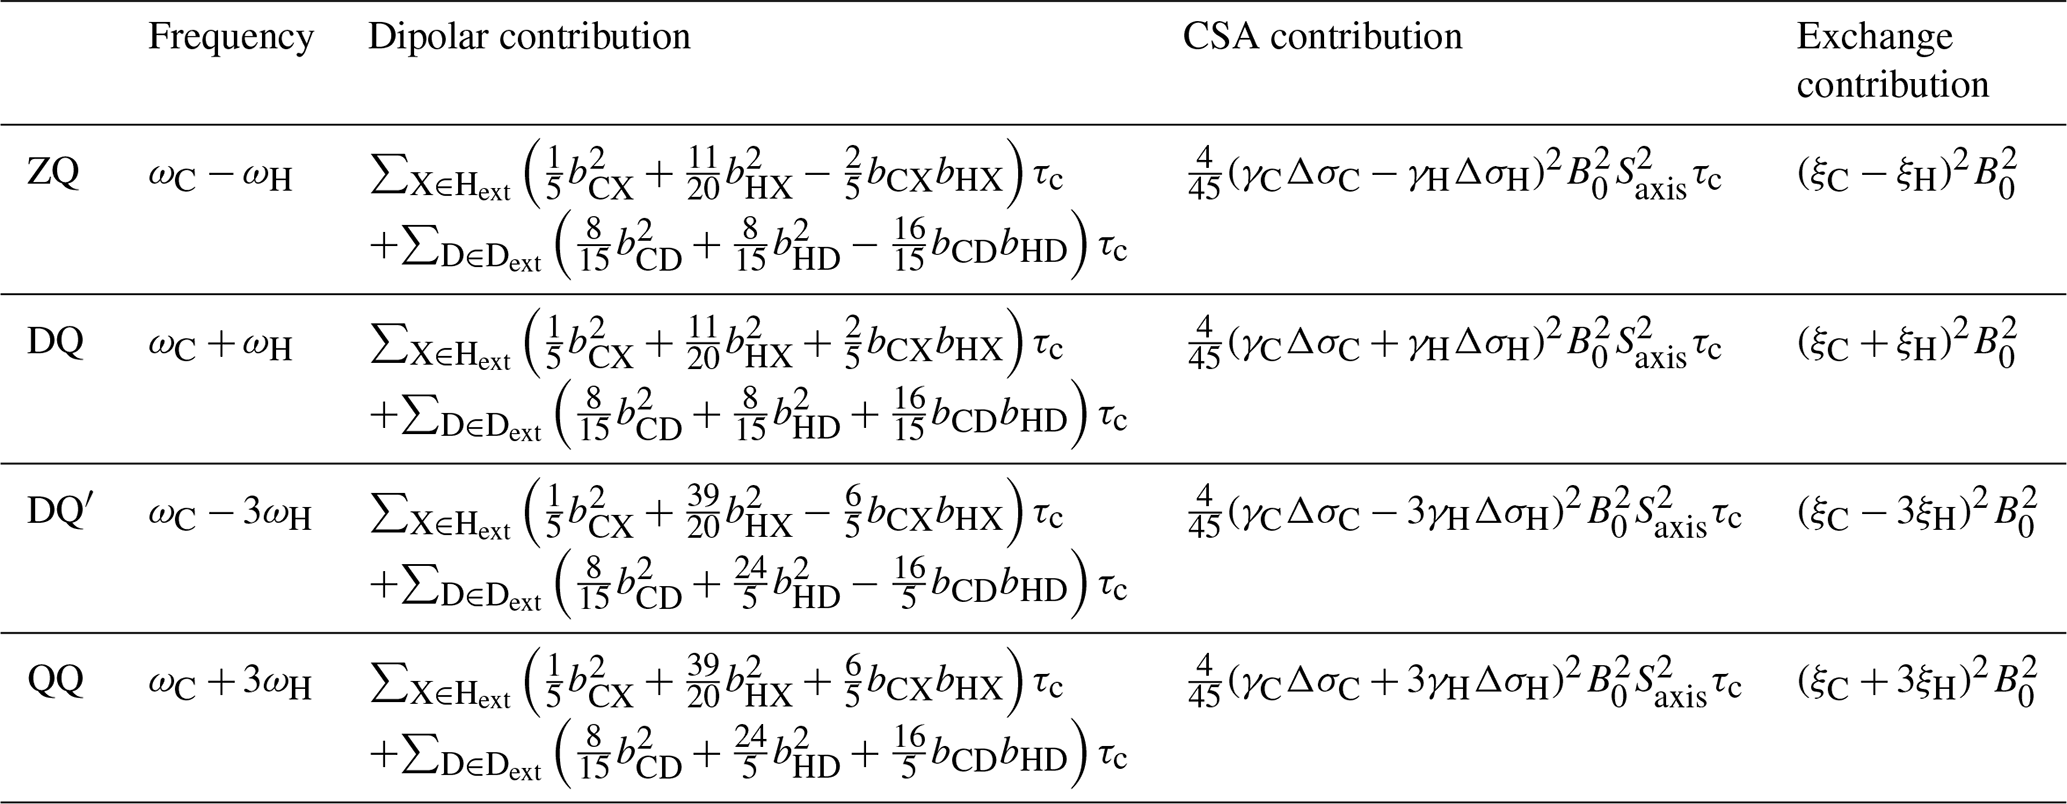
Table 1Theoretical transverse relaxation rates of selected multiple quantum methyl transitions. Expressions for relaxation rates are divided into dipolar, CSA and exchange contributions, and transitions are labelled as indicated in Fig. 1. Dipolar contributions are summed over external protons and deuterons, Hext and Dext, where bAB is the dipolar coupling between a methyl spin A and an external proton or deuteron B, , and . Exchange contributions are calculated in the fast exchange limit, where the normalised chemical shift differences ξ are defined in Eq. (3).
In this paper, we extend these analyses to higher order coherences accessible within methyl spin systems and specifically to the quadruple-quantum (QQ) and four-spin double-quantum (DQ′) transitions (Fig. 1). In this context, it is helpful to reframe the earlier analysis of the magnetic field dependence of RMQ and ΔRMQ rates in terms of the ZQ and DQ rates that are directly observed in HE experiments. The magnetic field dependences of these rates all have similar functional forms (Table 1), but the DQ′ and QQ rates have significantly higher sensitivity to 1H chemical shift differences (akin to the 1H TQ CPMG experiment; Yuwen et al., 2016). We show that the four-spin relaxation rates and RQQ can be measured with high sensitivity and that analysis of the magnetic field dependence of these rates together with RZQ and RDQ breaks the degeneracy of solutions and allows ξC and ξH to be determined unambiguously up to an overall sign. We also report improved experiments for control measurements of 1H and 13C CSAs and finally demonstrate the simultaneous analysis of field-dependent HE relaxation rates with CPMG relaxation dispersion measurements.
2.1 Theory
Transverse relaxation rates of methyl ZQ, DQ, DQ′ and QQ transitions were calculated using RedKite (Bolik-Coulon et al., 2020), in the macromolecular limit assuming rapid rotation about the 3-fold methyl symmetry axis and including 1H and 13C CSAs and interactions with external protons and deuterons (Table 1). We observe that for both four-spin coherences, DQ′ and QQ, relaxation due to intra-methyl dipolar interactions is zero, in common with the ZQ and DQ coherences traditionally selected in methyl-TROSY experiments. This contrasts with 1H TQ coherences used previously in CPMG experiments (Yuwen et al., 2016), which are relaxed strongly by intra-methyl dipolar interactions between 1H and 13C spins. However, in common with 1H TQ coherences, the DQ′ and QQ transitions remain sensitive to relaxation from dipolar interactions with external spins, and so to minimise these contributions in this work, we have used only perdeuterated, selectively methyl-labelled samples.
Contributions of chemical exchange to relaxation rates have been calculated in the limit of fast exchange (Table 1). As observed previously for the relaxation and cross-correlated relaxation of MQ coherences (Toyama et al., 2017), total relaxation rates therefore have a quadratic dependence on the static field strength, B0, and this may be measured to determine the sum of the CSA and exchange terms. Therefore, control measurements of 1H and 13C CSA values, together with the effective rotational correlation time, , are required to isolate the contribution due only to chemical exchange.
Exchange contributions to relaxation are written in the form of squared linear combinations of normalised 1H and 13C chemical shift differences (Table 1). As discussed earlier, the symmetry between ξC and ξH in ZQ and DQ coherences precludes determination of their absolute values, even up to the overall ambiguity in sign arising from the squares. However, the four-spin DQ′ and QQ coherences are substantially (effectively 9-fold) more sensitive to 1H chemical shift differences. This not only provides greater sensitivity to small chemical shift perturbations, as exploited in TQ CPMG measurements (Yuwen et al., 2016), but by breaking the symmetry between 1H and 13C terms, it becomes possible to determine ξC and ξH unambiguously (up to an overall sign) from a combined analysis of the field dependence of ZQ, DQ, DQ′ and QQ relaxation rates.
2.2 A Hahn echo super-experiment for the measurement of relaxation rates of four-spin coherences
We have developed a Hahn echo (HE) pulse sequence for the measurement of transverse relaxation rates DQ′ and QQ coherences (Fig. 2a). This is adapted from the methyl-TROSY-optimised 1H TQ CPMG experiment (Yuwen et al., 2016), with the omission of 13C 90∘ pulses flanking the relaxation period such that the magnetisation at the beginning of this period is , where {…} indicates summation over cyclic permutations. This is a mixture of coherences from which and QQ± transitions may be isolated by phase cycling of ψ1 and ψ2 (Fig. 2a). As demonstrated for the simultaneous acquisition of HZQC (heteronuclear zero quantum coherence) and HDQC (heteronuclear double quantum coherence) correlation experiments (Waudby et al., 2020), by storing individual increments of the phase program and applying receiver phase cycling post-acquisition, it is possible to acquire P- and N-type pathways for both DQ′ and QQ relaxation measurements within a single super-experiment (Schlagnitweit et al., 2010), without loss of sensitivity.
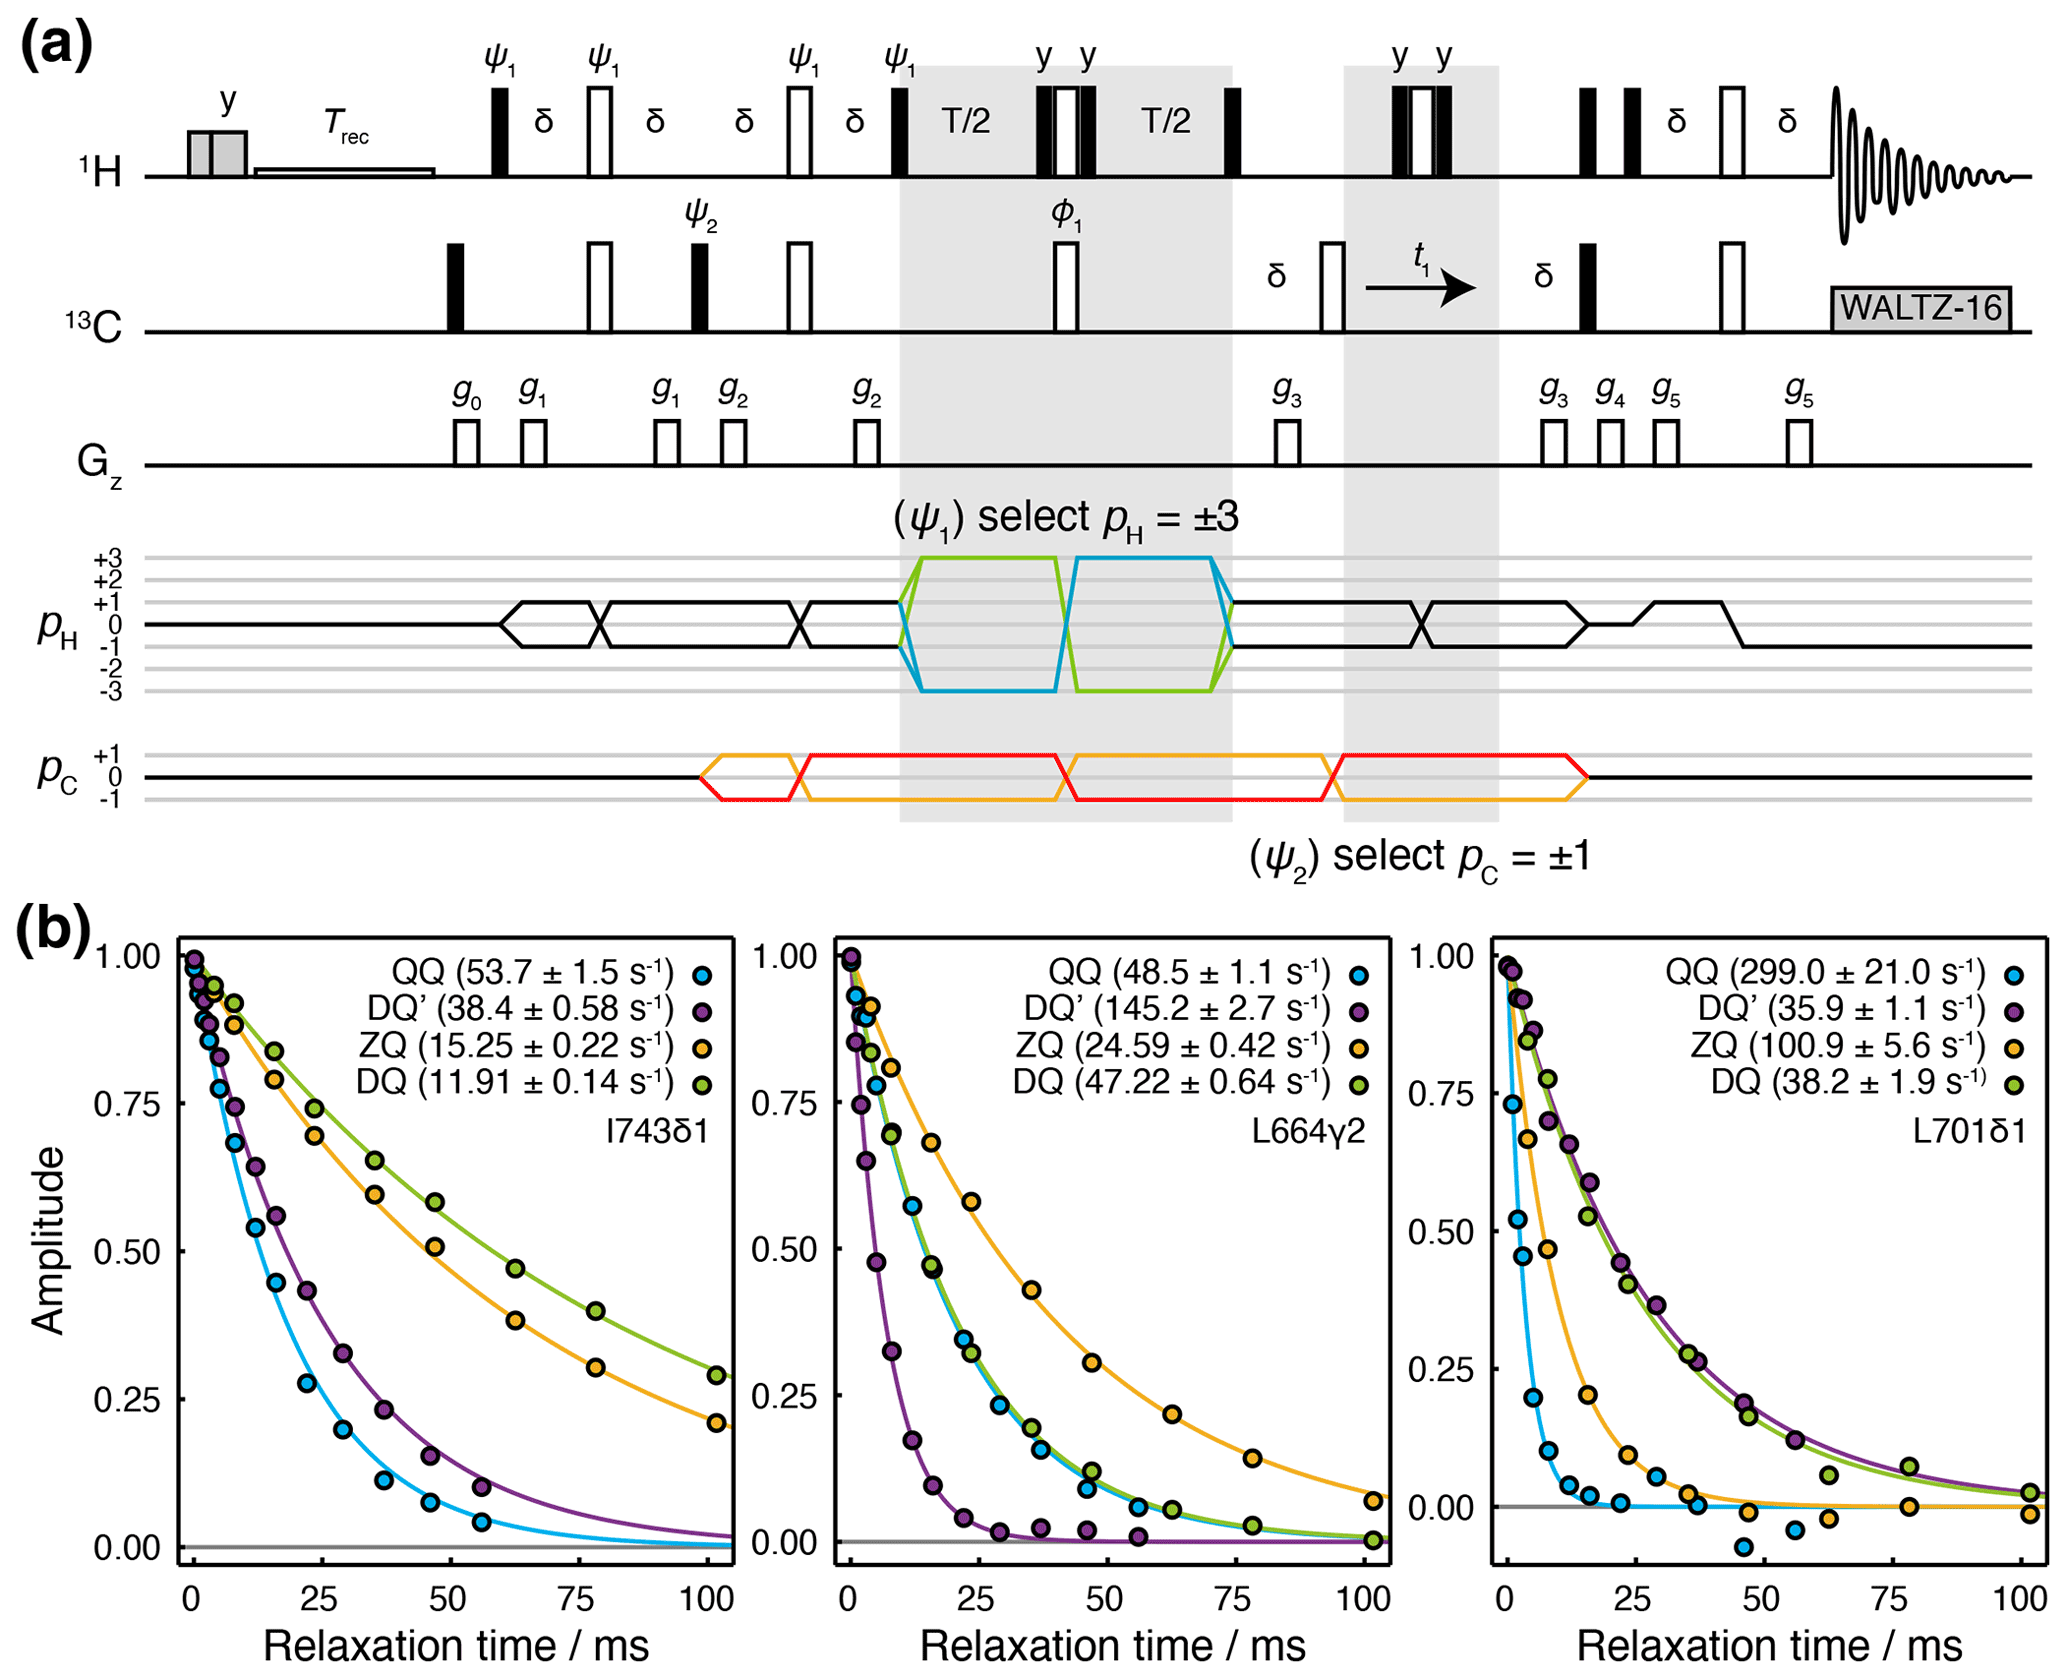
Figure 2Hahn echo measurement of R2 relaxation rates for methyl DQ′ and QQ coherences. (a) Pulse sequence and coherence transfer pathways for the simultaneous measurement of DQ′ and QQ Hahn echo relaxation rates. Individual steps of the phase cycles , , 120∘7, 240∘7, are stored and processed post-acquisition to select P- and N-type DQ′ and QQ coherence transfer pathways. T represents the relaxation time, and the delay ms. Shaded grey pulses represent consecutive 5 kHz 2 ms Hx and 3 ms Hy purge pulses before the recycle delay, Trec (with low-power presaturation applied, if required). ϕ1=x, −x; receiver phase = x. Trapezoidal gradients were applied with the following powers and lengths: g0 11 G cm−1, 1 ms; g1 14 G cm−1, 400 µs; g2 11 G cm−1, 200 µs; g4 −14 G cm−1, 300 µs; g4 −27 G cm−1, 500 µs; g5 −44 G cm−1, 700 µs. (b) HE relaxation measurements of four-spin DQ′ and QQ coherences for methyl groups in ILV-labelled FLN5 (800 MHz, 283 K). Measurements of ZQ and DQ HE relaxation rates are also shown and were acquired using established methods (Gill and Palmer, 2011). Values of fitted relaxation rates are shown in the legends, with uncertainties indicating the standard error derived from fitting.
The sequence is demonstrated here using a sample of [2H,13CH3-ILV]-labelled FLN5, the fifth immunoglobulin domain from the Dictyostelium discoideum filamin protein, comprising 108 residues. Measurements of relaxation rates were carried out at four static field strengths (600, 700, 800 and 950 MHz), and high-quality correlation spectra were obtained (Fig. S1 in the Supplement) and fitted to determine DQ′ and QQ relaxation rates (Tables S1 and S2). ZQ and DQ relaxation rates were also measured using established methods (Gill and Palmer, 2011) (Tables S3 and S4). Measurements for representative methyl groups are plotted in Fig. 2b. Fitted relaxation rates span a wide range of values, from approximately 10 to 300 s−1. We observe no fixed ordering of the various relaxation rates, and indeed in some cases, four-spin relaxation rates are slower than ZQ or DQ rates (e.g. for DQ′ relaxation in L701CD1, Fig. 2b, right-hand panel).
2.3 Measurement of methyl group dynamics and 13C chemical shift anisotropy
We next sought to determine the CSA contribution to the observed relaxation rates (Table 1), in order to isolate the exchange contribution for further analysis. Methyl 13C CSA values can be determined by analysis of cross-correlated relaxation between the 13C CSA and the 1H 13C dipolar interaction in 13C SQ transitions, which results in differential relaxation between inner or outer lines within the 13C quartet (Liu et al., 2003; Tugarinov et al., 2004). 13C CSA values have previously been measured in isolated methyl groups using constant-time 1H-coupled HSQC (heteronuclear single quantum coherence) experiments, in which the length of the constant-time delay is varied, and the relaxation of inner or outer lines fitted to exponential functions to determine the cross-correlated relaxation rate, ηC, from which the 13C CSA, ΔσC, can be derived (Tugarinov et al., 2004):
While this measurement strategy is effective, overlap of multiplets between adjacent methyl resonances can limit the ability to resolve the relaxation of individual transitions. A pseudo-4D variant has been developed in which the coupling is evolved in a third frequency dimension (Toyama et al., 2017), but this can require substantial measurement time. Here we suggest an alternative approach, in which an additional relaxation delay is incorporated into a non-constant-time 1H-coupled HSQC experiment (Fig. 3a). Based on our analysis of the standard 1H-coupled HSQC experiment (Waudby et al., 2021), and fully incorporating the effects of relaxation and cross-correlated relaxation throughout the pulse sequence, the entire multiplet lineshape may be expressed as a function of the 1H and 13C chemical shifts (determined from a regular HMQC spectrum), 1H and 13C relaxation rates, the scalar coupling 1JCH≈125 Hz and the parameters of interest, and ΔσC. This expression may be used to fit 2D spectra obtained at multiple relaxation delays, to estimate the parameters and ΔσC simultaneously. By avoiding constant-time evolution periods, this approach provides higher sensitivity, while the parametric estimation strategy allows analysis even of highly overlapped resonances, in contrast to measurements of the decay of individual multiplet components.
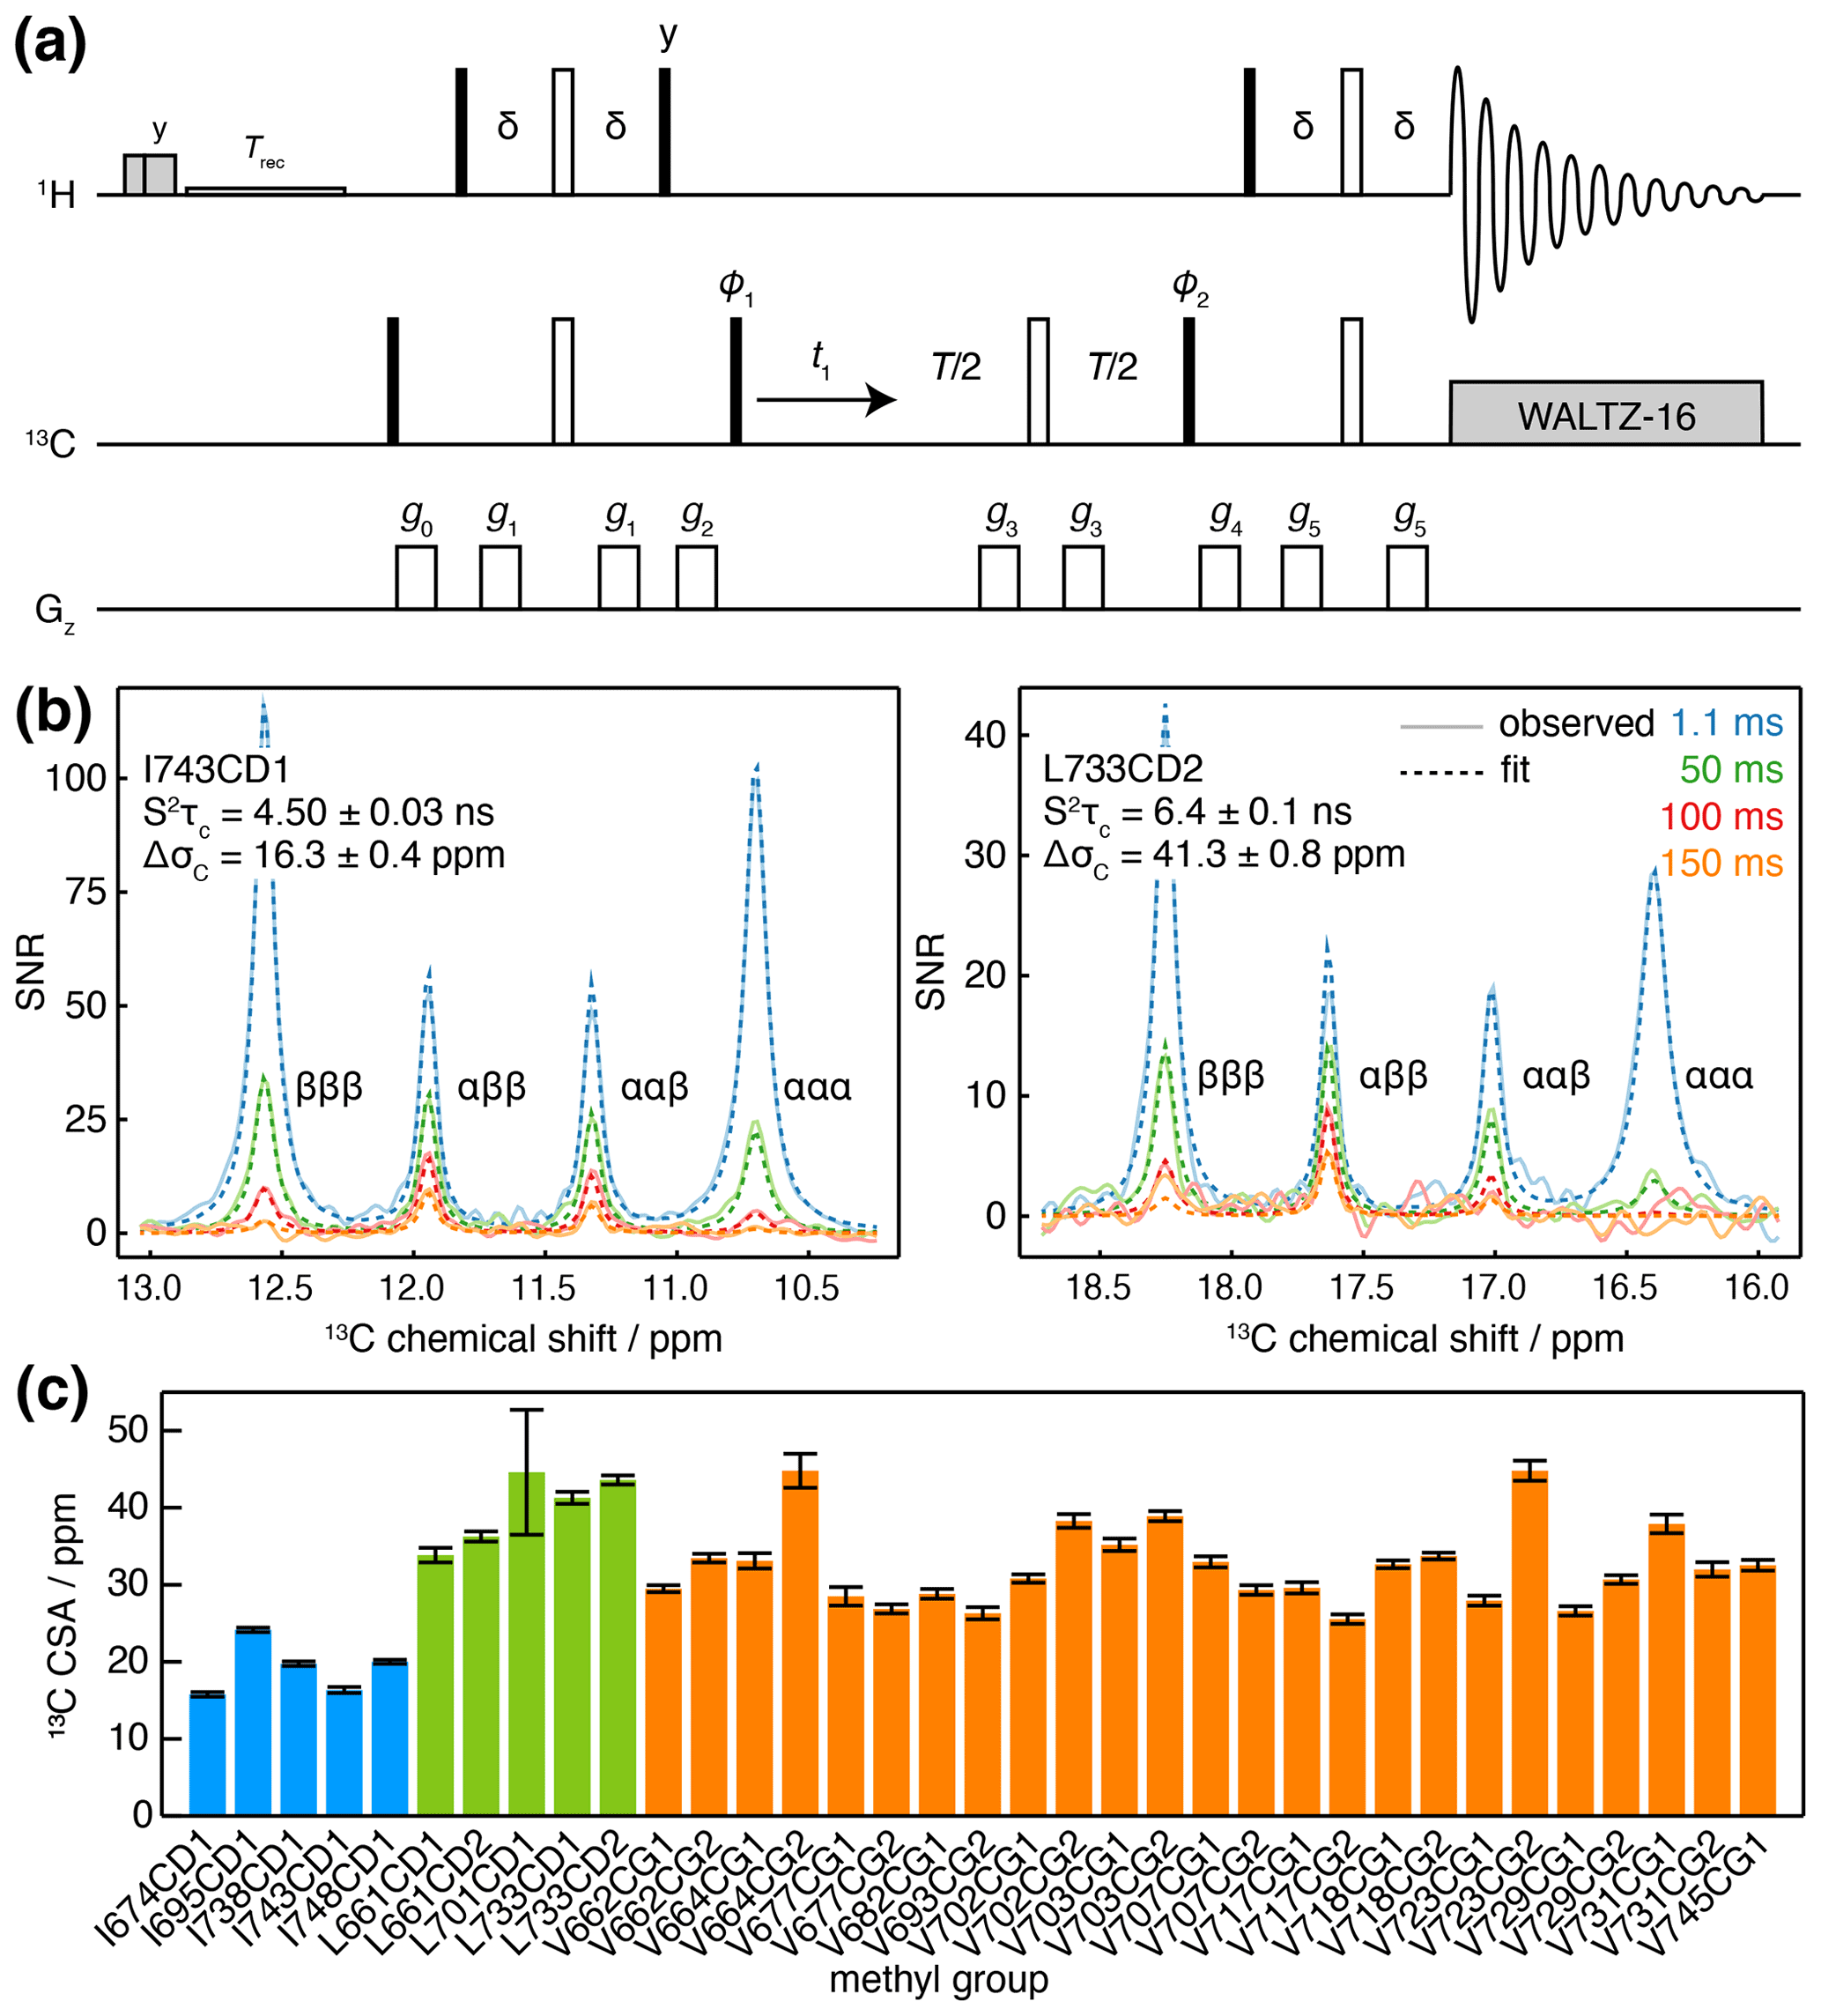
Figure 3Measurement of methyl 13C CSA and . (a) 1H-coupled HSQC with 13C Hahn echo. T represents the relaxation time, and the delay ms. Shaded grey pulses represent consecutive 5 kHz 2 ms Hx and 3 ms Hy purge pulses before the recycle delay, Trec (with low-power presaturation applied, if required). ϕ1=x, −x; ϕ2=x, x, −x, −x; receiver phase = x, −x, −x, x. Trapezoidal gradients were applied with the following powers and lengths: g0 25 G cm−1, 1 ms; g1 7 G cm−1, 1 ms; g2 9 G cm−1, 1 ms; g3 22 G cm−1, 300 µs; g4 18 G cm−1, 1 ms; g5 16 G cm−1, 1 ms. States-TPPI quadrature detection in t1 was achieved by incrementation of ϕ1. (b) Cross-sections through 13C multiplets of isolated FLN5 methyl groups measured according to the pulse sequence in panel (a), with relaxation delays as indicated, acquired at 283 K, 950 MHz (1H Larmor frequency). Cross-sections through the fitted spectra are also shown by dashed lines, with the fitted values of and ΔσC indicated. (c) Measured values of methyl 13C CSA in FLN5, 283 K, coloured according to the residue type. Error bars indicate the standard error determined from fitting.
Measurements were acquired for ILV-labelled FLN5 at 800 MHz, using four relaxation delays from 1 to 150 ms. Clusters of overlapping multiplets were detected, and the pseudo-3D data for each cluster were then fitted to analytical expressions for the lineshape to determine and ΔσC. Our observations fitted theoretical expectations closely, and for well-resolved resonances, fits can be visualised as one-dimensional cross-sections (Fig. 3b), while fits of multiple overlapping resonances are shown in Fig. S2. Values of determined in this manner were in good agreement with control measurements of the cross-correlated relaxation-induced build-up of 1H TQ magnetisation (Sun et al., 2011) (R2=0.97, with gradient = 0.861 ± 0.096 and offset = 0.93 ± 0.98 not significantly different from 1 and 0 respectively; Fig. S3). In line with previous reports (Tugarinov et al., 2004), 13C CSA values we determined varied depending on residue type (Fig. 3c), with mean values (± SD) for isoleucine of 19.2 ± 3.4 ppm, leucine of 39.9 ± 4.7 ppm and valine 32.4 ± 5.2 ppm. Full results, including , are presented in Table S5.
2.4 Measurement of methyl 1H chemical shift anisotropy
The methyl 1H CSA, ΔσH, can be determined from the differential relaxation of 1H doublets due to cross-correlated relaxation between the 1H CSA and the 1H 13C dipolar interaction. This can be measured using an HMQC experiment incorporating a 1H Hahn echo and a filter to exclude the outer lines of the 13C multiplet (Tugarinov et al., 2004), but in common with measurements of the 13C CSA, overlap between multiplets can be a problem. While this can again be avoided using a pseudo-4D experiment (Toyama et al., 2017), here we present a simple alternative that uses an IPAP filter to isolate 13C spin states (Fig. 4a). This allows measurement of their relaxation rates, Rα and Rβ, from which the cross-correlated relaxation rate ηH and the 1H CSA may be determined (Eq. 7).
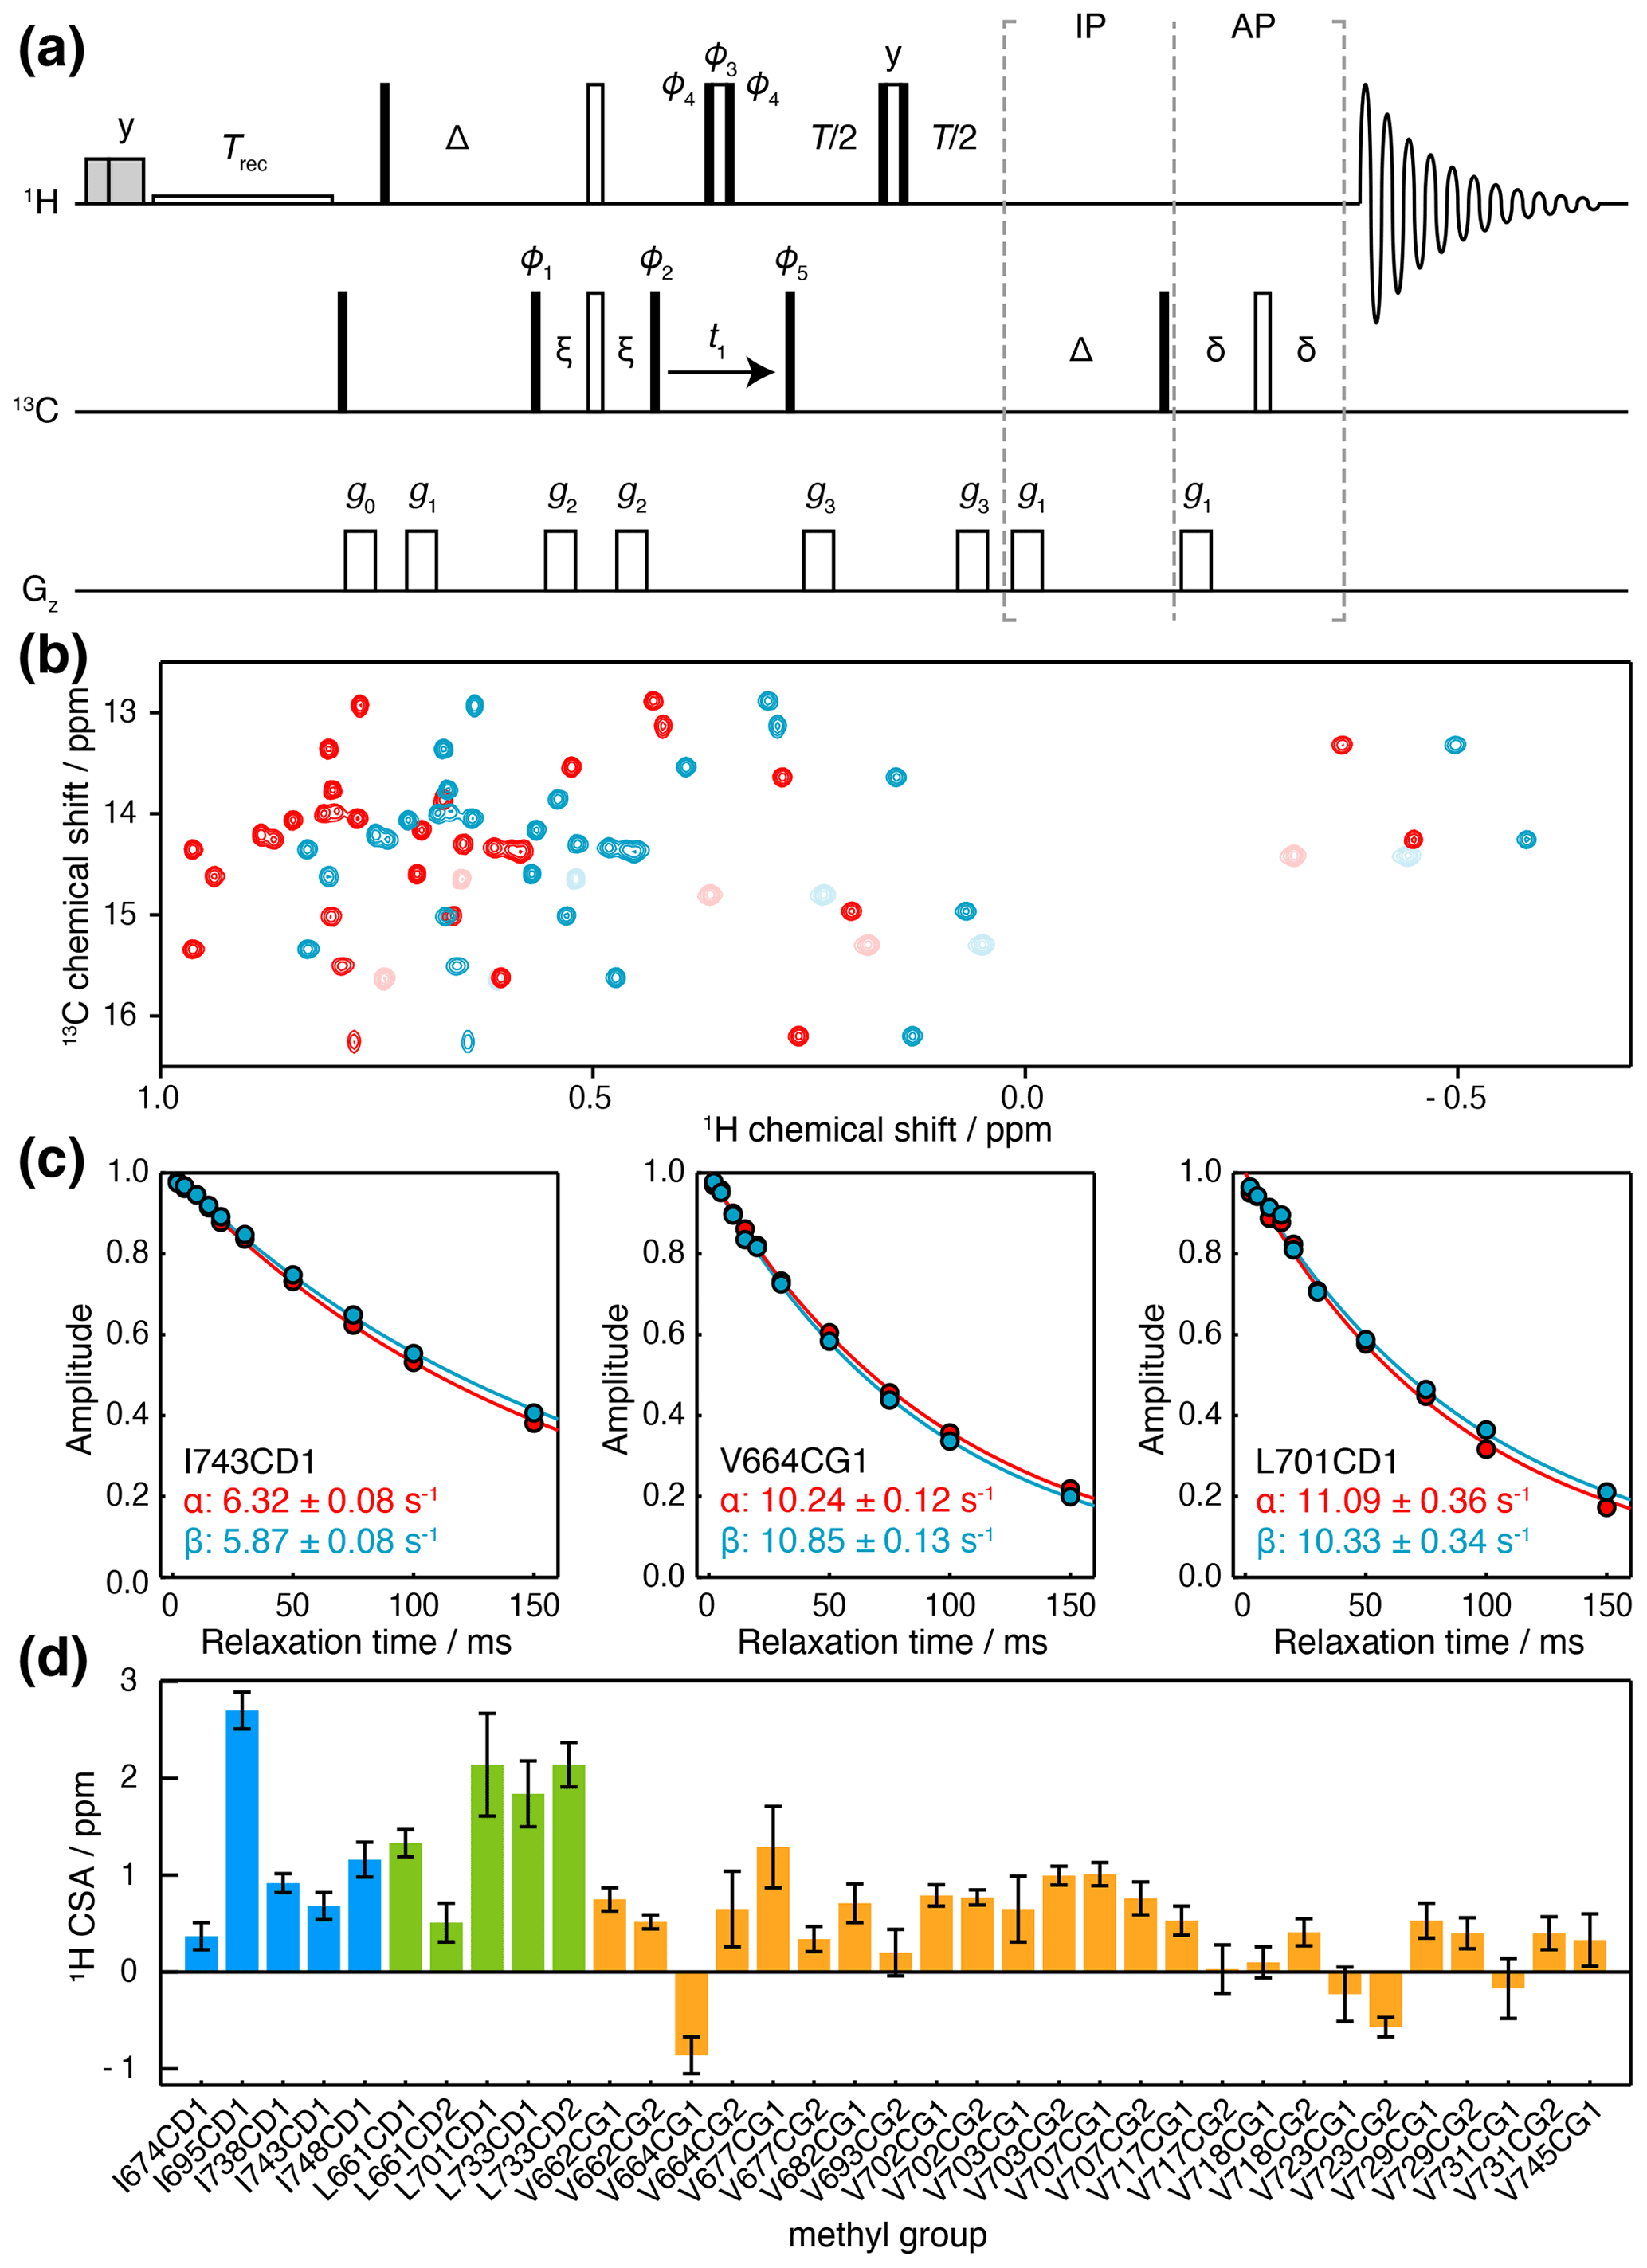
Figure 4Measurement of methyl 1H CSA values. (a) IPAP HE pulse sequence for the measurement of 13C spin-state-selective 1H relaxation rates. Interleaved experiments are acquired using IP/AP blocks as indicated, and the sum and difference are then calculated to isolate 13C |α〉 and |β〉 spin states. Delays ms, ms, ms. Shaded grey pulses represent consecutive 5 kHz 2 ms Hx and 3 ms Hy purge pulses before the recycle delay, Trec (with low-power presaturation applied, if required). ϕ1=x, −x; ϕ2=(y)4, (−y)4; ϕ3=y, y, −x, −x, −y, −y, x, x; ϕ4=x, x, y, y, −x, −x, −y, −y; ϕ5=x; receiver phase = x, −x, −x, x. States-TPPI quadrature detection in t1 was achieved by incrementation of ϕ5. Trapezoidal gradients were applied with the following powers and lengths: g0 31 G cm−1, 1 ms; g1 3.9 G cm−1, 1 ms; g2 −22 G cm−1, 300 µs; g3 16 G cm−1, 300 µs. (b) Spectra of FLN5, 283 K, acquired at 950 MHz (1H Larmor frequency) using the pulse sequence in panel (a), and a relaxation delay of 2 ms. Spectra corresponding to 13C |α〉 and |β〉 spin states are plotted in red and blue respectively. Light colours indicate negative, folded signals originating from isoleucine methyl groups. (c) Spin-state-selective relaxation of representative resonances, with fitted rates as indicated. (d) Measured 1H CSA values for FLN5, 283 K, coloured by residue type (Table S5). Error bars indicate the standard error propagated from fits to Eq. (7).
Relaxation measurements were acquired for ILV-labelled FLN5 at 950 MHz, and high-quality sub-spectra were obtained corresponding to 13C |α〉 and |β〉 spin states (Fig. 4b), from which the relaxation rates Rα and Rβ could be measured (Fig. 4c). We note that the use of high magnetic field strengths is particularly important for these measurements given the small size of the 1H CSA, resulting in differences in relaxation rates typically less than 1 s−1 (Fig. 4c). Combining these measurements with earlier measurements of , 1H CSA values could be determined (Eq. 7) with a precision of ca. 0.2 ppm (Fig. 4d, Table S5). 1H CSA values also depended on the residue type, although not as strongly as for the 13C CSA, with mean values (± SD) of 0.61 ± 0.55 ppm for isoleucine, 0.79 ± 0.33 ppm for leucine, and 0.29 ± 0.28 ppm for valine.
2.5 Analysis of chemical exchange through field-dependent HE relaxation rates
Having carried out measurements of ZQ, DQ, DQ′ and QQ HE relaxation rates in FLN5 at multiple magnetic field strengths, together with control measurements of CSA, we sought to analyse the data quantitatively in terms of chemical exchange. Assuming fast exchange, we performed linear regression of HE relaxation rates vs (Fig. 5a, b), from which measured CSA contributions were then subtracted in order to provide estimates of (ξC±ξH)2 and (ξC±3ξH)2 (Table 1). Each of these four measurements represents a pair of lines, corresponding to the positive and negative roots, in (ξH,ξC) parameter space (Figs. 5c, d and S4). The points at which all four lines intersect indicate the values of ξH and ξC consistent with the complete set of relaxation data. The linearity of the observed relaxation rates vs (Fig. 5a, b), together with the closeness of the intersection between all four lines (Fig. 5c, d), validates our assumption of a fast exchange process underlying the observed relaxation behaviour. We note that exchange involving a third state, in which exchange-induced fluctuations in 1H and 13C chemical shift are no longer correlated, would also result in lines that do not intersect (discussed further in the Supplement and Fig. S5).
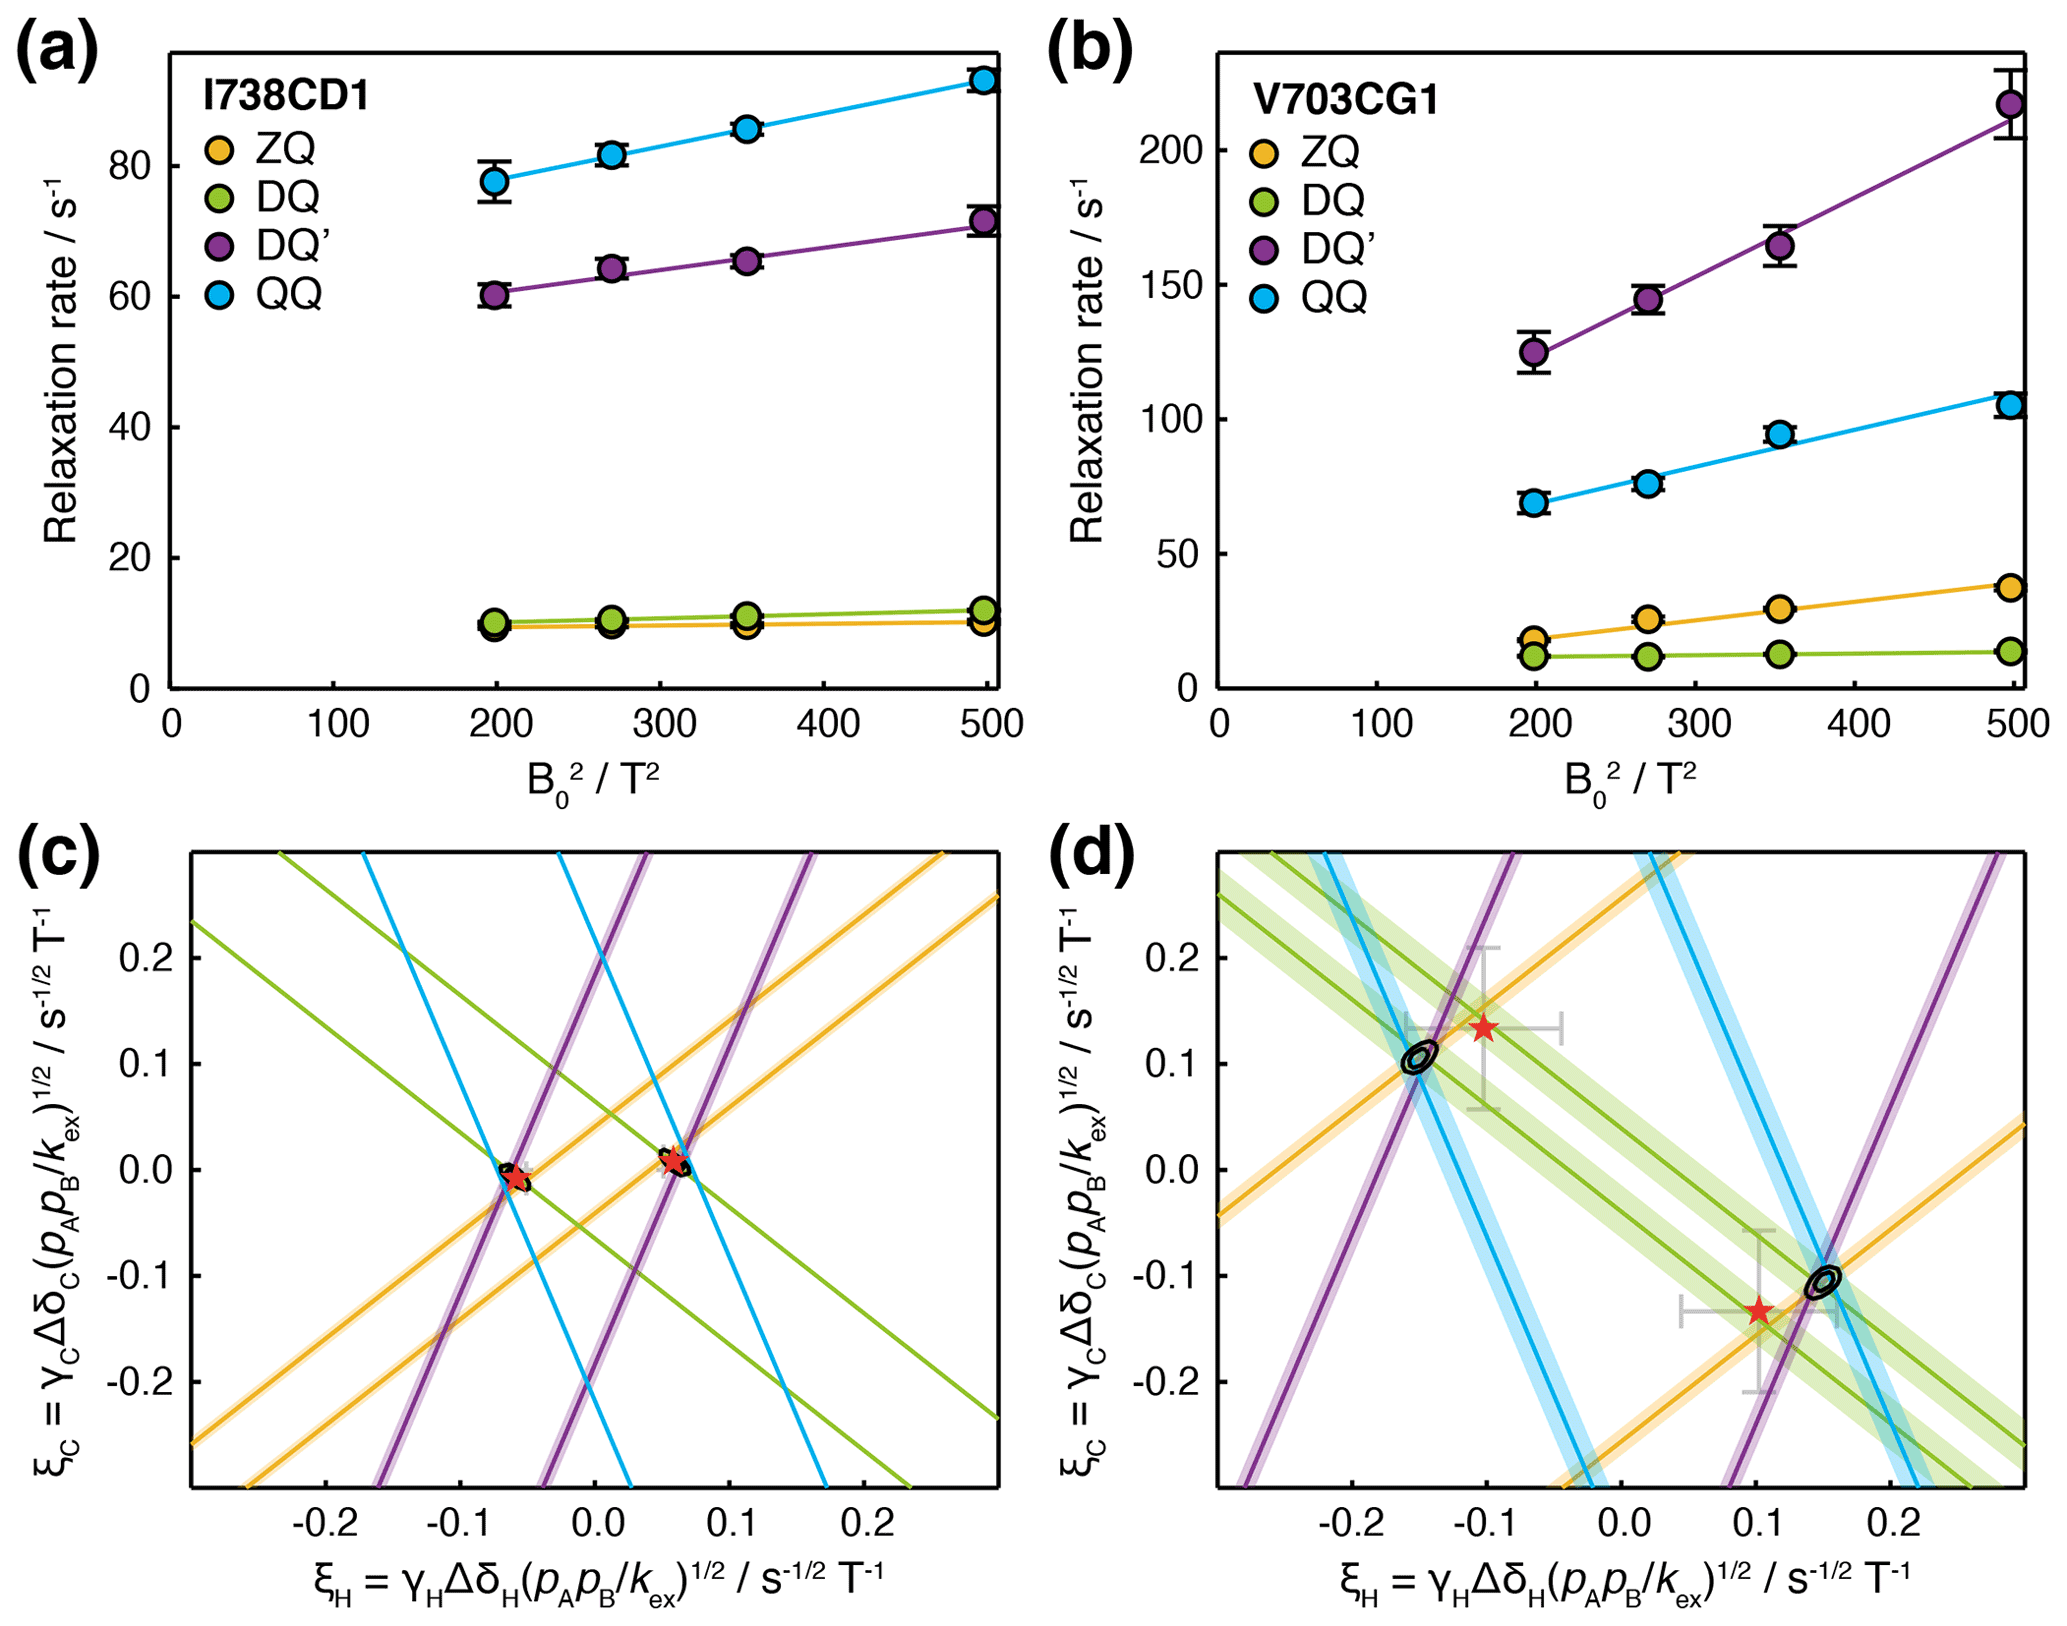
Figure 5Analysis of magnetic field dependence of HE relaxation rates. (a, b) Linear regression analysis of methyl ZQ, DQ, DQ′ and QQ HE relaxation rates as a function of , for (a) I738CD1 and (b) V703CG1 resonances. Error bars indicate the standard error determined from curve fitting of relaxation measurements. (c, d) Visualisation of constraints on (ξH,ξC) parameter space arising from HE measurements. Straight lines indicate values of ξH and ξC consistent with HE measurements in the upper panels, calculated according to Table 1 assuming fast exchange and subtracting measured CSA contributions. Shading indicates the standard error propagated from linear regression analysis and CSA measurements. Black contours indicate 68 % and 95 % confidence intervals in ξH and ξC, based on all four HE measurements and assuming two-state fast exchange. Red symbols indicate ξH and ξC parameters derived from global fitting of HE and CPMG data (Fig. 6).
To evaluate the uncertainty in the position of intersection points, χ2 surfaces can be calculated as a function of ξH and ξC (Fig. 5c, d, black contours). The location of the minimum on this surface for a given methyl group indicates the optimal values of ξH and ξC, but in the absence of additional information, it is not possible to deconvolute structural information (i.e. the chemical shift perturbations ΔδH and ΔδC) from thermodynamic and kinetic terms. However, if several resonances are involved in the same exchange process, then ξH and ξC can be compared, at least in relative terms, to provide structural insight.
2.6 Global analysis of HE relaxation and CPMG relaxation dispersion measurements
To resolve the ambiguity in chemical shift changes, thermodynamics and kinetics inherent in ξ values, we explored the joint analysis of field-dependent HE relaxation together with MQ and 1H SQ CPMG relaxation dispersion measurements (Korzhnev et al., 2004b; Yuwen et al., 2019) (Fig. 6a, b). While large MQ dispersions were observed for several methyl resonances, 1H SQ dispersions were generally small, which indicated the potential utility of DQ′ and QQ data in providing increased sensitivity to small 1H chemical shift differences. Inspection of individual CPMG traces indicated clearly that two separate groups of methyl resonances, located in distinct regions of the molecule, were undergoing exchange with different rates and populations (e.g. I743CD1 located in the G strand and L701CD1 located in the C/D hairpin; Fig. 6a, b).

Figure 6Joint analysis of field-dependent HE and CPMG measurements in FLN5. (a, b) MQ and 1H SQ CPMG relaxation dispersion measurements (Korzhnev et al., 2004b; Yuwen et al., 2019) for (a) I743CD1 and (b) L701CD1 resonances. Error bars indicate standard errors derived from the spectrum noise. Solid lines show global fits in conjunction with HE measurements. (c, d) Magnetic field dependence of multiple quantum HE relaxation rates of (c) I743CD1 and (d) L701CD1 resonances. Error bars indicate standard errors determined from curve fitting. Solid lines show global fits to Eq. (11) in conjunction with CPMG measurements, with best fit parameters as shown; the sign of ΔδC has been assumed to be positive. (e) Stereoview projection of fitted methyl chemical shift differences, , on the crystal structure of FLN5 (1qfh, McCoy et al., 1999).
CPMG and HE data for multiple residues were fitted simultaneously to determine 1H and 13C chemical shift differences, the population of the intermediate state and the exchange rate (Table S6). Given the additional kinetic information available from the CPMG experiment, we may relax our earlier assumption of fast chemical exchange (Table 1). Exchange contributions to HE measurements were therefore calculated directly from the dominant eigenvalue of the Liouvillian superoperator (Palmer and Koss, 2019), and data are plotted against B0 directly rather than . In general, we note that the comparison of multiple quantum HE relaxation rates will provide useful additional information in all exchange regimes, except when all transitions are in very slow exchange, at which point the exchange contribution to relaxation rates Rex=kAB (lifetime line broadening), irrespective of the frequency difference (Wang and Palmer, 2002).
Good-quality fits were obtained for all resonances, indicating the mutual consistency of HE and CPMG measurements (Figs. 6a–d and S6). We suggest that residual oscillations in some CPMG traces (e.g. Fig. 6b) are likely to reflect the impact of pulse imperfections and off-resonance effects, which in the future could be handled by more detailed calculations. HE and CPMG data for resonances within the first cluster of exchanging methyl groups, located between the A and G strands (Fig. 6e, red–yellow colouring), fitted closely to a two-state exchange model with an intermediate population of 2.9 ± 0.2 % and an exchange rate of 872 ± 41 s−1 (Fig. 6a, c). Exchange within the second cluster, located around the C/D hairpin (Fig. 6e, cyan–magenta colouring), was more rapid, with a fitted exchange rate of 6900 ± 360 s−1 (Fig. 6b, d). As expected for resonances in fast exchange (Palmer and Massi, 2006), the fitted chemical shift differences and intermediate state population were strongly correlated, which results in the large uncertainties reported. Nevertheless, for both clusters, ξ values back-calculated from the fit results were consistent with our previous analysis of HE data alone (Fig. 5c, d, red symbols).
The study of methyl groups is of fundamental importance to modern biomolecular NMR spectroscopy, both in proteins and in labelled nucleic acids (Abramov et al., 2020; Kerfah et al., 2015; Rosenzweig and Kay, 2014). Methyl 13CH3 spin systems provide a complex set of energy levels (Fig. 1), and in this work we have utilised the maximum range available, describing the first applications of four-spin double- and- quadruple-quantum coherences to the study of biomolecular dynamics.
Building on earlier analyses of relaxation and cross-correlation relaxation of multiple quantum coherences (Gill et al., 2019; Gill and Palmer, 2011; Kloiber and Konrat, 2000; Toyama et al., 2017), by measuring the dependence of ZQ, DQ, DQ′ and QQ HE relaxation rates on the static magnetic field strength, we have demonstrated the ability to unambiguously determine the relative chemical shift perturbations of sparsely populated intermediate states (up to an overall sign). The analysis of DQ′ and QQ relaxation also provides increased sensitivity to small 1H chemical shift differences. This is particularly important as these tend to be smaller than associated 13C chemical shift differences: 1H chemical shifts are determined primarily by magnetic anisotropy and ring current effects (Li and Brüschweiler, 2012), while 13C chemical shifts are additionally and strongly affected by rotamer distributions through the γ-gauche effect (Hansen et al., 2010). We have also demonstrated the joint analysis of HE and CPMG relaxation dispersion measurements (O'Connell et al., 2009), which provides greater detail on the thermodynamics and kinetics of the exchange process, and indeed on the existence of multiple excited states, than can be determined from analysis of HE data alone. We suggest that the combination of HE and MQ CPMG measurements may be a particularly useful pairing to provide precise estimates of both 1H and 13C chemical shift differences while avoiding insensitive DQ or TQ 1H CPMG experiments (Gopalan et al., 2018; Yuwen et al., 2016). However, HE measurements alone may also be useful in extending the analysis of dynamics in methyl groups beyond the timescales accessible to CPMG experiments.
It is interesting to observe that the four-spin DQ′ and QQ transitions, in common with the inner ZQ and DQ methyl-TROSY transitions (Fig. 1), have zero relaxation due to intra-methyl dipolar interactions (Table 1). While the four-spin transitions are certainly more sensitive to relaxation through dipolar interactions with protons from other methyl groups, this effect nevertheless leads to an unexpectedly low exchange-free relaxation rate, particularly in comparison to 1H DQ or TQ transitions previously used in CPMG experiments (Gopalan et al., 2018; Yuwen et al., 2016), which in turn leads to greater sensitivity to the effects of chemical exchange.
We have described a new super-experiment (Schlagnitweit et al., 2010) for the simultaneous measurement of these DQ′ and QQ relaxation rates (Fig. 2a). This approach, in which individual phase cycle steps are stored during acquisition and recombined during processing, was also recently applied to the simultaneous measurement of HZQC and HDQC correlation spectra (Waudby et al., 2020). In both instances, the total time required to acquire the pair of experiments is halved without any compromise to the quality of the individual measurements. Indeed, the IPAP scheme we have described here for measurement of the 1H CSA (Fig. 4a) can also be regarded as a form of super-experiment, containing two individual experiments for the measurement of spin-state-dependent 1H relaxation rates. The traditional on-the-fly implementation of receiver phase cycling during acquisition is simply a relic of the high cost of data storage in the past, with no practical benefits, and we would echo calls for the storage of individual free induction decays for processing post-acquisition to become more systematically implemented in modern software (Schlagnitweit et al., 2012).
A number of experiments have been reported for the measurement of the 13C CSA, ΔσC (Toyama et al., 2017; Tugarinov et al., 2004). Here, building on our previous analysis of cross-correlated relaxation in 1H-coupled HSQC experiments (Waudby et al., 2021) together with developments in two-dimensional lineshape fitting (Waudby et al., 2016), we have described an alternative approach based on pseudo-3D lineshape fitting of a relaxation-weighted 1H-coupled HSQC to simultaneously determine and ΔσC (Fig. 3). is encoded in the relative intensities of inner and outer lines in the 13C quartet, while ΔσC is encoded by the relative intensity of up- and down-field lines. We have shown previously that can be measured accurately up to correlation times of at least 100 ns (Waudby et al., 2021). Moreover, since peak positions can be accurately determined from a fully decoupled 2D spectrum, and 1JCH scalar couplings are largely uniform, we have found that the analysis of overlapping resonances or crowded regions of a spectrum is in practice not as severe a problem as might be expected. Nevertheless, in larger systems, it may be useful to measure independently using alternative methods (Sun et al., 2011) and use lineshape fitting to determine only ΔσC or indeed to employ pseudo-4D experiments to resolve the quartet structure separately (Toyama et al., 2017).
Notwithstanding the above discussion, it is useful to examine the necessity of measuring 13C and 1H CSA values for individual methyl groups at all. Considering a methyl group in exchange with ΔδC=1.5 ppm, ΔδH=0.2 ppm, pB=0.1, kex=5000 s−1 and ns, given the mean and standard deviation of 13C and 1H CSA values determined for valine residues above (34.2 ± 5.2 and 0.29 ± 0.28 ppm respectively), the impact of the 13C and 1H CSAs on relaxation rates is 10.7 ± 1.6 % and 0.7 ± 0.7 % respectively relative to the exchange terms. Therefore, while it is clearly important not to neglect the impact of the 13C CSA, the use of an average value contributes an uncertainty only on the order of a single percent. In practical terms, this indicates that for most purposes it is likely sufficient to use average values for the CSAs and measure only , thus simplifying the application of the methods described in this paper.
Quadruple-quantum coherences have been utilised previously in biomolecular NMR for the identification of methyl resonances in 1H–13C correlation spectra, via heteronuclear quadruple-quantum correlation (HQQC) and quadruple-quantum-filtered HMQC experiments (Diercks et al., 1998; Kessler et al., 1991). Their effective high gyromagnetic ratio (3γH+γC) has also been used to increase the sensitivity of stimulated echo diffusion measurements (Zheng et al., 2009). However, we can envisage and are currently exploring further applications of these coherences to the analysis of dynamics. Given the favourable relaxation properties of these transitions (at least, in perdeuterated molecules), HQQC experiments may prove useful in enhancing the sensitivity of titration measurements to chemical exchange, complementing our earlier work on the two-dimensional lineshape analysis of HSQC, HMQC, HZQC and HDQC experiments (Waudby et al., 2020). Similarly, we expect that the four-spin analogue of the HMQC, in which a mixture of DQ′ and QQ coherences are evolved during t1, may provide a useful complement to HMQC and HSQC experiments, as well as 13C-detected SQ, DQ and TQ experiments, in determining the absolute sign of the chemical shift differences to sparsely populated intermediate states (Gopalan and Vallurupalli, 2018; Skrynnikov et al., 2002).
Finally, we anticipate further developments will emerge in the analysis of field-dependent HE relaxation rates. We have demonstrated the joint analysis of HE data with CPMG measurements for residues undergoing two-state exchange (Fig. 6) (O'Connell et al., 2009), but applications to more complex multi-state mechanisms should be possible using the same approach, based on analysis of the Liouvillian superoperator. Analysis in combination with other experiment types should also be possible, for example, adiabatic relaxation dispersion (Chao et al., 2019). Further, while in this work we have focussed only on the gradients obtained from regression of relaxation rates with respect to , the intercepts (i.e. at zero field) also contain information on relaxation rates in the absence of exchange that could be used to constrain analyses of CPMG or similar data (O'Connell et al., 2009; Phan et al., 1996; Wang et al., 2001). Even in systems such as amides restricted to two-spin coherences, ZQ and DQ HE data provide restraints that we have now demonstrated can be applied in conjunction with CPMG measurements. SQ HE measurements, which we have not explored in this work, could also provide additional restraints and remove the ambiguity of multiple solutions illustrated in Fig. 5c and d. Together, these methods may provide new approaches for the analysis of correlated motions in extended systems, for example, across nucleic acid base pairs (Chiarparin et al., 2001), within protein sidechains (Früh et al., 2001) or between adjacent residues in polypeptide backbones (Lundstrom et al., 2005).
4.1 Sample preparation
U-[2H]; Ileδ1-[13CH3]; Leu, Val-[non-stereospecific 13CH3 12CD3]-labelled FLN5 was expressed and purified as previously described (Cabrita et al., 2016), to yield a sample with a final concentration of 100 µM in Tico buffer (10 mM d8-HEPES, 30 mM NH4Cl, 12 mM MgCl2, pH 7.5, 100 % D2O).
4.2 NMR spectroscopy
NMR measurements were acquired using Bruker Avance III HD spectrometers running Topspin 3.5pl6, equipped with cryoprobes and operating at 1H Larmor frequencies of 500, 600, 700, 800 and 950 MHz. Data were acquired at 283 K, which was calibrated between spectrometers using a sample of d4-methanol (Findeisen et al., 2007). 1H,13C correlation spectra were typically acquired with a sweep width of 16 ppm and acquisition time of ca. 100 ms in the direct dimension and a sweep width of 15 ppm (or, if isoleucine resonances are folded, 8 ppm) and acquisition time of ca. 35 ms in the indirect dimension, centred at offsets of 0.4 and 16.7 ppm respectively. The complete set of measurements across all field strengths was acquired in 3 d, or 4.5 d including CPMG experiments (Table S7). Data were processed on NMRbox (Maciejewski et al., 2017) using nmrPipe (Delaglio et al., 1995), viewed using Sparky (Lee et al., 2015) and analysed using FuDA (https://www.ucl.ac.uk/hansen-lab/fuda/, last access: 20 October 2021) and Julia 1.5 (Bezanson et al., 2017) using the NMRTools.jl package (Waudby, 2021). The assignment of FLN5 methyl resonances was obtained from the BMRB (entry 15814) (Hsu et al., 2009).
4.2.1 Measurement of Hahn echo relaxation rates
Hahn echo measurements of QQ and DQ′ relaxation rates were acquired at 600, 700, 800 and 950 MHz using the pulse sequence described in Fig. 2a. Recycle delays of 1 s (700, 800, 950 MHz) and 1.5 s (600 MHz) were used, with 4.5 kHz WALTZ-16 13C decoupling during acquisition. A single scan was recorded for each of the 21 steps in the ψ1 and ψ2 phase cycle, before looping over relaxation delays and then the 13C chemical shift evolution. Measurements were acquired for the following relaxation times: 0.1, 1, 2, 3.5, 5.5, 8, 11, 15, 20, 26, 33, 41, 50 and 60 ms (600 MHz); 0.1, 1, 2, 4, 7, 11, 16, 22, 29, 37, 46 and 56 ms (700 MHz); 0.1, 1, 2, 3, 5, 8, 12, 16, 22, 29, 37, 46 and 56 ms (800 MHz); and 0.1, 1, 2, 3, 5, 7, 10, 13, 16, 22, 29, 37, 46 and 56 ms (950 MHz). Receiver phase cycling was applied following acquisition using a Julia script to select DQ′ and QQ coherence transfer pathways (Fig. 4a, Listing S2). The resulting data were processed with linear prediction and cosine-squared window functions, and peak amplitudes were then fitted to exponential functions using FuDA to determine the relaxation rates.
Hahn echo measurements of ZQ and DQ relaxation rates were acquired at 600, 700, 800 and 950 MHz, using previously described experiments, without 13C polarisation enhancement (Gill and Palmer, 2011). A recycle delay of 1 s was used, and 20 scans were recorded at each point. Relaxation delays were set as multiples of 3.91 ms (, J=128 Hz): 1, 2, 4, 6, 9, 12, 16, 20, 26, 32, 40, 50, 60 × 3.91 ms (600 MHz); 1, 2, 4, 6, 9, 12, 16, 20, 26, 32, 40, 50 × 3.91 ms (700, 800 MHz); and 1, 2, 3, 4, 6, 8, 10, 12, 16, 20, 26, 32, 40 and 50 × 3.91 ms (950 MHz). Data were processed and fitted in FuDA as above to determine relaxation rates.
4.2.2 Measurement of chemical shift anisotropies
Measurements of methyl 13C CSA and were acquired at 800 MHz using the pulse sequence described in Fig. 3a. A recycle delay of 1.5 s was used, and two scans were acquired, with a 56 ms acquisition time and 15 ppm sweep width for the indirect dimension and relaxation delays of 1.1, 50, 100 and 150 ms. Data were processed with a cosine-squared window function in the direct dimension and linear prediction and 10 Hz exponential line broadening in the indirect dimension. A list of peak positions was prepared from a 1H,13C HMQC experiment and parsed to determine clusters of non-overlapping resonances based on a 0.05 ppm strip width in the 1H dimension and a 2.4 ppm strip width in the 13C dimension. For each peak within a cluster, 2D spectra of 13C quartets were simulated as recently described (Waudby et al., 2021), incorporating the additional relaxation period, T, shown in Fig. 2a:
where describes a Lorentzian signal with resonance frequency ω0 and relaxation rate R observed at a frequency ω; and ; ; ; , , and ; ; ; ; and . Multiplets within each cluster were fitted as a function of the 1H and 13C relaxation rates, , ΔσC and the scalar coupling JCH.
were also measured at 500 MHz via the build-up of 1H TQ magnetisation (Sun et al., 2011), with delays of 2, 6, 12, 20, 30, 40, 50 and 60 ms used for both SQ relaxation and TQ build-up measurements. Peak amplitudes were measured using FuDA and fitted as described (Sun et al., 2011) to determine values.
1H CSA measurements were acquired at 950 MHz using the pulse sequence described in Fig. 4a. A recycle delay of 1 s was used, and eight scans were recorded for both IP and AP experiments, before looping over relaxation delays and then 13C chemical shift evolution. Measurements were acquired for relaxation times of 2, 5, 10, 15, 20, 30, 50, 75, 100 and 150 ms. Peak amplitudes were fitted using FuDA to determine the spin-state-selective relaxation rates Rα and Rβ, from which ΔσH was then determined according to Eq. (7).
4.2.3 CPMG relaxation dispersion
Multiple quantum CPMG relaxation dispersion experiments (Korzhnev et al., 2004b) were acquired at 800 and 950 MHz. A 2 s relaxation delay was used, with a 40 ms relaxation period comprising 19.2 kHz 13C pulses applied at 28 CPMG frequencies from 25 Hz to 2 kHz. Measurements were interleaved at the single scan level, alternating between high- and low-power CPMG pulse trains. A 1H SQ CPMG measurement (Yuwen et al., 2019) was acquired at 800 MHz, with a 40 ms relaxation period comprising 10.4 kHz 1H pulses applied at 28 CPMG frequencies from 25 Hz to 2 kHz. For both experiments, peak amplitudes were fitted using FuDA in order to determine effective relaxation rates as a function of CPMG frequency.
4.3 Data analysis
Measurements of the HE relaxation rates at multiple magnetic fields were fitted by weighted linear regression as a function of to determine the combination of CSA and exchange contributions to the relaxation rate, assuming fast chemical exchange (Table 1, Fig. 5a, b):
The CSA contribution, βCSA, was then subtracted, based on the measurements above, to determine the pure exchange contribution, βex. Errors were propagated using standard methods and used to restrain (ξH,ξC) parameter space, , where , −1, +1 or +3 depending on the multiple quantum coherence being analysed (Fig. 5c, d). χ2 surfaces (Fig. 5c, d) were computed as a function of ξH and ξC as the sum across ZQ, DQ, DQ′ and QQ coherences of the sum of the squares of residuals to fits of Eq. (9) as a function of R2,0, using values of βex calculated from the specified ξH and ξC assuming fast chemical exchange (Table 1).
The joint analysis of HE and CPMG relaxation dispersion measurements was performed to determine values of ΔδC and ΔδH for each methyl group observed, together with the parameters kex and pB reflecting the kinetics and thermodynamics of the exchange process. HE relaxation rates were fitted as a function of the magnetic field strength:
where the CSA contribution was calculated as before (Table 1), and the exchange contribution was calculated from the major eigenvalue of the Liouvillian superoperator (Palmer and Koss, 2019). In the case of two-state exchange analysed here,
where Δω is the (field-dependent) frequency difference of the multiple quantum coherence under consideration (Palmer and Koss, 2019). CPMG data were fitted to numerical simulations of the propagation of magnetisation through CPMG elements, assuming no pulse imperfections, with basis spaces and {Hx,Hy} for MQ and 1H SQ CPMG experiments respectively. While for the SQ CPMG experiment this approach is equivalent to an established analytical solution (Baldwin, 2014), to maintain generality and allow for the analysis of pulse imperfections and off-resonance effects in the future, we have preferred to use a numerical approach throughout. Residuals from all HE and CPMG datasets across multiple residues were weighted by their standard error and coupled to a Levenberg–Marquardt algorithm for fitting. Uncertainties in fitted parameters were determined from the curvature of the χ2 surface.
Quadruple-quantum and four-spin double-quantum coherences in 13CH3-labelled methyl groups can be easily generated from equilibrium magnetisation and are protected against relaxation by intra-methyl dipolar interactions, leading to unexpectedly low exchange-free transverse relaxation rates in perdeuterated macromolecules. In contrast however, these high-order coherences are highly sensitive to relaxation through chemical exchange processes and particularly to 1H chemical shift perturbations. The combination of these effects means that these coherences provide near-ideal probes of conformational exchange, which we have investigated in this study using a newly developed suite of pulse sequences. Analysis of the magnetic field dependence of multiple quantum relaxation rates provides a sensitive indicator of chemical exchange, and we have shown that the combined analysis of multiple such measurements can accurately determine relative 1H and 13C chemical shift perturbations, up to an overall sign. We have further demonstrated that this analysis may be combined with established CPMG relaxation dispersion measurements, providing increased confidence in chemical shift perturbations together with kinetic and thermodynamic descriptions of the exchange process. Indeed, the combination of field-dependent Hahn echo relaxation measurements with relaxation dispersion measurements that we have demonstrated here for the first time may have more general applicability beyond methyl groups, improving the unique ability of NMR spectroscopy to characterise conformational exchange processes involving sparsely populated intermediate states.
Relaxation measurements, pulse sequences (Bruker format) and associated analysis scripts are provided in the Supplement. Raw NMR data are deposited in Zenodo (https://doi.org/10.5281/zenodo.5559835, Waudby and Christodoulou, 2021a). Software used for analysis and fitting of HE and CPMG data is available in Zenodo (https://doi.org/10.5281/zenodo.5559636, Waudby and Christodoulou, 2021b; https://doi.org/10.5281/zenodo.5585089, Waudby, 2021).
The supplement related to this article is available online at: https://doi.org/10.5194/mr-2-777-2021-supplement.
Measurements and analyses were conceived and performed by CAW, and the paper was written by CAW and JC.
The contact author has declared that neither they nor their co-author has any competing interests.
Publisher’s note: Copernicus Publications remains neutral with regard to jurisdictional claims in published maps and institutional affiliations.
We acknowledge the use of the UCL Biomolecular NMR Centre and the MRC Biomedical NMR Centre and thank associated staff for their support.
This research has been supported by the Biotechnology and Biological Sciences Research Council (grant no. BB/T002603/1) and by the Francis Crick Institute through provision of access to the MRC Biomedical NMR Centre. The Francis Crick Institute receives its core funding from Cancer Research UK (grant no. FC001029), the Medical Research Council (grant no. FC001029) and the Wellcome Trust (grant no. FC001029). This study made use of NMRbox: National Center for Biomolecular NMR Data Processing and Analysis, a Biomedical Technology Research Resource (BTRR), which is supported by the National Institute of General Medical Sciences (grant no. P41GM111135).
This paper was edited by Gottfried Otting and reviewed by two anonymous referees.
Abramov, G., Velyvis, A., Rennella, E., Wong, L. E., and Kay, L. E.: A methyl-TROSY approach for NMR studies of high-molecular-weight DNA with application to the nucleosome core particle, Proc. Natl. Acad. Sci. USA, 117, 12836–12846, https://doi.org/10.1073/pnas.2004317117, 2020.
Alderson, T. R., Reid Alderson, T., and Kay, L. E.: Unveiling invisible protein states with NMR spectroscopy, Curr. Opin. Struct. Biol., 60, 39–49, https://doi.org/10.1016/j.sbi.2019.10.008, 2020.
Auer, R., Hansen, D. F., Neudecker, P., Korzhnev, D. M., Muhandiram, D. R., Konrat, R., and Kay, L. E.: Measurement of signs of chemical shift differences between ground and excited protein states: a comparison between H(S/M)QC and R1ρ methods, J. Biomol. NMR, 46, 205–216, https://doi.org/10.1007/s10858-009-9394-z, 2010.
Baldwin, A. J.: An exact solution for R2,eff in CPMG experiments in the case of two site chemical exchange, J. Magn. Reson., 244, 114–124, https://doi.org/10.1016/j.jmr.2014.02.023, 2014.
Bezanson, J., Edelman, A., Karpinski, S., and Shah, V. B.: Julia: A fresh approach to numerical computing, SIAM Rev. Soc. Ind. Appl. Math., 59, 65–98, https://doi.org/10.1137/141000671, 2017.
Bolik-Coulon, N., Kadeřávek, P., Pelupessy, P., Dumez, J.-N., Ferrage, F., and Cousin, S. F.: Theoretical and computational framework for the analysis of the relaxation properties of arbitrary spin systems. Application to high-resolution relaxometry, J. Magn. Reson., 313, 106718, https://doi.org/10.1016/j.jmr.2020.106718, 2020.
Boswell, Z. K. and Latham, M. P.: Methyl-based NMR spectroscopy methods for uncovering structural dynamics in large proteins and protein complexes, Biochemistry, 58, 144–155, https://doi.org/10.1021/acs.biochem.8b00953, 2019.
Bouvignies, G., Korzhnev, D. M., Neudecker, P., Hansen, D. F., Cordes, M. H. J., and Kay, L. E.: A simple method for measuring signs of 1HN chemical shift differences between ground and excited protein states, J. Biomol. NMR, 47, 135–141, https://doi.org/10.1007/s10858-010-9418-8, 2010.
Cabrita, L. D., Cassaignau, A. M. E., Launay, H. M. M., Waudby, C. A., Wlodarski, T., Camilloni, C., Karyadi, M.-E., Robertson, A. L., Wang, X., Wentink, A. S., Goodsell, L., Woolhead, C. A., Vendruscolo, M., Dobson, C. M., and Christodoulou, J.: A structural ensemble of a ribosome-nascent chain complex during cotranslational protein folding, Nat. Struct. Mol. Biol., 23, 278–285, https://doi.org/10.1038/nsmb.3182, 2016.
Chao, F.-A., Li, Y., Zhang, Y., and Byrd, R. A.: Probing the broad time scale and heterogeneous conformational dynamics in the catalytic core of the Arf-GAP ASAP1 via methyl adiabatic relaxation dispersion, J. Am. Chem. Soc., 141, 11881–11891, https://doi.org/10.1021/jacs.9b02602, 2019.
Charlier, C., Alderson, T. R., Courtney, J. M., Ying, J., Anfinrud, P., and Bax, A.: Study of protein folding under native conditions by rapidly switching the hydrostatic pressure inside an NMR sample cell, Proc. Natl. Acad. Sci. USA, 115, E4169–E4178, https://doi.org/10.1073/pnas.1803642115, 2018.
Chiarparin, E., Rüdisser, S., and Bodenhausen, G.: Hydrogen bonds in RNA base pairs investigated by cross-correlated relaxation of multiple-quantum coherence in NMR, Chemphyschem, 2, 41–45, https://doi.org/10.1002/1439-7641(20010119)2:1<41::AID-CPHC41>3.0.CO;2-H, 2001.
Delaglio, F., Grzesiek, S., Vuister, G. W., Zhu, G., Pfeifer, J., and Bax, A.: NMRPipe: a multidimensional spectral processing system based on UNIX pipes, J. Biomol. NMR, 6, 277–293, https://doi.org/10.1007/BF00197809, 1995.
Diercks, T., Schwaiger, M., and Kessler, H.: HSQC-based methyl group selection via gradients in mutidimensional NMR spectroscopy of proteins, J. Magn. Reson., 130, 335–340, https://doi.org/10.1006/jmre.1997.1321, 1998.
Dittmer, J. and Bodenhausen, G.: Evidence for slow motion in proteins by multiple refocusing of heteronuclear nitrogen/proton multiple quantum coherences in NMR, J. Am. Chem. Soc., 126, 1314–1315, https://doi.org/10.1021/ja0386243, 2004.
Findeisen, M., Brand, T., and Berger, S.: A 1H-NMR thermometer suitable for cryoprobes, Magn. Reson. Chem., 45, 175–178, https://doi.org/10.1002/mrc.1941, 2007.
Franco, R., Favier, A., Schanda, P., and Brutscher, B.: Optimized fast mixing device for real-time NMR applications, J. Magn. Reson., 281, 125–129, https://doi.org/10.1016/j.jmr.2017.05.016, 2017.
Frederick, K. K., Marlow, M. S., Valentine, K. G., and Wand, A. J.: Conformational entropy in molecular recognition by proteins, Nature, 448, 325–329, https://doi.org/10.1038/nature05959, 2007.
Früh, D., Tolman, J. R., Bodenhausen, G., and Zwahlen, C.: Cross-correlated chemical shift modulation: a signature of slow internal motions in proteins, J. Am. Chem. Soc., 123, 4810–4816, https://doi.org/10.1021/ja003487k, 2001.
Gill, M. L. and Palmer III, A. G.: Multiplet-filtered and gradient-selected zero-quantum TROSY experiments for 13C1H3 methyl groups in proteins, J. Biomol. NMR, 51, 245–251, https://doi.org/10.1007/s10858-011-9533-1, 2011.
Gill, M. L., Hsu, A., and Palmer, A. G.: Detection of chemical exchange in methyl groups of macromolecules, J. Biomol. NMR, 73, 443–450, https://doi.org/10.1007/s10858-019-00240-w, 2019.
Gopalan, A. B. and Vallurupalli, P.: Measuring the signs of the methyl 1H chemical shift differences between major and “invisible” minor protein conformational states using methyl 1H multi-quantum spectroscopy, J. Biomol. NMR, 70, 187–202, https://doi.org/10.1007/s10858-018-0171-8, 2018.
Gopalan, A. B., Yuwen, T., Kay, L. E., and Vallurupalli, P.: A methyl 1H double quantum CPMG experiment to study protein conformational exchange, J. Biomol. NMR, 72, 79–91, https://doi.org/10.1007/s10858-018-0208-z, 2018.
Hansen, D. F., Vallurupalli, P., and Kay, L. E.: An improved 15N relaxation dispersion experiment for the measurement of millisecond time-scale dynamics in proteins, J. Phys. Chem. B, 112, 5898–5904, https://doi.org/10.1021/jp074793o, 2008.
Hansen, D. F., Neudecker, P., and Kay, L. E.: Determination of isoleucine side-chain conformations in ground and excited states of proteins from chemical shifts, J. Am. Chem. Soc., 132, 7589–7591, https://doi.org/10.1021/ja102090z, 2010.
Hsu, S.-T. D., Cabrita, L. D., Christodoulou, J., and Dobson, C. M.: 1H, 15N and 13C assignments of domain 5 of Dictyostelium discoideum gelation factor (ABP-120) in its native and 8M urea-denatured states, Biomol. NMR Assign., 3, 29–31, https://doi.org/10.1007/s12104-008-9134-4, 2009.
Juen, M. A., Wunderlich, C. H., Nußbaumer, F., Tollinger, M., Kontaxis, G., Konrat, R., Hansen, D. F., and Kreutz, C.: Excited states of nucleic acids probed by proton relaxation dispersion NMR ppectroscopy, Angew. Chem. Int. Ed., 55, 12008–12012, https://doi.org/10.1002/anie.201605870, 2016.
Kerfah, R., Plevin, M. J., Sounier, R., Gans, P., and Boisbouvier, J.: Methyl-specific isotopic labeling: a molecular tool box for solution NMR studies of large proteins, Curr. Opin. Struct. Biol., 32, 113–122, https://doi.org/10.1016/j.sbi.2015.03.009, 2015.
Kessler, H., Schmieder, P., Köck, M., and Reggelin, M.: Selection of methyl resonances in proton-detected heteronuclear shift correlation, the HQQC experiment, J. Magn. Reson., 91, 375–379, https://doi.org/10.1016/0022-2364(91)90199-4, 1991.
Kloiber, K. and Konrat, R.: Differential multiple-quantum relaxation arising from cross-correlated time-modulation of isotropic chemical shifts, J. Biomol. NMR, 18, 33–42, https://doi.org/10.1023/a:1008317212558, 2000.
Korzhnev, D. M., Kloiber, K., and Kay, L. E.: Multiple-quantum relaxation dispersion NMR spectroscopy probing millisecond time-scale dynamics in proteins: theory and application, J. Am. Chem. Soc., 126, 7320–7329, https://doi.org/10.1021/ja049968b, 2004a.
Korzhnev, D. M., Kloiber, K., Kanelis, V., Tugarinov, V., and Kay, L. E.: Probing slow dynamics in high molecular weight proteins by methyl-TROSY NMR spectroscopy: application to a 723-residue enzyme, J. Am. Chem. Soc., 126, 3964–3973, https://doi.org/10.1021/ja039587i, 2004b.
Korzhnev, D. M., Neudecker, P., Mittermaier, A., Orekhov, V. Y., and Kay, L. E.: Multiple-site exchange in proteins studied with a suite of six NMR relaxation dispersion experiments: an application to the folding of a Fyn SH3 domain mutant, J. Am. Chem. Soc., 127, 15602–15611, https://doi.org/10.1021/ja054550e, 2005.
Lee, W., Tonelli, M., and Markley, J. L.: NMRFAM-SPARKY: enhanced software for biomolecular NMR spectroscopy, Bioinformatics, 31, 1325–1327, https://doi.org/10.1093/bioinformatics/btu830, 2015.
Li, D.-W. and Brüschweiler, R.: PPM: a side-chain and backbone chemical shift predictor for the assessment of protein conformational ensembles, J. Biomol. NMR, 54, 257–265, https://doi.org/10.1007/s10858-012-9668-8, 2012.
Liu, W., Zheng, Y., Cistola, D. P., and Yang, D.: Measurement of methyl 13C-1H cross-correlation in uniformly 13C-, 15N-, labeled proteins, J. Biomol. NMR, 27, 351–364, https://doi.org/10.1023/a:1025884922203, 2003.
Loria, J. P., Rance, M., and Palmer III, A. G.: A TROSY CPMG sequence for characterizing chemical exchange in large proteins, J. Biomol. NMR, 15, 151–155, https://doi.org/10.1023/a:1008355631073, 1999.
Lundstrom, P., Mulder, F. A. A., and Akke, M.: Correlated dynamics of consecutive residues reveal transient and cooperative unfolding of secondary structure in proteins, Proc. Natl. Acad. Sci. USA, 102, 16984–16989, https://doi.org/10.1073/pnas.0504361102, 2005.
Lundström, P., Vallurupalli, P., Religa, T. L., Dahlquist, F. W., and Kay, L. E.: A single-quantum methyl 13C-relaxation dispersion experiment with improved sensitivity, J. Biomol. NMR, 38, 79–88, https://doi.org/10.1007/s10858-007-9149-7, 2007.
Maciejewski, M. W., Schuyler, A. D., Gryk, M. R., Moraru, I. I., Romero, P. R., Ulrich, E. L., Eghbalnia, H. R., Livny, M., Delaglio, F., and Hoch, J. C.: NMRbox: A resource for biomolecular NMR computation, Biophys. J., 112, 1529–1534, https://doi.org/10.1016/j.bpj.2017.03.011, 2017.
McCoy, A. J., Fucini, P., Noegel, A. A., and Stewart, M.: Structural basis for dimerization of the Dictyostelium gelation factor (ABP120) rod, Nat. Struct. Biol., 6, 836–841, https://doi.org/10.1038/12296, 1999.
Millet, O., Loria, J. P., Kroenke, C. D., Pons, M., and Palmer, A. G.: The static magnetic field dependence of chemical exchange linebroadening defines the NMR chemical shift time scale, J. Am. Chem. Soc., 122, 2867–2877, https://doi.org/10.1021/ja993511y, 2000.
O'Connell, N. E., Grey, M. J., Tang, Y., Kosuri, P., Miloushev, V. Z., Raleigh, D. P., and Palmer, A. G.: Partially folded equilibrium intermediate of the villin headpiece HP67 defined by 13C relaxation dispersion, J. Biomol. NMR, 45, 85–98, https://doi.org/10.1007/s10858-009-9340-0, 2009.
Palmer, A. G. and Koss, H.: Chemical exchange, Methods Enzymol., 615, 177–236, https://doi.org/10.1016/bs.mie.2018.09.028, 2019.
Palmer III, A. G. and Massi, F.: Characterization of the dynamics of biomacromolecules using rotating-frame spin relaxation NMR spectroscopy, Chem. Rev., 106, 1700–1719, https://doi.org/10.1021/cr0404287, 2006.
Phan, I. Q., Boyd, J., and Campbell, I. D.: Dynamic studies of a fibronectin type I module pair at three frequencies: Anisotropic modelling and direct determination of conformational exchange, J. Biomol. NMR, 8, 369–378, https://doi.org/10.1007/BF00228140, 1996.
Rosenzweig, R. and Kay, L. E.: Bringing dynamic molecular machines into focus by methyl-TROSY NMR, Annu. Rev. Biochem., 83, 291–315, https://doi.org/10.1146/annurev-biochem-060713-035829, 2014.
Ryabov, Y., Suh, J.-Y., Grishaev, A., Clore, G. M., and Schwieters, C. D.: Using the experimentally determined components of the overall rotational diffusion tensor to restrain molecular shape and size in NMR structure determination of globular proteins and protein-protein complexes, J. Am. Chem. Soc., 131, 9522–9531, https://doi.org/10.1021/ja902336c, 2009.
Schlagnitweit, J., Zuckerstätter, G., and Müller, N.: Toward multipurpose NMR experiments, Magn. Reson. Chem., 48, 1–8, https://doi.org/10.1002/mrc.2527, 2010.
Schlagnitweit, J., Horničáková, M., Zuckerstätter, G., and Müller, N.: MQD–multiplex-quadrature detection in multi-dimensional NMR, Chemphyschem, 13, 342–346, https://doi.org/10.1002/cphc.201100525, 2012.
Sekhar, A. and Kay, L. E.: An NMR view of protein dynamics in health and disease, Annu. Rev. Biophys., 48, 297–319, https://doi.org/10.1146/annurev-biophys-052118-115647, 2019.
Skrynnikov, N. R., Mulder, F. A., Hon, B., Dahlquist, F. W., and Kay, L. E.: Probing slow time scale dynamics at methyl-containing side chains in proteins by relaxation dispersion NMR measurements: application to methionine residues in a cavity mutant of T4 lysozyme, J. Am. Chem. Soc., 123, 4556–4566, https://doi.org/10.1021/ja004179p, 2001.
Skrynnikov, N. R., Dahlquist, F. W., and Kay, L. E.: Reconstructing NMR spectra of “invisible” excited protein states using HSQC and HMQC experiments, J. Am. Chem. Soc., 124, 12352–12360, https://doi.org/10.1021/ja0207089, 2002.
Stadmiller, S. S., Aguilar, J. S., Waudby, C. A., and Pielak, G. J.: Rapid quantification of protein-ligand binding via 19F NMR lineshape analysis, Biophys. J., 118, 2537–2548, https://doi.org/10.1016/j.bpj.2020.03.031, 2020.
Stetz, M. A., Caro, J. A., Kotaru, S., Yao, X., Marques, B. S., Valentine, K. G., and Wand, A. J.: Characterization of internal protein dynamics and conformational entropy by NMR relaxation, Methods Enzymol., 615, 237–284, https://doi.org/10.1016/bs.mie.2018.09.010, 2019.
Sun, H., Kay, L. E., and Tugarinov, V.: An optimized relaxation-based coherence transfer NMR experiment for the measurement of side-chain order in methyl-protonated, highly deuterated proteins, J. Phys. Chem. B, 115, 14878–14884, https://doi.org/10.1021/jp209049k, 2011.
Tessari, M. and Vuister, G. W.: A novel experiment for the quantitative measurement of CSA(1HN)/CSA(15N) cross-correlated relaxation in 15N-labeled proteins, J. Biomol. NMR, 16, 171–174, https://doi.org/10.1023/a:1008347012429, 2000.
Toyama, Y., Osawa, M., Yokogawa, M., and Shimada, I.: NMR method for characterizing microsecond-to-millisecond chemical exchanges utilizing differential multiple-quantum relaxation in high molecular weight proteins, J. Am. Chem. Soc., 138, 2302–2311, https://doi.org/10.1021/jacs.5b12954, 2016.
Toyama, Y., Kano, H., Mase, Y., Yokogawa, M., Osawa, M., and Shimada, I.: Dynamic regulation of GDP binding to G proteins revealed by magnetic field-dependent NMR relaxation analyses, Nat. Commun., 8, 14523, https://doi.org/10.1038/ncomms14523, 2017.
Tugarinov, V. and Kay, L. E.: Relaxation rates of degenerate 1H transitions in methyl groups of proteins as reporters of side-chain dynamics, J. Am. Chem. Soc., 128, 7299–7308, https://doi.org/10.1021/ja060817d, 2006.
Tugarinov, V., Hwang, P. M., Ollerenshaw, J. E., and Kay, L. E.: Cross-correlated relaxation enhanced 1H–13C NMR spectroscopy of methyl groups in very high molecular weight proteins and protein complexes, J. Am. Chem. Soc., 125, 10420–10428, https://doi.org/10.1021/ja030153x, 2003.
Tugarinov, V., Scheurer, C., Brüschweiler, R., and Kay, L. E.: Estimates of methyl 13C and 1H CSA values (Δσ) in proteins from cross-correlated spin relaxation, J. Biomol. NMR, 30, 397–406, https://doi.org/10.1007/s10858-004-4349-x, 2004.
Tugarinov, V., Karamanos, T. K., and Clore, G. M.: Optimized selection of slow-relaxing 13C transitions in methyl groups of proteins: application to relaxation dispersion, J. Biomol. NMR, 74, 673–680, https://doi.org/10.1007/s10858-020-00349-3, 2020.
Wang, C. and Palmer, A. G.: Differential multiple quantum relaxation caused by chemical exchange outside the fast exchange limit, J. Biomol. NMR, 24, 263–268, https://doi.org/10.1023/A:1021687604854, 2002.
Wang, C., Grey, M. J., and Palmer III, A. G.: CPMG sequences with enhanced sensitivity to chemical exchange, J. Biomol. NMR, 21, 361–366, https://doi.org/10.1023/a:1013328206498, 2001.
Waudby, C. A.: NMRTools.jl (v0.0.2), Zenodo [code], https://doi.org/10.5281/zenodo.5585089, 2021.
Waudby, C. A. and Christodoulou, J.: Data for: Analysis of Conformational Exchange Processes using Methyl-TROSY-Based Hahn Echo Measurements of Quadruple-Quantum Relaxation, Zenodo [data set], https://doi.org/10.5281/zenodo.5559835, 2021a.
Waudby, C. A. and Christodoulou, J.: QQ Hahn Echo and CPMG analysis (v1.0.1), Zenodo [code], https://doi.org/10.5281/zenodo.5559636, 2021b.
Waudby, C. A., Ramos, A., Cabrita, L. D., and Christodoulou, J.: Two-dimensional NMR lineshape analysis, Sci. Rep., 6, 24826, https://doi.org/10.1038/srep24826, 2016.
Waudby, C. A., Wlodarski, T., Karyadi, M.-E., Cassaignau, A. M. E., Chan, S. H. S., Wentink, A. S., Schmidt-Engler, J. M., Camilloni, C., Vendruscolo, M., Cabrita, L. D., and Christodoulou, J.: Systematic mapping of free energy landscapes of a growing filamin domain during biosynthesis, Proc. Natl. Acad. Sci. USA, 115, 9744–9749, https://doi.org/10.1073/pnas.1716252115, 2018.
Waudby, C. A., Ouvry, M., Davis, B., and Christodoulou, J.: Two-dimensional NMR lineshape analysis of single, multiple, zero and double quantum correlation experiments, J. Biomol. NMR, 74, 95–109, https://doi.org/10.1007/s10858-019-00297-7, 2020.
Waudby, C. A., Burridge, C., and Christodoulou, J.: Optimal design of adaptively sampled NMR experiments for measurement of methyl group dynamics with application to a ribosome-nascent chain complex, J. Magn. Reson., 326, 106937, https://doi.org/10.1016/j.jmr.2021.106937, 2021.
Weininger, U., Liu, Z., McIntyre, D. D., Vogel, H. J., and Akke, M.: Specific 12CβDCγD2S13CεHD2 isotopomer labeling of methionine to characterize protein dynamics by 1H and 13C NMR relaxation dispersion, J. Am. Chem. Soc., 134, 18562–18565, https://doi.org/10.1021/ja309294u, 2012.
Yuwen, T. and Kay, L. E.: Revisiting 1HN CPMG relaxation dispersion experiments: a simple modification can eliminate large artifacts, J. Biomol. NMR, 73, 641–650, https://doi.org/10.1007/s10858-019-00276-y, 2019.
Yuwen, T., Vallurupalli, P., and Kay, L. E.: Enhancing the sensitivity of CPMG relaxation dispersion to conformational exchange processes by multiple-quantum spectroscopy, Angew. Chem. Int. Ed., 55, 11490–11494, https://doi.org/10.1002/anie.201605843, 2016.
Yuwen, T., Huang, R., Vallurupalli, P., and Kay, L. E.: A methyl-TROSY-based 1H relaxation dispersion experiment for studies of conformational exchange in high molecular weight proteins, Angew. Chem. Int. Ed., 58, 6250–6254, https://doi.org/10.1002/anie.201900241, 2019.
Zheng, G., Torres, A. M., and Price, W. S.: MQ-PGSTE: a new multi-quantum STE-based PGSE NMR sequence, J. Magn. Reson., 198, 271–274, https://doi.org/10.1016/j.jmr.2009.03.004, 2009.