the Creative Commons Attribution 4.0 License.
the Creative Commons Attribution 4.0 License.
 | 05 Jan 2024
Solid-state 13C-NMR spectroscopic determination of side-chain mobilities in zirconium-based metal–organic frameworks
Günter Hempel
Ricardo Kurz
Silvia Paasch
Kay Saalwächter
Eike Brunner
Porous interpenetrated zirconium–organic frameworks (PIZOFs) are a class of Zr-based metal–organic frameworks (MOFs) which are composed of long, rod-like dicarboxylate linkers and Zr6O4(OH)4(O2C)12 nodes. Long oligoethylene glycol or aliphatic side chains are covalently attached to the linker molecules in the cases of PIZOF-10 and PIZOF-11, respectively. These side chains are supposedly highly mobile, thus mimicking a solvent environment. It is anticipated that such MOFs could be used as a solid catalyst – the MOF – with pore systems showing properties similar to a liquid reaction medium. To quantify the side-chain mobility, here we have applied different 1D and 2D NMR solid-state spectroscopic techniques like cross-polarization (CP) and dipolar-coupling chemical-shift correlation (DIPSHIFT) studies. The rather high 1H-13C CP efficiency observed for the CH2 groups of the side chains indicates that the long side chains are unexpectedly immobile or at least that their motions are strongly anisotropic. More detailed information about the mobility of the side chains was then obtained from DIPSHIFT experiments. Analytical expressions for elaborate data analysis are derived. These expressions are used to correlate order parameters and to slow motional rates with signals in indirect spectral dimensions, thus enabling the quantification of order parameters for the CH2 groups. The ends of the chains are rather mobile, whereas the carbon atoms close to the linker are more spatially restricted in mobility.
- Article
(7071 KB) - Full-text XML
-
Supplement
(8407 KB) - BibTeX
- EndNote


Metal–organic frameworks (MOFs) are crystalline porous materials (Kitagawa et al., 2004; Ferey, 2008; Tranchemontagne et al., 2009; Kaskel, 2016) composed of organic and inorganic building units forming networks with micropores and/or mesopores. Due to promising properties such as an extraordinarily high specific surface area and gas storage capacity, MOFs are assumed to find numerous applications, e.g. in gas storage and separation, drug delivery, sensing, and wastewater treatment (Horcajada et al., 2006; Ke et al., 2011; Maurin et al., 2017; Li et al., 2019; Lawson et al., 2021; Maranescu and Visa, 2022; Liu et al., 2023). Favourable MOFs for catalysis (Pascanu et al., 2019; Remya and Kurian, 2019; Bavykina et al., 2020; Gao et al., 2022) should be stable at elevated temperatures and in the presence of moisture. Most members of the PIZOF (porous interpenetrated zirconium–organic framework) family (Schaate et al., 2011; Roy et al., 2012; Lippke et al., 2017) are very stable and insensitive to moisture, in contrast to other MOFs containing e.g. Zn instead of Zr (Kaye et al., 2007; Feng et al., 2010), which makes this type of MOF particularly interesting for catalytic applications. PIZOFs contain long dicarboxylates as linkers (see Fig. 1) and Zr6O4(OH)4(O2C)12 as nodes. The surface properties of the internal pore system, including its polarity, can be tuned in PIZOFs by adding appropriate side chains to the linkers. Examples are PIZOF-10 and PIZOF-11 (see Fig. 1). Both exhibit high thermal stability and resistance against atmospheric moisture like other members of the PIZOF family (Lippke et al., 2017). The aliphatic side chains make the internal surface of PIZOF-11 hydrophobic, whereas PIZOF-10 with its oligoethylene glycol side chains is rather hydrophilic.
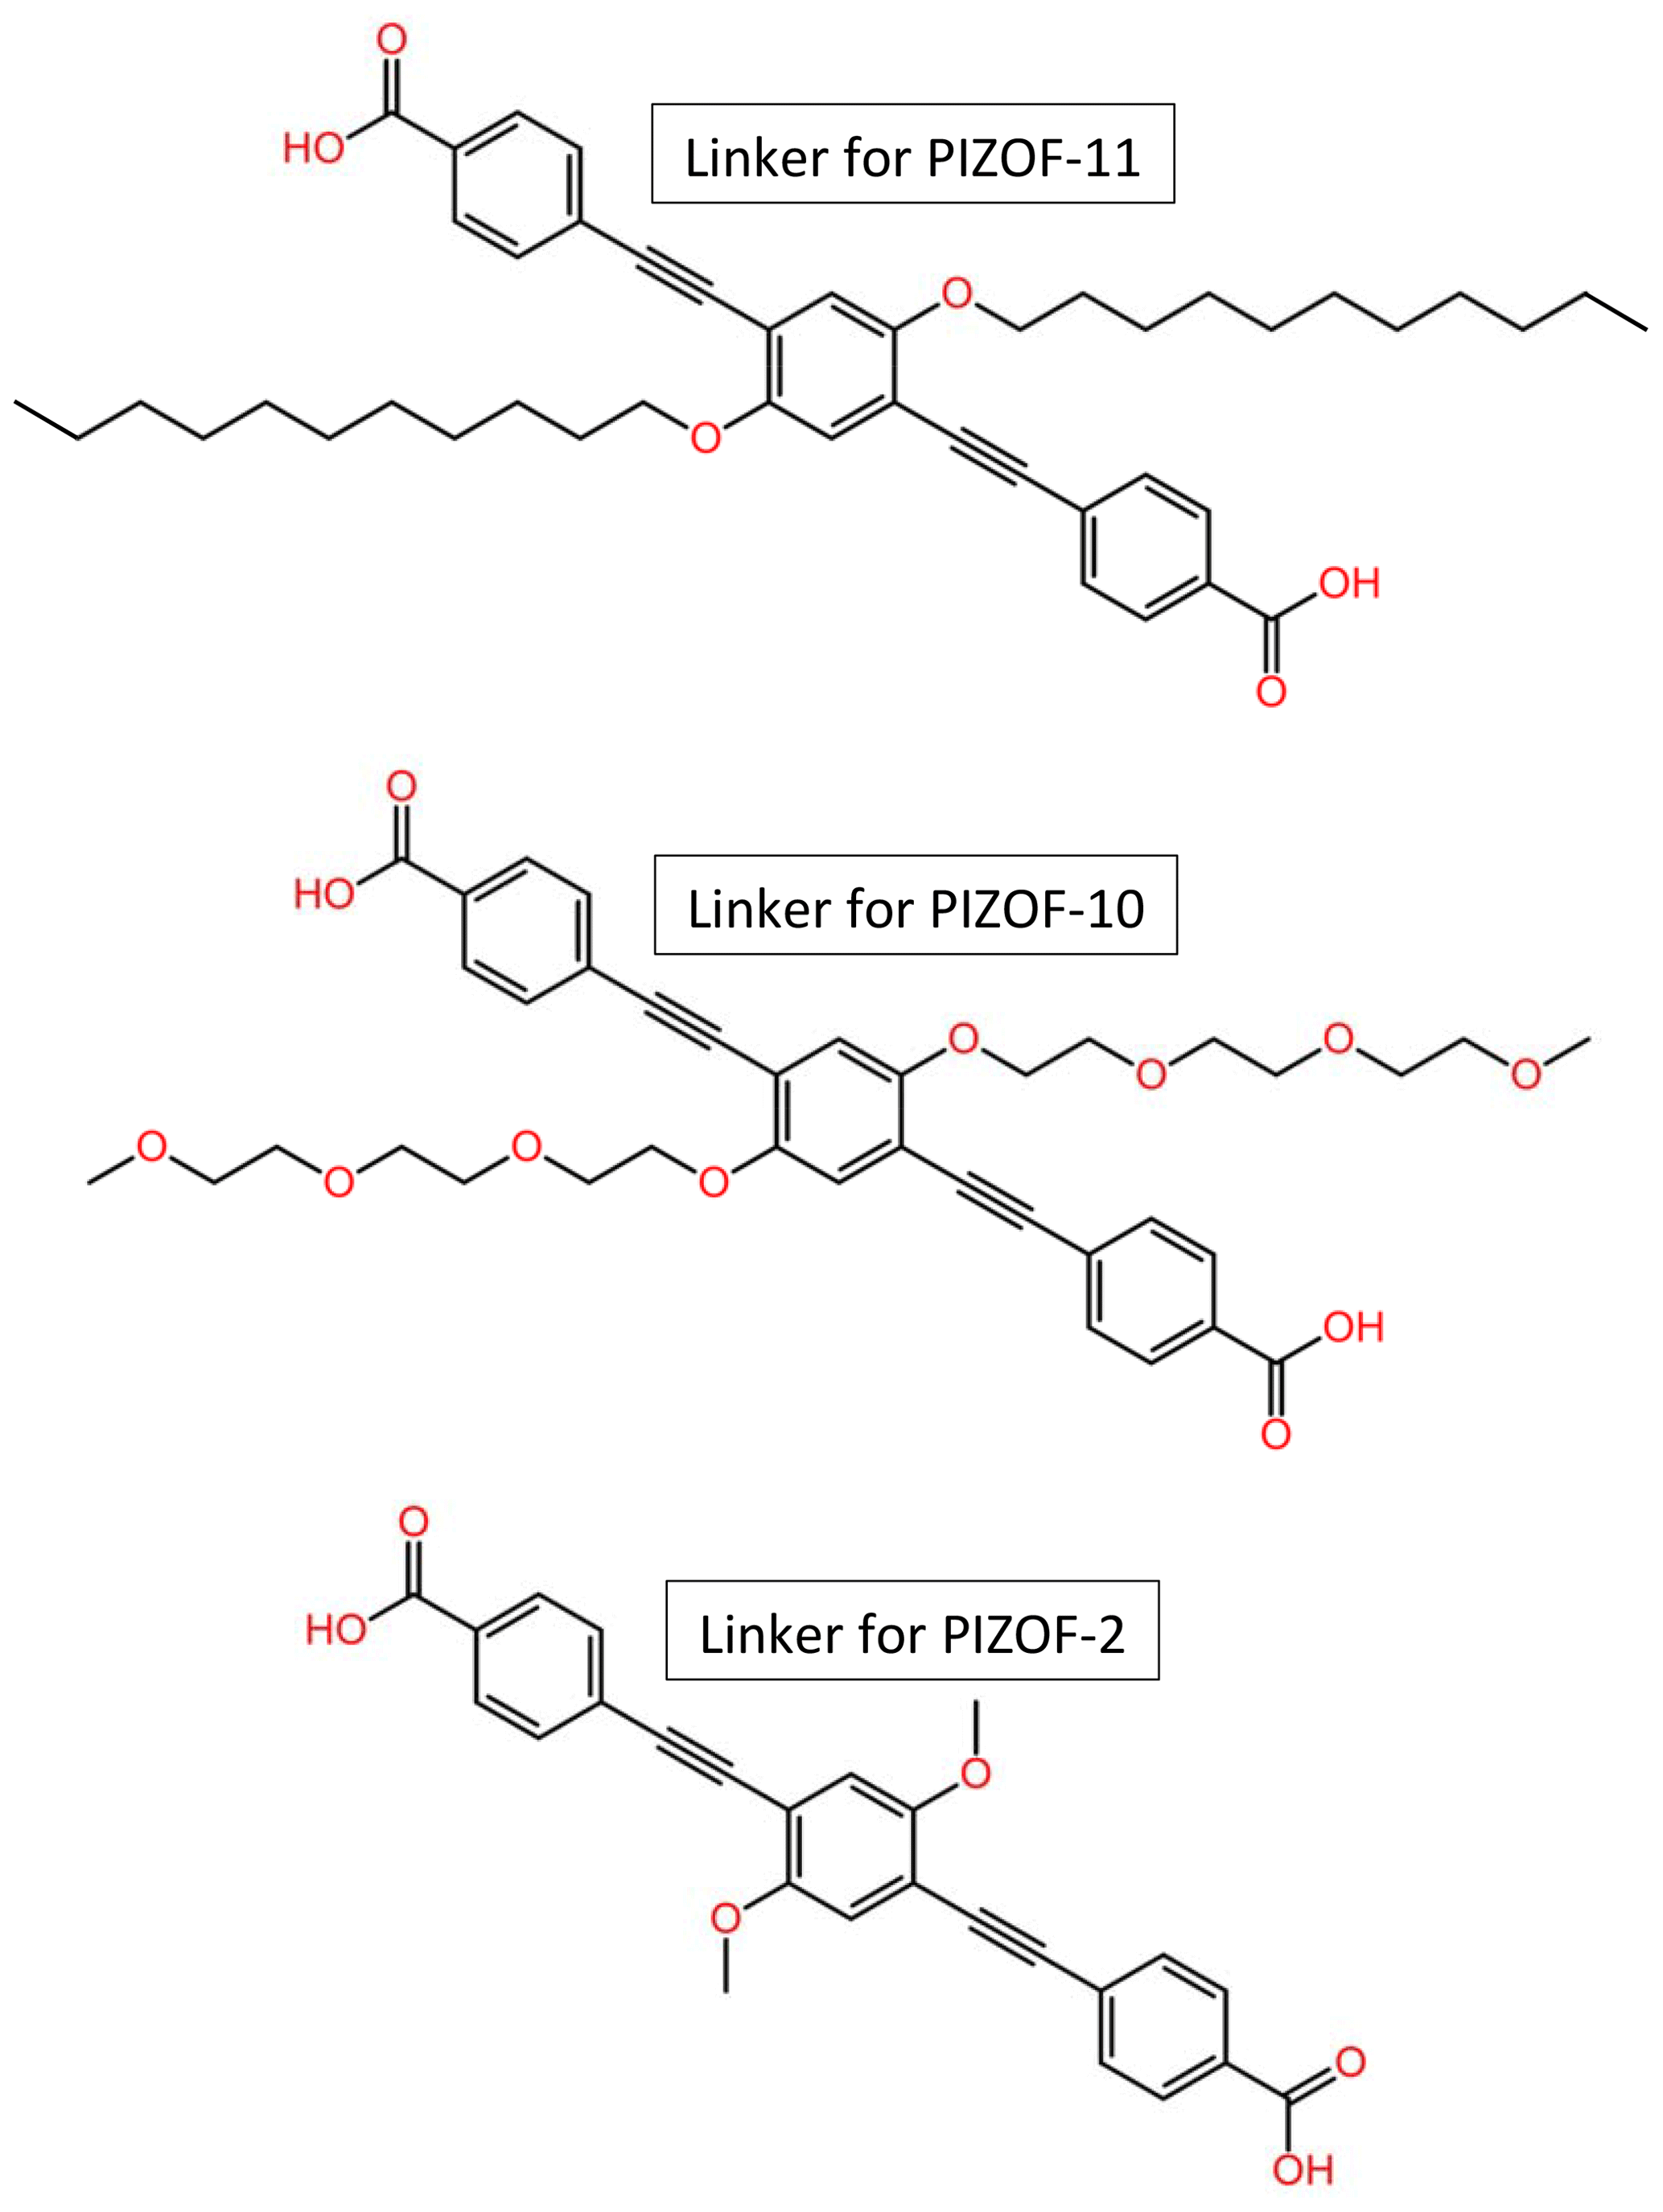
Figure 1Structural formulae of the linkers for the herein studied PIZOFs: PIZOF-2, PIZOF-10, and PIZOF-11.
The long oligoethylene glycol or aliphatic side chains in PIZOF-10 and PIZOF-11 are supposed to be highly flexible, thus providing a liquid-like environment in the remaining pores. In order to test this hypothesis, solid-state NMR techniques were applied to evaluate the side-chain mobility. Solid-state NMR spectroscopy is a powerful tool for determining structural parameters and detecting mobile structural elements in biological systems as well as various materials (Renault et al., 2010; Paasch and Brunner, 2010; Duer, 2002). The framework structure of MOFs can be studied in general by 1H, 13C, or 17O magic-angle spinning (MAS) NMR spectroscopy (Loiseau et al., 2005; Klein et al., 2012; Lucier et al., 2018; Bignami et al., 2018; Brunner and Rauche, 2020). Furthermore, nuclei such as 27Al (Jiang et al., 2010; Lieder et al., 2010; Petrov et al., 2020), 71Ga (Volkringer et al., 2007; Hajjar et al., 2011), 45Sc (Mowat et al., 2011), and others (He et al., 2014) can be used in order to detect the environment of the central metal atom. NMR spectroscopy also allows the study of host or guest interactions with adsorbed species (Wong et al., 2019; Witherspoon et al., 2018; Yan et al., 2017; Wittmann et al., 2019).
It is well known that the efficiency of the cross-polarization (CP) experiment (Pines et al., 1973) is strongly influenced by the presence of thermal motions (Schulze et al., 1990). This was exploited previously in order to qualitatively characterize the mobility of aliphatic chains, e.g. of n-alkylsilanes bonded to silica surfaces (Sindorf and Maciel, 1983), surfactants in mesoporous MCM-41 materials (Simonutti et al., 2001), and alkanes grafted to silica for chromatography (Pursch et al., 1996).
The motion of the side chains is expected to be anisotropic because of its fixation at the middle ring of the linker backbone. The degree of anisotropy (expressed e.g. by the order parameter S) resolved for individual atomic positions might be an important characteristic of the chain motion. More detailed information can be obtained by some 2D NMR methods. In the work presented here, the DIPSHIFT (dipolar-coupling chemical-shift correlation) technique was applied in order to site-specifically determine order parameters. A pulse scheme of this sequence is shown in the Supplement. It was developed as a separated local-field experiment under MAS (Munowitz et al., 1981; Schaefer et al., 1983). Applications made use of the possibility of determining the residual dipolar coupling site-specifically (de Azevedo et al., 2008; Bärenwald et al., 2016), and a recent paper compared the results with those of rotational echo double resonance (REDOR, Jain et al., 2019). The DIPSHIFT experiment enables correlation of isotropic chemical shifts, i.e. atomic positions, in direct dimension (t2) with signals in the indirect dimension (t1) corresponding to an FID which solely evolves under MAS-modulated 1H–13C dipolar couplings between subsequent rotational echoes. The latter is true under the condition that protons coupled to the considered nucleus do not undergo interactions with each other and provided that Fourier transform is performed in the direct dimension only. The depth of the minimum between consecutive echoes is a measure of the (residual) dipolar coupling, which itself contains information about the order parameter. The decrease in the second echo with respect to the first one represents the influence of intermediate motions (intermediate-motional T2 effect).
To determine the mobility site-selectively, 13C signal assignment was necessary. This was achieved by the application of techniques such as solid-state attached proton test (APT, Lesage et al., 1998b; Hoffmann et al., 2012), 1H-13C heteronuclear correlation (HETCOR), and 1H-13C heteronuclear multiple-quantum coherence (HMQC, Lesage et al., 1998a).
The analysis of DIPSHIFT data was in the past usually performed by comparison with numerically calculated data under parameter variation. In this paper, analytical expressions were derived and used. This allowed us to estimate the parameter set for best data fitting in a more efficient way. Intermediate motions were included in the analytical expressions by application of the Anderson–Weiss procedure (Anderson and Weiss, 1953). Specifically, we focus on the conditions under which the signal damping arising from intermediate motions can be described by an exponential function. The theoretical background of this procedure is described in the next section.
2.1 Derivation
MAS experiments on samples with anisotropic spin interactions result in spectra with spinning sidebands (SSBs) and in the FIDs containing echo trains. Provided that the anisotropic interaction is described by a second-order tensor, the SSB intensities can be efficiently calculated by polynomial expressions following Hempel et al. (2021). Equation (21) in that paper gives the general equation for the intensity of the mth-order sideband; the parameters in the argument list are the anisotropy D of the tensor, the angular spinning frequency ωr, and the asymmetry parameter η of the tensor. A closed-form evaluation of this equation is hardly possible; equations for SSBs which are ready for use must be obtained by symbolic-language software. Examples of low-order SSBs are given in the mentioned paper.
The FID can be calculated as Fourier synthesis if the SSB intensities are known.
Applying this formalism to spin systems where chemical-shift anisotropy is the dominating interaction is straightforward. In the case of dipolar interaction, however, some special aspects have to be considered.
-
Fast anisotropic thermal motion: the tensor is subjected to a partial averaging process over all possible states which occur during this motion. Then, the anisotropy and asymmetry parameters of this averaged tensor have to be inserted into the SSB polynomials. In this paper, this case has to be considered for modelling two-site jumps.
-
Dipolar interaction with more than one spin: tensors of the individual couplings have to be added up. If, however, the neighbouring spins interact among themselves, it is possible that the total interaction is represented by a tensor of order >2. In the latter case the polynomial formulae mentioned above would not be applicable.
-
In the case of multi-spin interactions, different combinations of spin orientations have to be taken into account; they can lead to different effective tensors. Each of these tensors corresponds to a particular set of SSB , where k indicates the respective combinations of spin orientations. The SSB intensity which appears in the experiment is the average of the SSB intensities belonging to all the combinations: . This procedure is applied below for the calculation of FIDs of both the CH2 and CH3 groups.
2.2 Transformation to a cosine series
In this paper we consider dipolar interactions between two nuclei with spin . (“” should be understood as “one-half”.) The observed spin can be oriented parallel or antiparallel to B0 with approximately equal probabilities at not too low temperatures. A change in orientation of the observed spin inverts the anisotropy of the dipolar tensor assuming the configuration of the coupled spins remains unchanged. We thus always have pairs of tensors with inverted anisotropy (D and −D) but equal asymmetry parameters. Applying the relation (see Hempel et al., 2021),
the exponential series of Eq. (1) can always be transformed to a cosine series,
with the following definitions:
Therefore, the Cm contain only even powers of .
In the following, the polynomial equations are established for four situations which may occur in the PIZOF samples.
2.3 Model 1: ensemble of isolated spin pairs
The coefficients are denoted by and can be taken immediately from the generic equation by using the dipolar-coupling constant D0 as the anisotropy and zero asymmetry parameter. As an example, up to 12th order, we have
The polynomial equations for m=1 to 3 are given in Sect. 6.1.
2.4 Model 2: spin pairs with fast two-site jumps
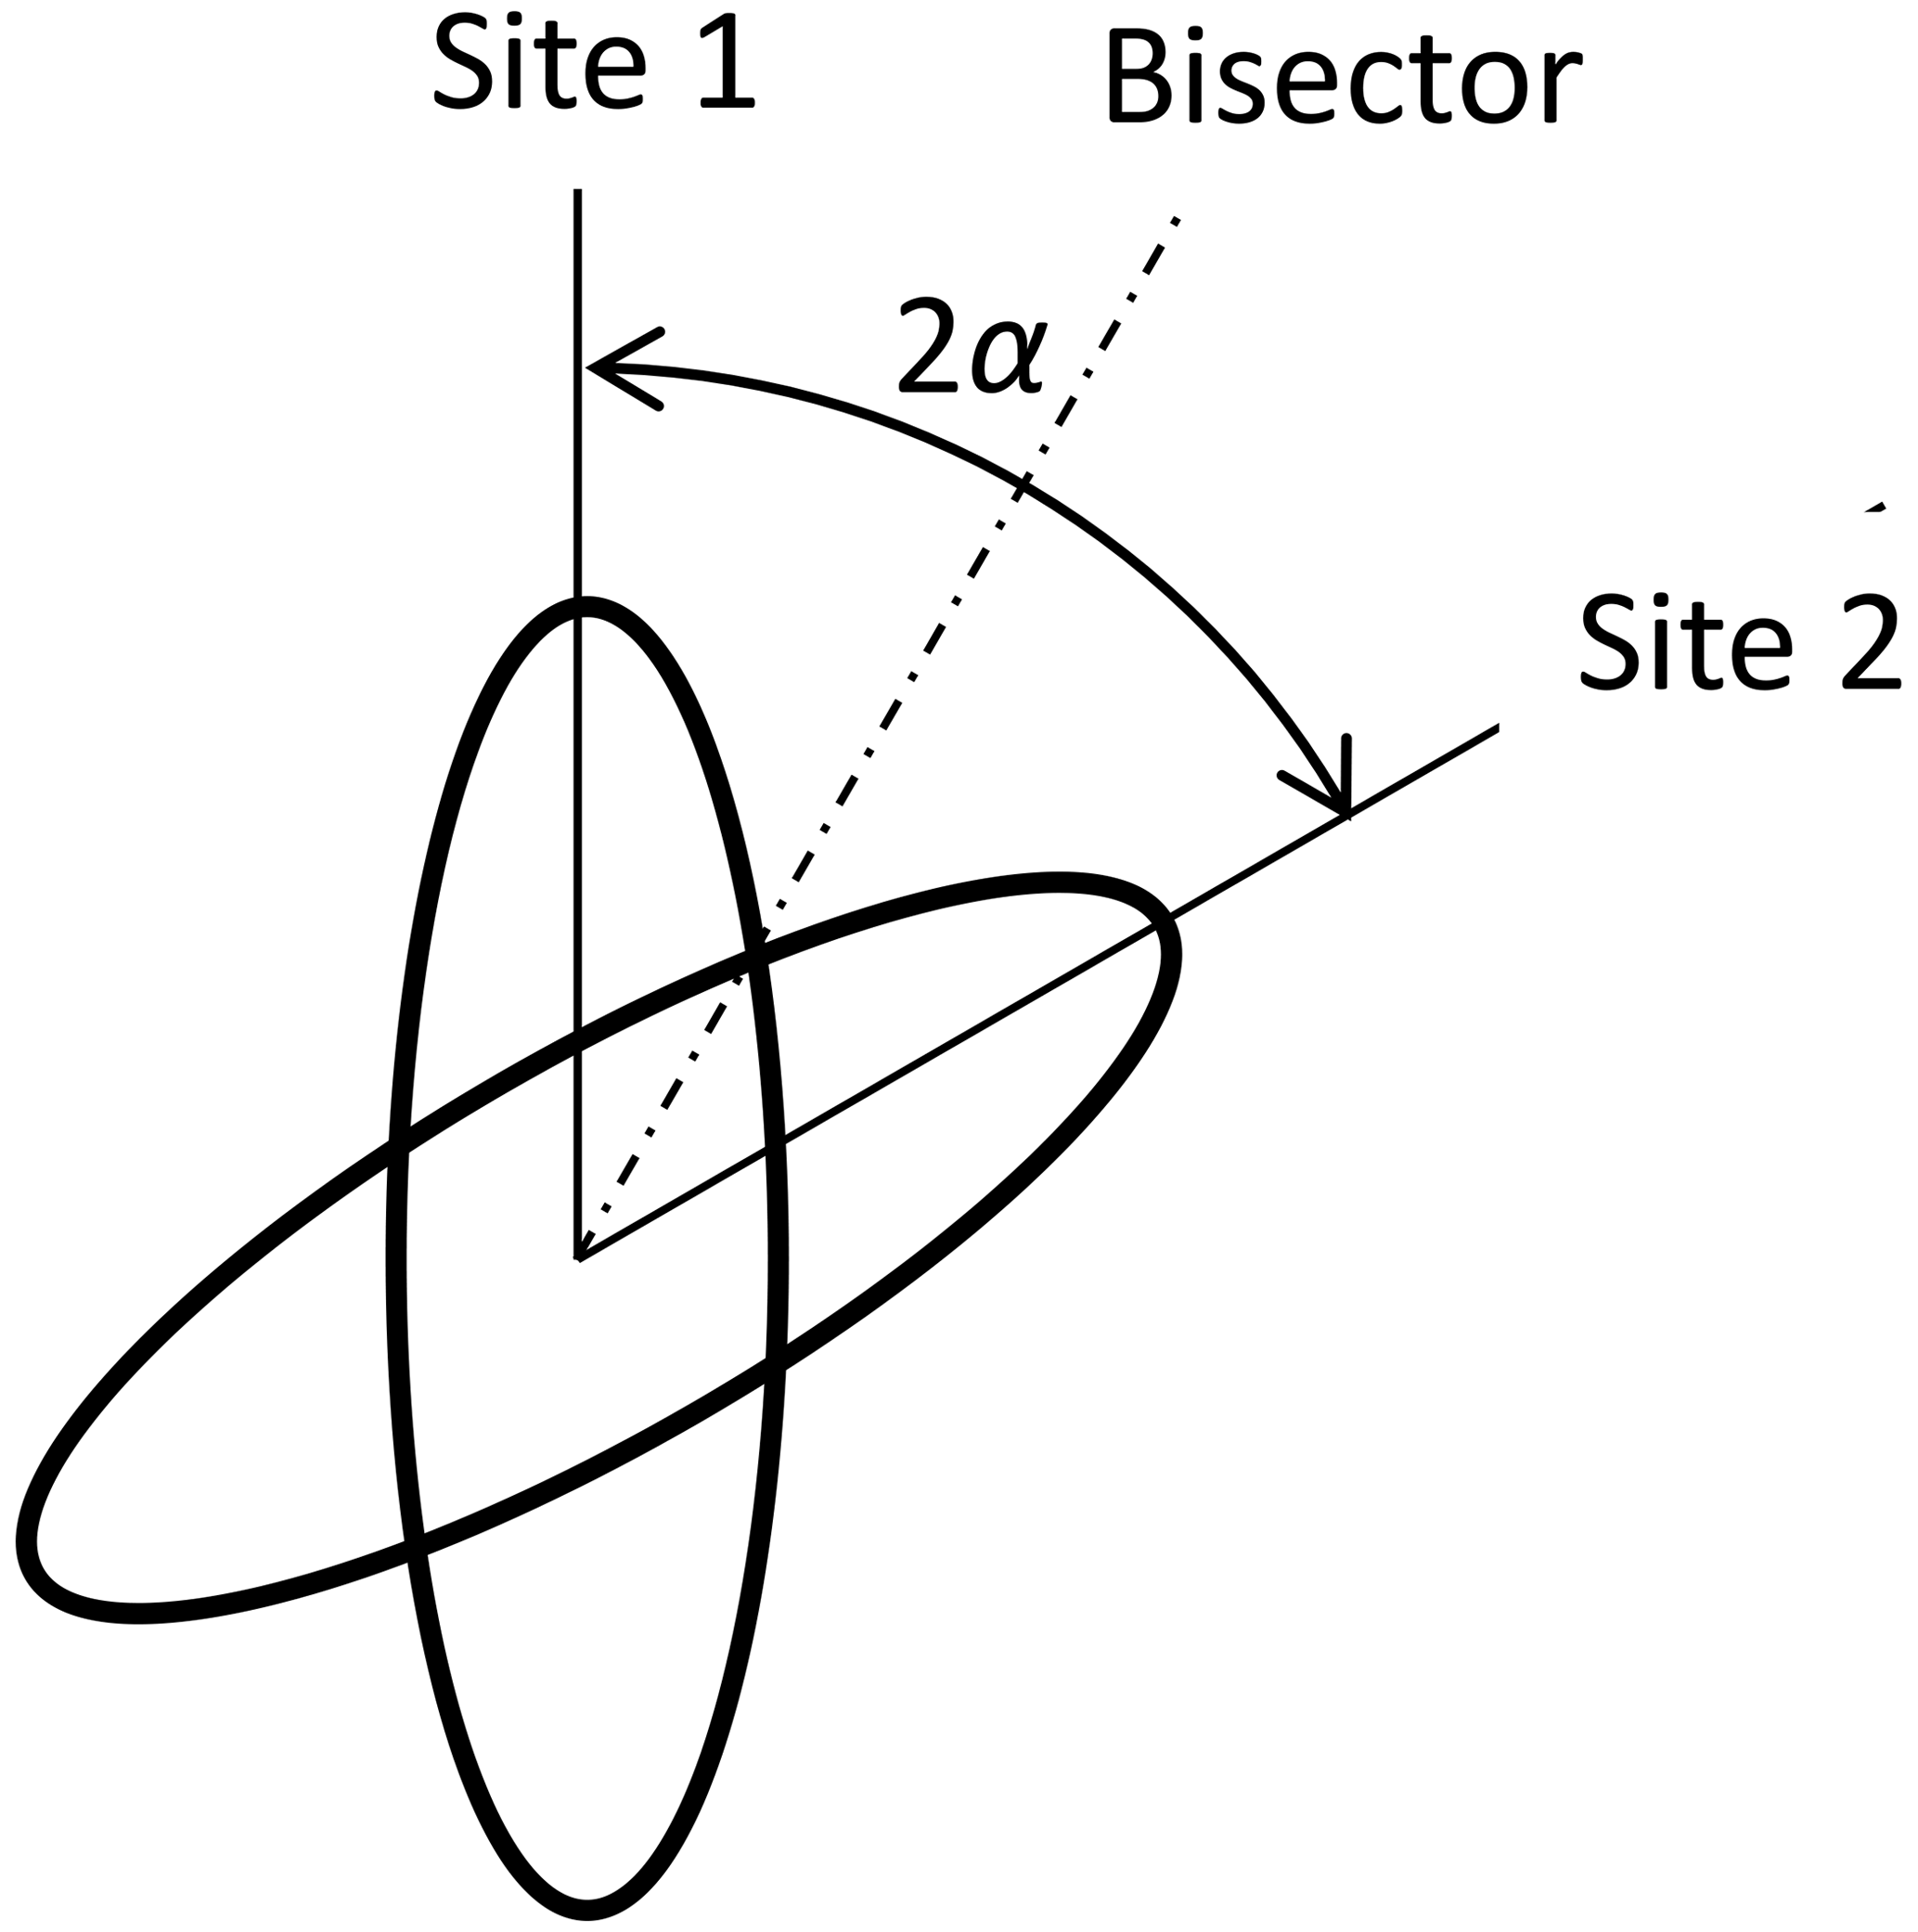
“Fast” means that the motional average is already complete at times which are relevant for the experiment. For the DIPSHIFT experiments, this is the time between the end of excitation and the beginning of data acquisition. Thus, the averaging must already be complete at the first time step in the indirect dimension, which is 1 order of magnitude smaller than the rotation period, i.e. about 20 µs. In the case of cross-polarization, this relevant time is of the order of the reciprocal of the dipolar-coupling constant, i.e. also about 10−5 s. The coefficients for model 2 are denoted by . The characteristic tensor is the average 〈D〉 of the tensors of both sites D1 and D2: see Fig. 2. We suppose that the sites are occupied with equal probability. The angle between the dipolar axes of both sites is 2α. In a frame where the z axis is along the bisector, the y axis is perpendicular to the plane spanned by the IS connection vectors of both sites, the x axis is in this plane perpendicular to the bisector, and both tensors are represented by the matrices D1 and D2 as
The average of both matrices is diagonal in this bisector frame:
In particular, in this work, 180° ring flips are of interest. This means that the flip angle for the CH bonds is 2α=120°:
In the latter case, the anisotropy is and the magnitude of the asymmetry parameter is . The cos-Fourier coefficients are
The explicit polynomial equations can be found in Sect. 6.1.
2.5 Model 3: IS2 spin system
Here it is assumed that the observed spin I interacts with two neighbouring spins S. The coupling constant for each single coupling is equal to D0, i.e. the distances between I, and both S are assumed to be equal. There are four combinations of the S spin orientations. The two combinations where the two Sz are parallel generate the tensor DΣ, and the two with antiparallel Sz generate the tensor DΔ. In the bisector frame (see Fig. 3), the tensor matrices are the same as in Eq. (6). The matrices of the sum and difference tensors for tetrahedral symmetry are
respectively. From DΣ we can read off directly the anisotropy as D0 and the asymmetry parameter η=1. DΔ has an eigenvalue vector which gives anisotropy and η=1. Hence the cosine coefficients for a tetrahedral IS2 spin system are
The polynomial equations can again be found in Sect. 6.1.
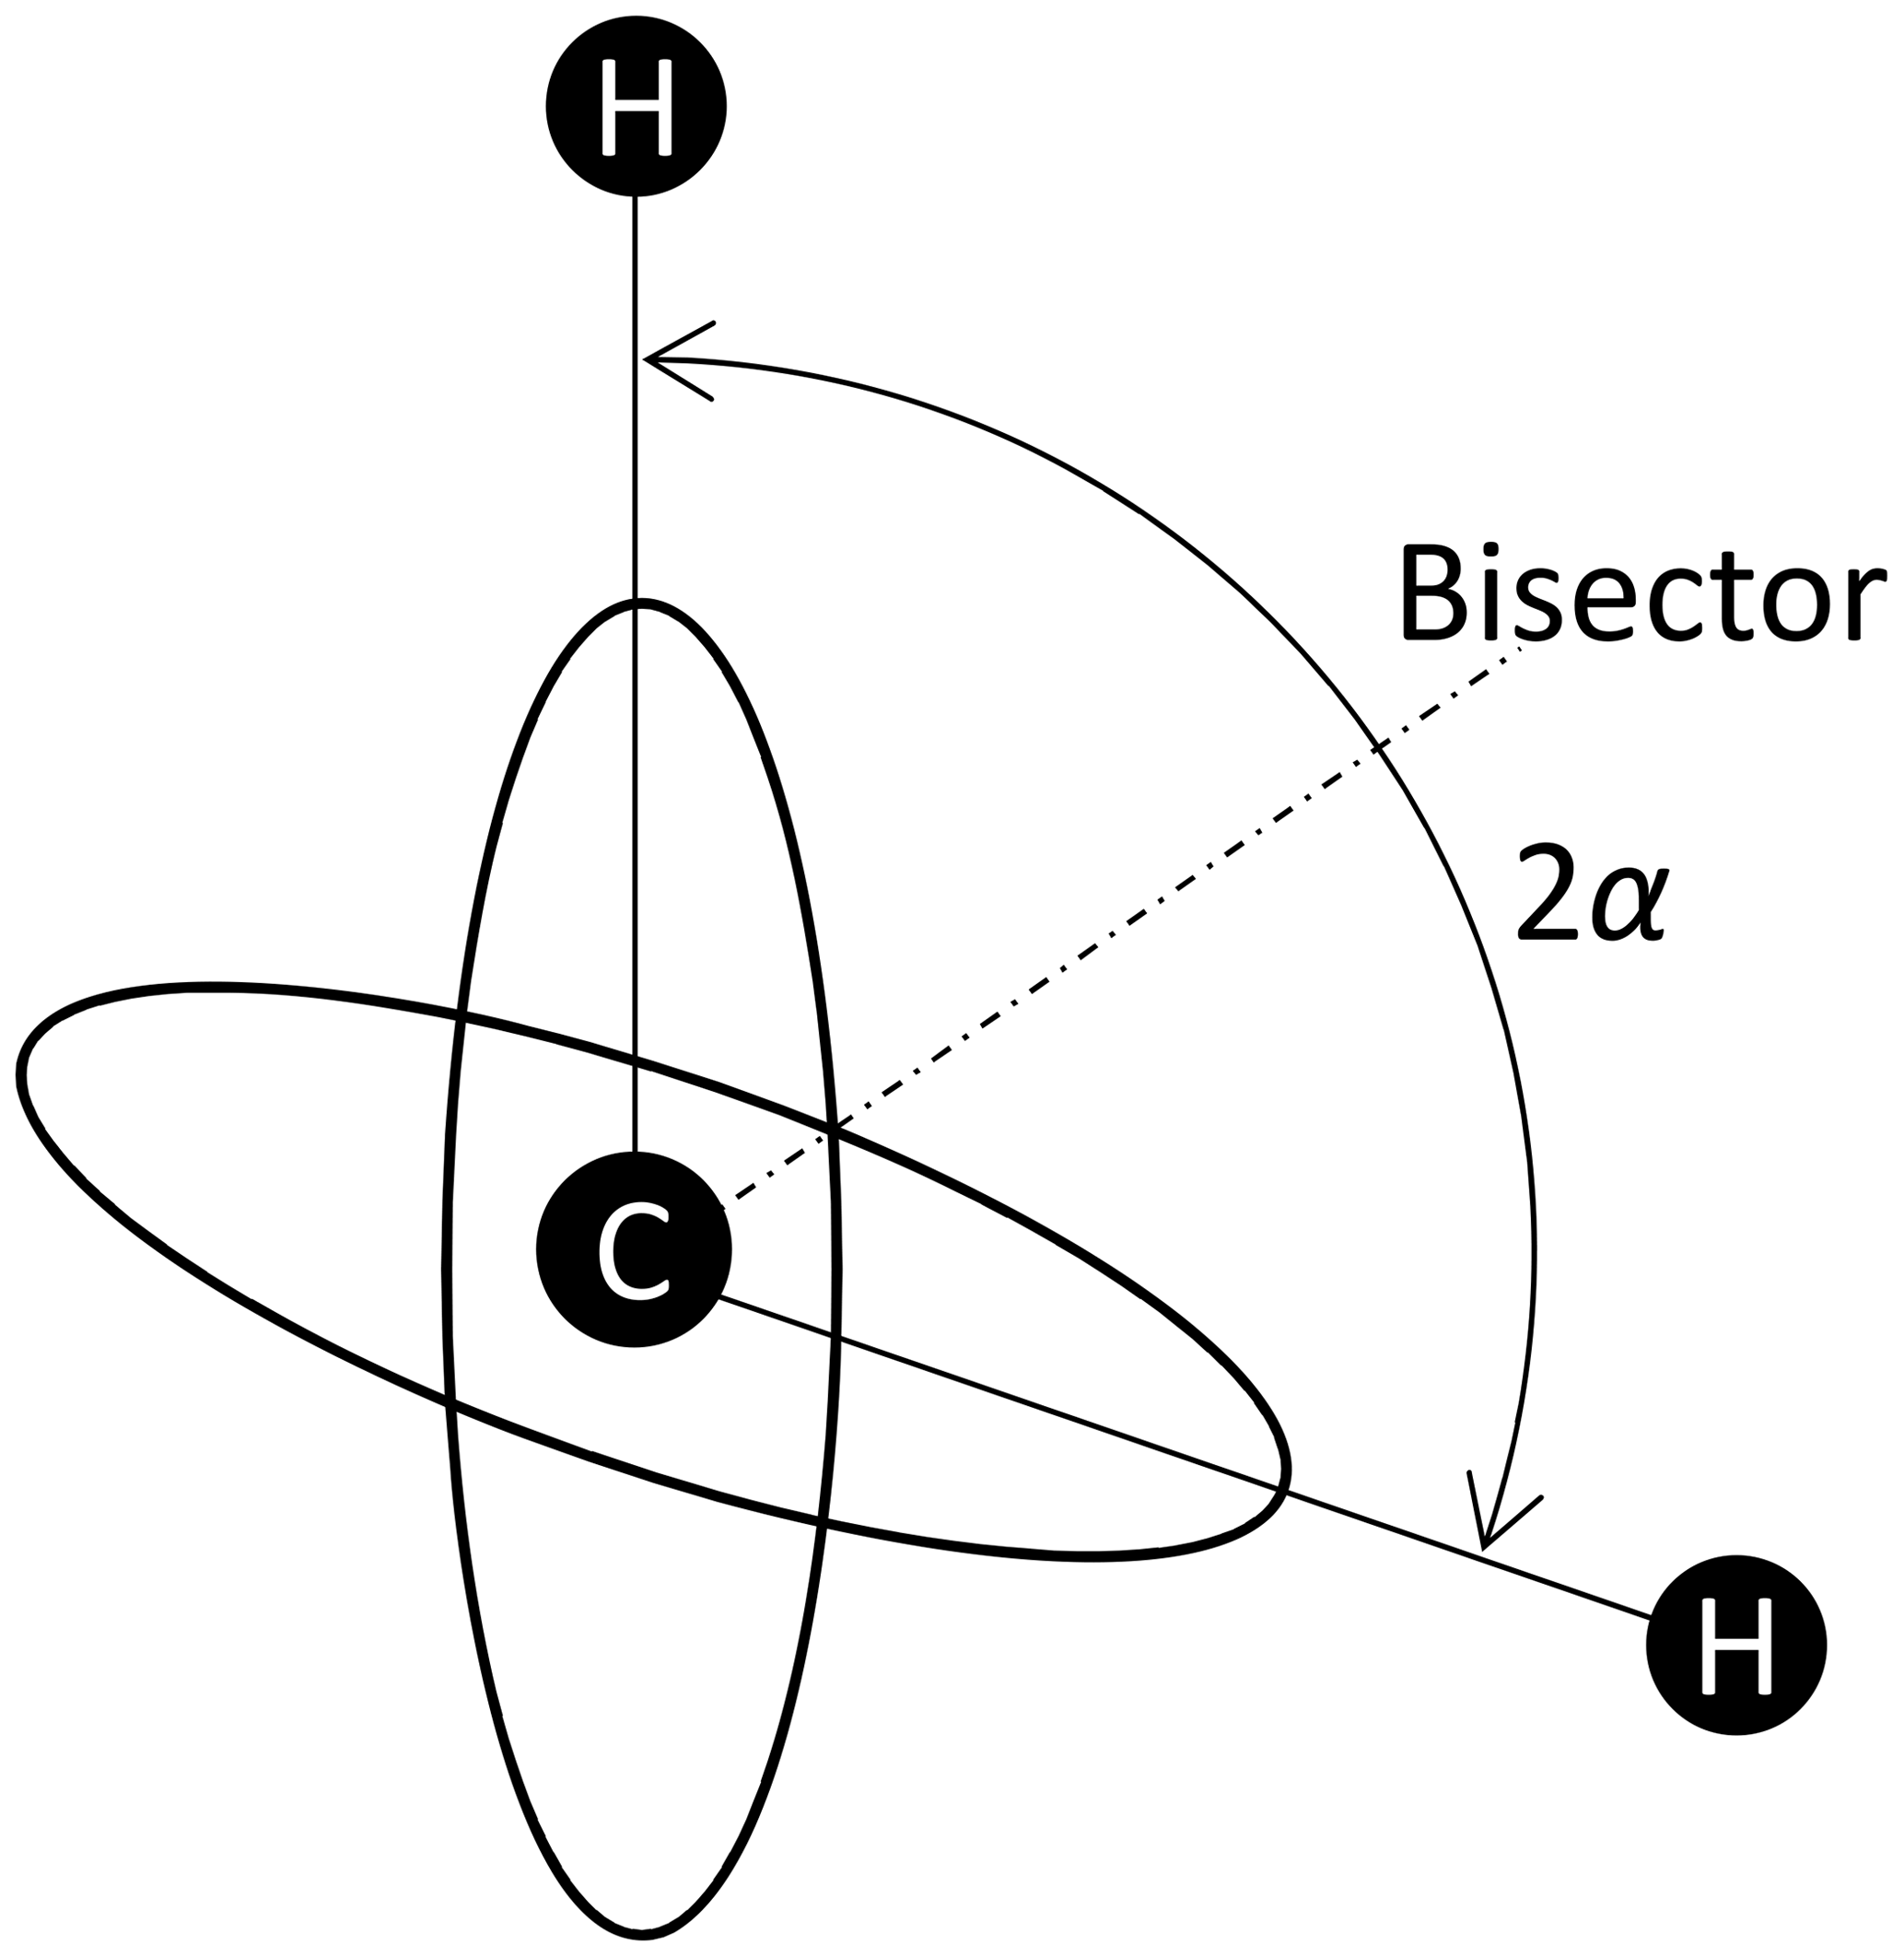
Figure 31H positions within a CH2 group. The angle between the C–H connection vectors is 2α. Supposing tetrahedral symmetry, .
2.6 Model 4: rapidly rotating methyl groups
Here we consider the special case of an IS3 spin system. The observed spin I resides in the middle of a tetrahedron, the three IS bonds have equal lengths and point to three corners of this tetrahedron, and the rotation axis points to the remaining corner: see Fig. 4. The tensor of a single CH coupling in a frame, the z axis of which is along the rotation axis, has the matrix
where φ is the instantaneous rotation angle around the z axis. Averaging over this angle, which is equivalent to fast-limit time averaging corresponding to a methyl group at not too low temperatures, gives for all three couplings a tensor matrix which is diagonal in this frame:
There are eight spin orientation permutations of the three S spins: see Table 1.
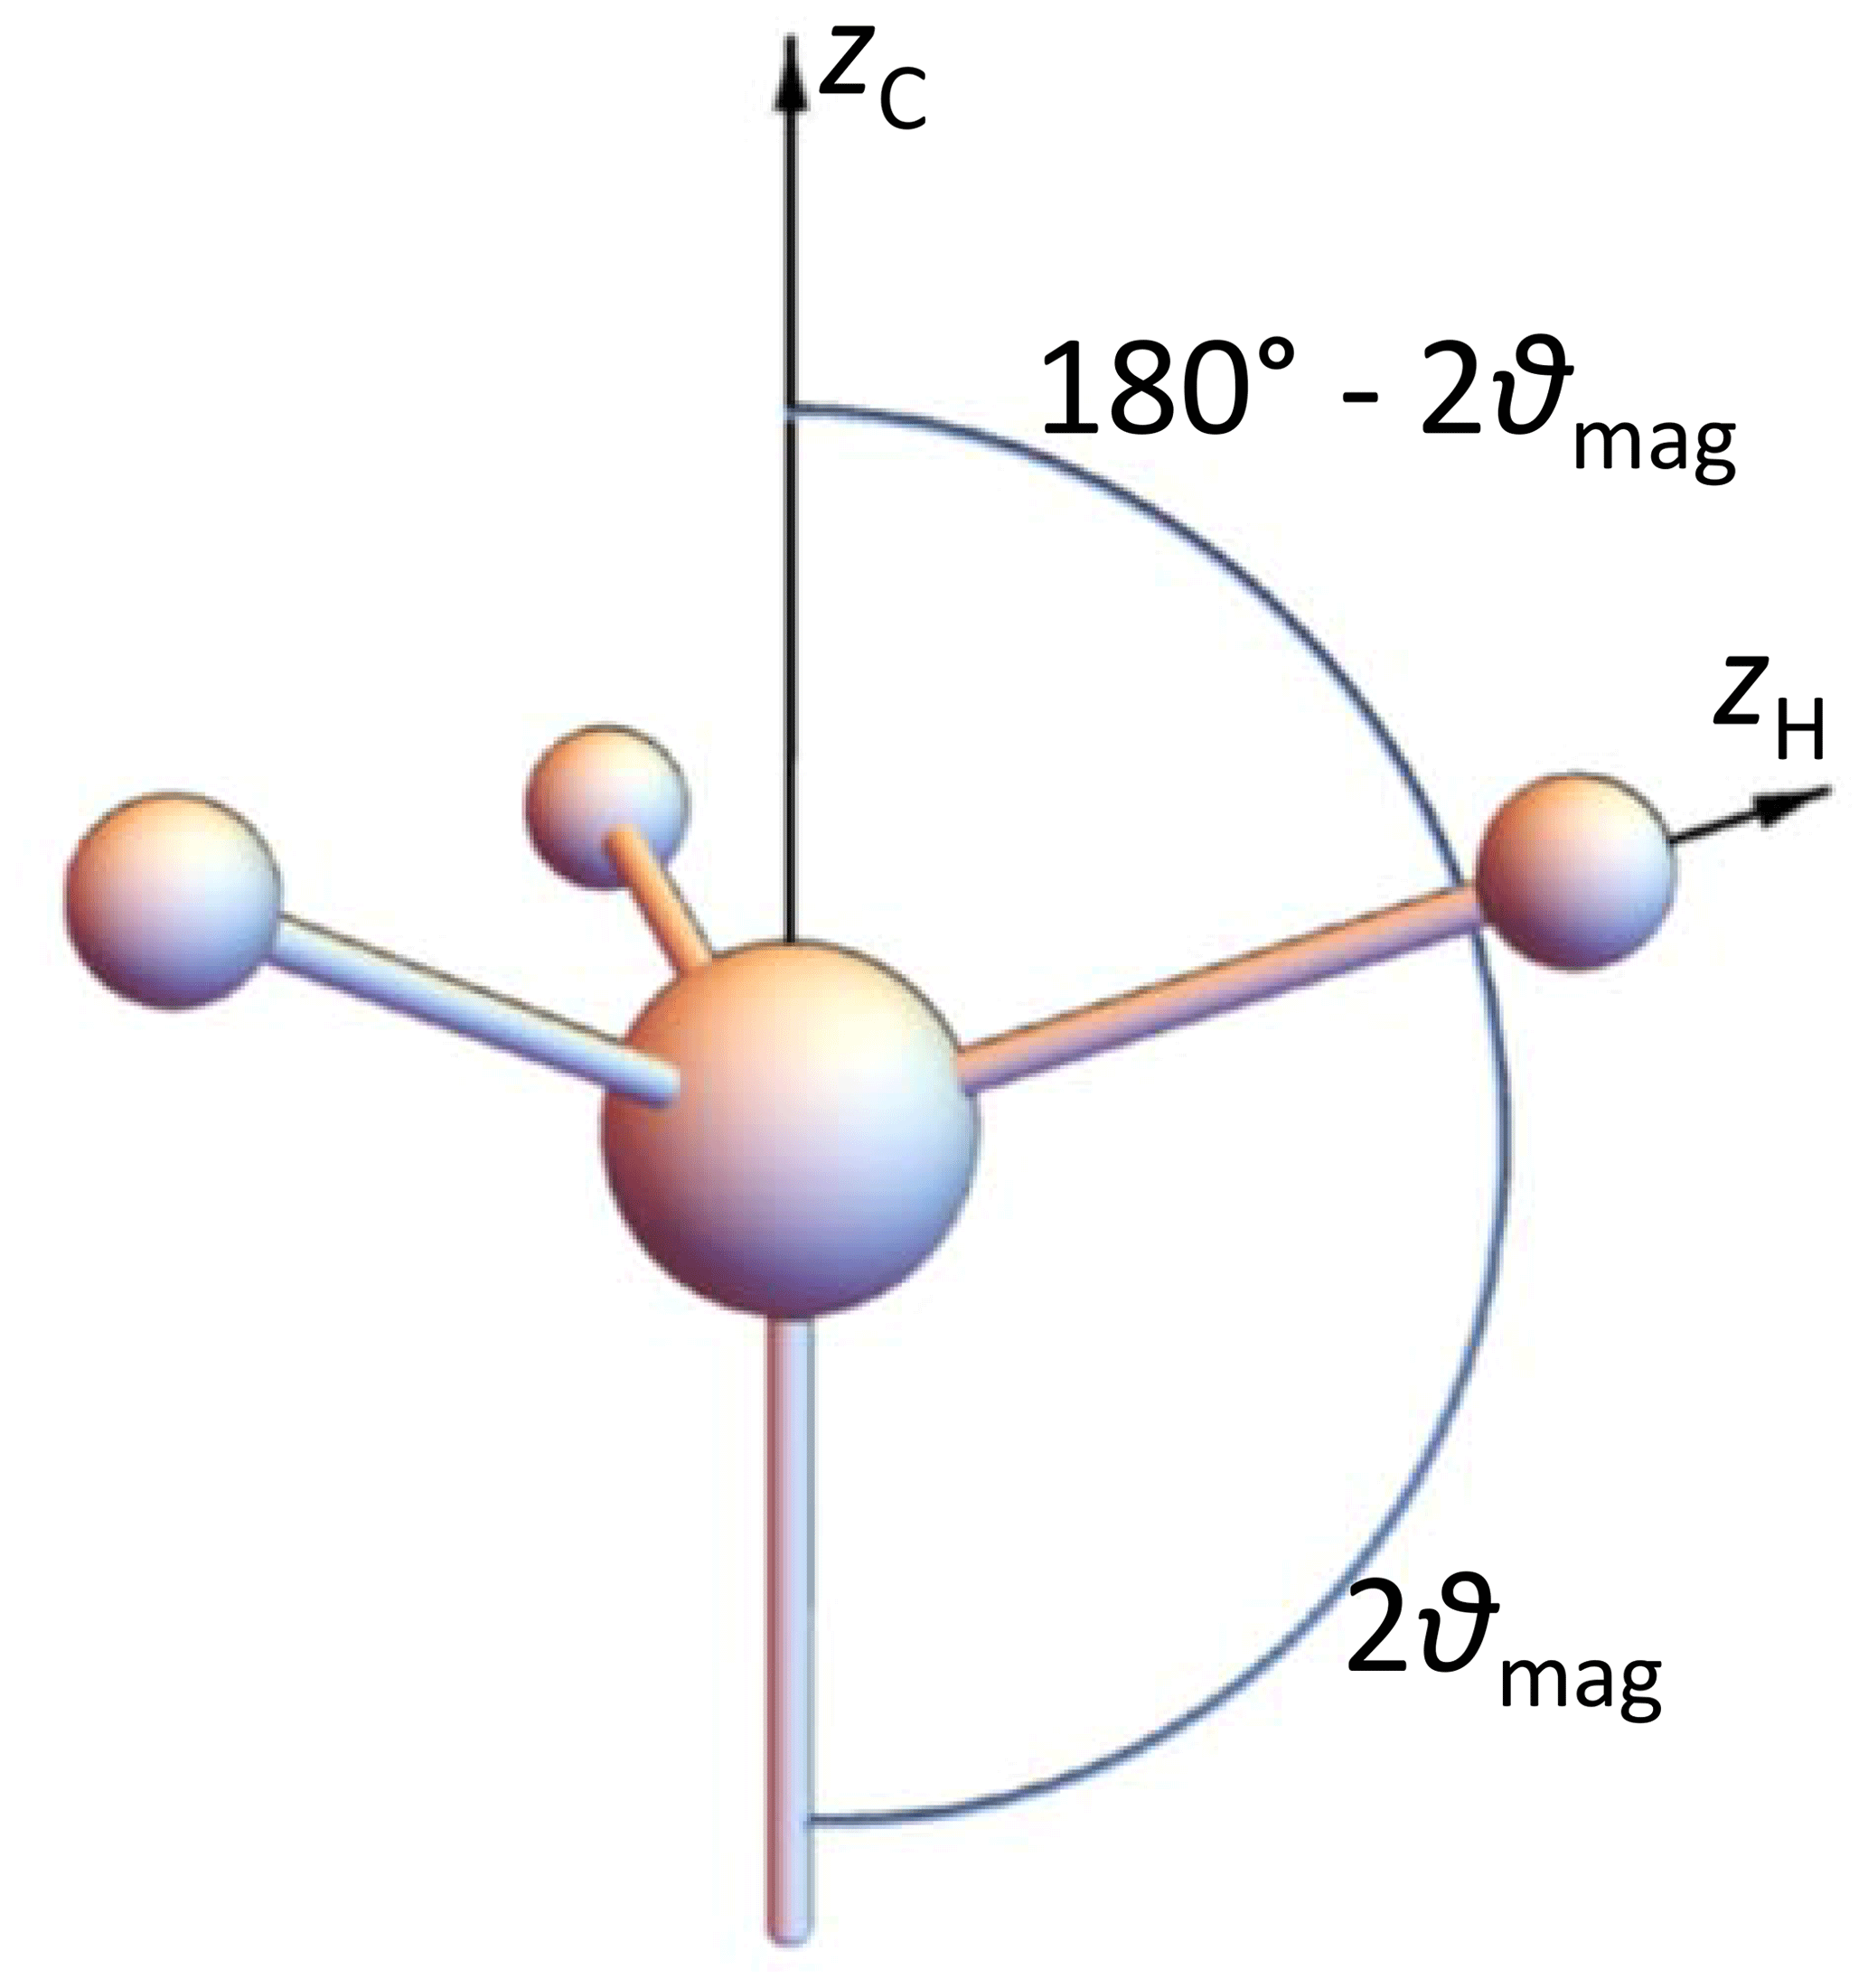
Table 1All possibilities of combining the orientations of the three proton spins in a CH3 group. The anisotropy and matrix of the sum tensor are displayed in the neighbouring columns.
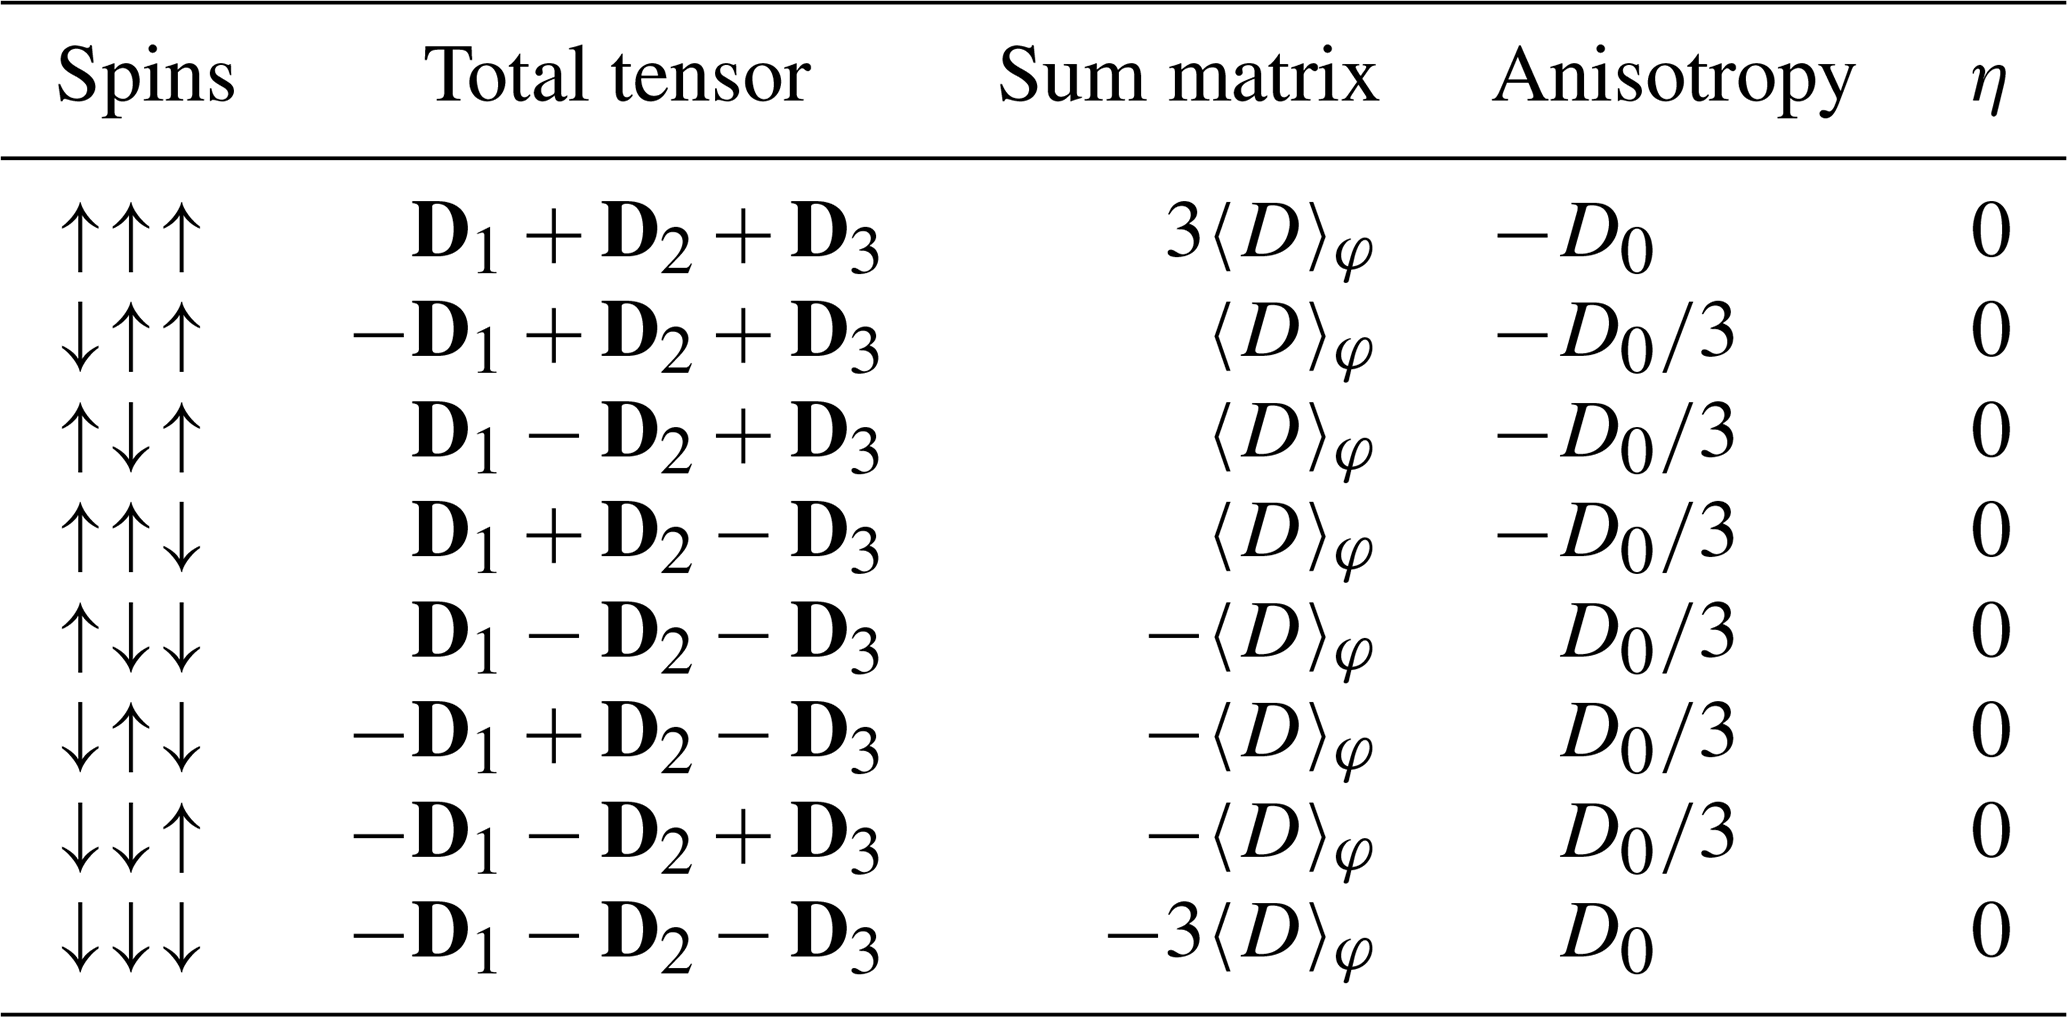
Considering that the anisotropy enters the Cm equations in even powers only, the cosine coefficients are
The explicit polynomial equations can again be found in Sect. 6.1.
2.7 Influence of remote protons
Because of the r−3 dependence of the dipolar coupling, the dipolar environment of protonated carbons is essentially determined by the directly bound proton(s) located at a distance of about 1.1 Å. The situation is less unique for non-protonated carbons, where several remote protons with similar distances to the regarded carbon are often relevant. Then, many details of the molecular geometry have to be considered to establish a model function. On the other hand, a restriction to allegedly dominant protons can be a reason for incorrect data analysis. As an attempt, the cosine coefficients Cm were calculated for the acetylenic carbons considering the closest protons of each neighbouring ring. Comparing this model function with experimental data, however, showed that the former does not reflect the real situation; the residual couplings obtained by the analysis are still larger than the full coupling expected from the model. Consequently, we restricted the DIPSHIFT evaluations to protonated carbons.
2.8 Fast anisotropic motion
As mentioned above, fast-limit averaging means that motional averaging is complete at times which are relevant for the experiment. The effect of fast-motional averaging can be described by tensor matrices with elements changed compared to the rigid case, hence also the anisotropy and asymmetry parameter change. Two general cases can be distinguished.
-
All three eigenvalues are decreased by a common factor which is called order parameter S. Then, the anisotropy is also reduced by the same factor; the asymmetry parameter stays constant. Variable D0 in the functions from above is then replaced by the residual dipolar coupling . Relevant examples are uniaxial rotation or rotational jumps between three or more equally distributed and populated sites.
-
The tensor eigenvalues change during the averaging process in a different manner. Then the introduction of a single-order parameter will not provide an adequate description of the situation, anisotropy and asymmetry parameter change non-trivially, and a new function has to be used. As an example, consider the above case of two-site jumps. The function had to be replaced by . This means that the asymmetry is reduced, but at the same time the asymmetry parameter increases from 0 (case of ) to (case of ). Thus, the tensor principal values of one case can no longer be represented as common multiples of the principal values of the other.
2.9 Intermediate motions
Intermediate motions, i.e. motions with a rate of range of the static-limit dipolar-coupling constant and/or the spinning frequency, interfere with the refocusing effect of MAS. This manifests itself in a damping of the rotational echoes or even in their complete disappearance. A rather weak echo damping is observed in our data sets. To analyze these, we need an analytical expression for this case, for which we took the heuristic approach of multiplying the rigid-lattice model functions derived above by an exponential damping function. The relevant questions are those conditions under which this can be an appropriate approximation and whether the fitted decay constant contains information on the motional timescale.
An approximate analytical expression for the MAS FID FAW(t) during slow or intermediate motion was derived by Hirschinger (2006) using the Anderson–Weiss (AW) formalism (Anderson and Weiss, 1953):
K(τ) is the orientation autocorrelation function of the motion under consideration. In the case of MAS, the expression derived by Clough and Gray (1962)
containing an assumed exponential decay describing the random motion with correlation time τc and multiplied by the coherent (oscillatory) correlation function of the MAS rotation, was inserted into Eq. (15). This gave the following.
This equation describes a dipolar FID, which is an echo train for large τc or a monotonous decay for fast motion, i.e. short τc. The echo train structure is already widely lost in the vicinity of ωrτc=1. However, it is an approximate expression because the AW approach restricts the cumulant expansion of the distribution of the reduced phase to the second-order term. Hence, all reduced-phase distributions are regarded as Gaussian distributions within the AW treatment because only for Gaussian distributions do all cumulants with order >2 disappear. This could be a good approximation for short times () (de Azevedo et al., 2008) as well as for long times (t≫τc). The reason for this is that, (i) for short times, higher cumulants (order 2n) are still without influence because they are connected to and, (ii) for long times, the reduced-phase distribution changes gradually toward a Gaussian distribution. The latter can be rationalized by means of the central limiting theorem, which states that the cumulants of order >2 decrease if a stochastic variable (here reduced phase) is the sum or integral of another stochastic variable (here frequency).
In between, we expect a “gap of validity”. Obviously, for sufficiently short correlation times () there is an overlap of both regions; here a gap of validity does not appear. For a rigid lattice, however, this gap ranges formally until infinity. For DIPSHIFT applications we have to consider that the data are usually plotted vs. in the interval [0,1]. To ensure that this interval does not reach essentially into the validity gap, should be smaller than . In other words, . In fact, a numerical comparison of model function 1 (Eq. 5) with Eq. (17) for τc→∞ and shows that deviations become relevant if this threshold is exceeded.
de Azevedo et al. (2008) investigated the quality of the AW approximation for the DIPSHIFT experiment by comparison of Eq. (17) with numerically calculated data. Their results show that the deviations between Eq. (17) and experimental data are maximum in the intermediate region. Cobo et al. (2014) did that in a similar manner for a related (re-coupled) experiment (rec-DIPSHIFT). This concerns situations where the echo structure of the FID is damped strongly.
Conversely, if we observe a weak damping of the echo train, we may conclude that the influence of intermediate motions is negligible (except for fast motions: see above). This means that, in this case, ωrτc≫1. With this condition, Eq. (17) can be simplified to
where Frigid(t) denotes the FID without slow thermal motion and fr is the spinning frequency of the sample. The damping constant is defined as
It is notable that the damping constant is proportional to in a plot vs. t and is even proportional to in the DIPSHIFT typical plot vs. . Numerical studies showed that the condition τc≪Tr is tied to the intensity of the first rotational echo being at least half of the initial value.
The static part of Eq. (17) is obtained for τc→∞ as
We have confirmed numerically that any relevant deviations from the polynomial formulae occur if is comparable to or larger than 0.5. Consequently, Frigid(t) in Eq. (18) is represented by Eq. (3), where the Cm are the corresponding coefficients derived for the four models shown above.
2.10 Second moment
The equations derived by the AW approach contain the second moment M2 of the overall dipolar interactions.
S(ω) is the distribution of the frequency deviations from the centre of the resonance. In other words, it is the line-shape function. An ensemble of spins in the sample with equal atomic positions and equal spatial orientations (polar coordinates {θ,φ} of the z axis of the tensor main frame) contributes to the spectrum at the two positions:
The whole line-shape function is the sum over all individual lines which are assumed here to be δ functions:
Inserting Eqs. (23) and (22) into Eq. (21) gives
Now we can use the effective anisotropies and asymmetry parameters of the four models discussed above and obtain
The last two expressions were obtained as averages between the corresponding expressions from both the sum and difference tensors mentioned above. They are equal to the expressions for the second moments of multi-spin dipolar interactions; in the case of CH3, the fast rotation of this group was considered.
2.11 Parameter fit to experimental data
From the model functions and the exponential damping approximation, the following expressions can be obtained that are immediately applicable for the data fit in the four respective cases mentioned above ().
For each sample, data were recorded at different temperatures and different spinning speeds fn. For each spinning speed, eight data points were recorded along the indirect dimension t1 at times . The fitting procedure consisted of minimizing the summed square deviation χ2 between the data and model functions:
To obtain information about the accuracy of the resulting parameters, the region in the Dres,r plane was considered, where .
3.1 13C solid-state NMR spectroscopy
One part of the 13C solid-state NMR experiments (spectroscopy, HETCOR, solid-state APT, HMQC) was performed on a Bruker Avance NMR spectrometer operating at 75 and 300 MHz for 13C and protons, respectively, using a commercial 2.5 mm MAS NMR probe. 1H→13C CP spectra were recorded with a contact time of 4 ms; 15 000 scans with a recycle delay of 2 s were accumulated. The radio frequency (rf) field strength applied during the CP contact and during the dipolar decoupling corresponds to a nutation frequency of 110 kHz.
To record the directly excited 13C spectra, 1350 scans were accumulated with a recycle delay of 180 s. The decoupling field strength corresponded to a nutation frequency of 110 kHz.
During the HETCOR experiments, a contact time of 0.7 ms was used: 64 scans with a recycle delay of 2 s were accumulated for each FID, and 450 increments were executed. Ramped 1H→13C cross-polarization (Pines et al., 1973; Metz et al., 1994) and SPINAL-64 proton decoupling (Fung et al., 2000) were applied; the rf field strength corresponded to a nutation frequency of 110 kHz.
To record the solid-state 1H-13C APT spectra, we used for the CP excitation the same parameters as for the CPMAS experiments mentioned above, i.e. contact time 4 ms and rf field strength corresponding to 110 kHz; 20 000 signals were accumulated with a recycle delay of 2 s. 1H-13C through-bond HMQC spectra were obtained with 1600 scans per FID and 70 increments.
DIPSHIFT experiments were performed on a Bruker Avance III spectrometer operating at 100 MHz and 400 MHz for 13C and protons, respectively, with a commercial 4 mm MAS NMR probe. The spinning speed was varied as described in the Results section. The 1H nutation frequency was 60.5 kHz, which required an offset of 42.8 kHz for the Lee–Goldburg decoupling within these experiments. To establish the CP, the 13C rf field strength was set to the effective proton rf field of 74.1 kHz; 3200 to 6400 scans per t1 value were recorded with recycle delays of 2 s (25 °C) and 3 s (−15 °C). The temperature inside the rotor was calibrated using the 207Pb chemical shift of lead nitrate as a temperature reference (Ferguson and Haw, 1995). Adamantane served as an external shift standard.
3.2 Synthesis of the linker and PIZOF-10
The PIZOFs were obtained through the standard process described for PEPEP-PIZOFs (P stands for phenylene, E for ethynylene) by Schaate et al. (2011). For the synthesis of PIZOF-10, ZrCl4 (0.080 g, 0.34 mmol), HO2C[PE-P(O(CH2CH2O)3CH3, O(CH2CH2O)3CH3)-EP]CO2H (0.34 mmol), and benzoic acid (1.256 g, 10.29 mmol) as modulators were dissolved in 20 mL dimethylformamide (DMF). The solution was heated in a tightly capped 100 mL glass flask to 120 °C in an oven for 4 d. The precipitate was isolated from the mother liquor via centrifugation and washed by immersion in DMF for 30 min followed by centrifugation. The immersion and centrifugation steps were repeated with ethanol. The product was dried at reduced pressure, and the obtained dry powder was submitted to Soxhlet extraction with ethanol for 24 h. The mother liquor was again filled into a glass flask and heated to 120 °C. An additional fraction of the product was obtained within 24 h, which was isolated and washed as described for the first crop. All fractions were merged.
4.1 Spectral assignment of the 13C spectra
The solid-state 13C NMR spectra of PIZOF-2, PIZOF-10, and PIZOF-11 are well resolved. This allowed us to obtain almost complete 13C NMR signal assignment for these three samples (see Figs. 5 as well as S1 and S2 in the Supplement together with Table 2). Rough assignment of the solid-state 13C lines could already be obtained by a comparison to the liquid-state 13C NMR spectra of the dicarboxylic acid (used for the synthesis of PIZOF-10) in DMSO-d6. We observed very similar chemical shifts for most of the detected signals. Significant differences of the order of ca. 5 ppm occur for the carboxylate group (10) and the aromatic carbon (8) directly bound to (10). This is probably caused by the proximity to the metal atom. The signal assignment is further supported by the interpretation of liquid-state DEPT 135 as well as solid-state APT spectra (Fig. 5). Both methods are able to distinguish differently protonated carbons: in DEPT 135 spectra, the signals of CH and CH3 appear positive, whereas CH2 groups cause negative resonances. Quaternary carbons do not give any signal in DEPT 135. In analogy to the routine liquid-state APT method, for a certain internal delay, the CH and CH3 groups produce negative signals, while the resonances of quaternary carbons and CH2 groups are positive. Distinction between quaternary carbons and CH2 is also possible based on the significantly higher intensity of quaternary carbon signals compared to the signals of CH2. The signal assignments summarized in Table 2 are further corroborated by 1H-13C HETCOR and 1H-13C HMQC spectra: see Fig. 6.
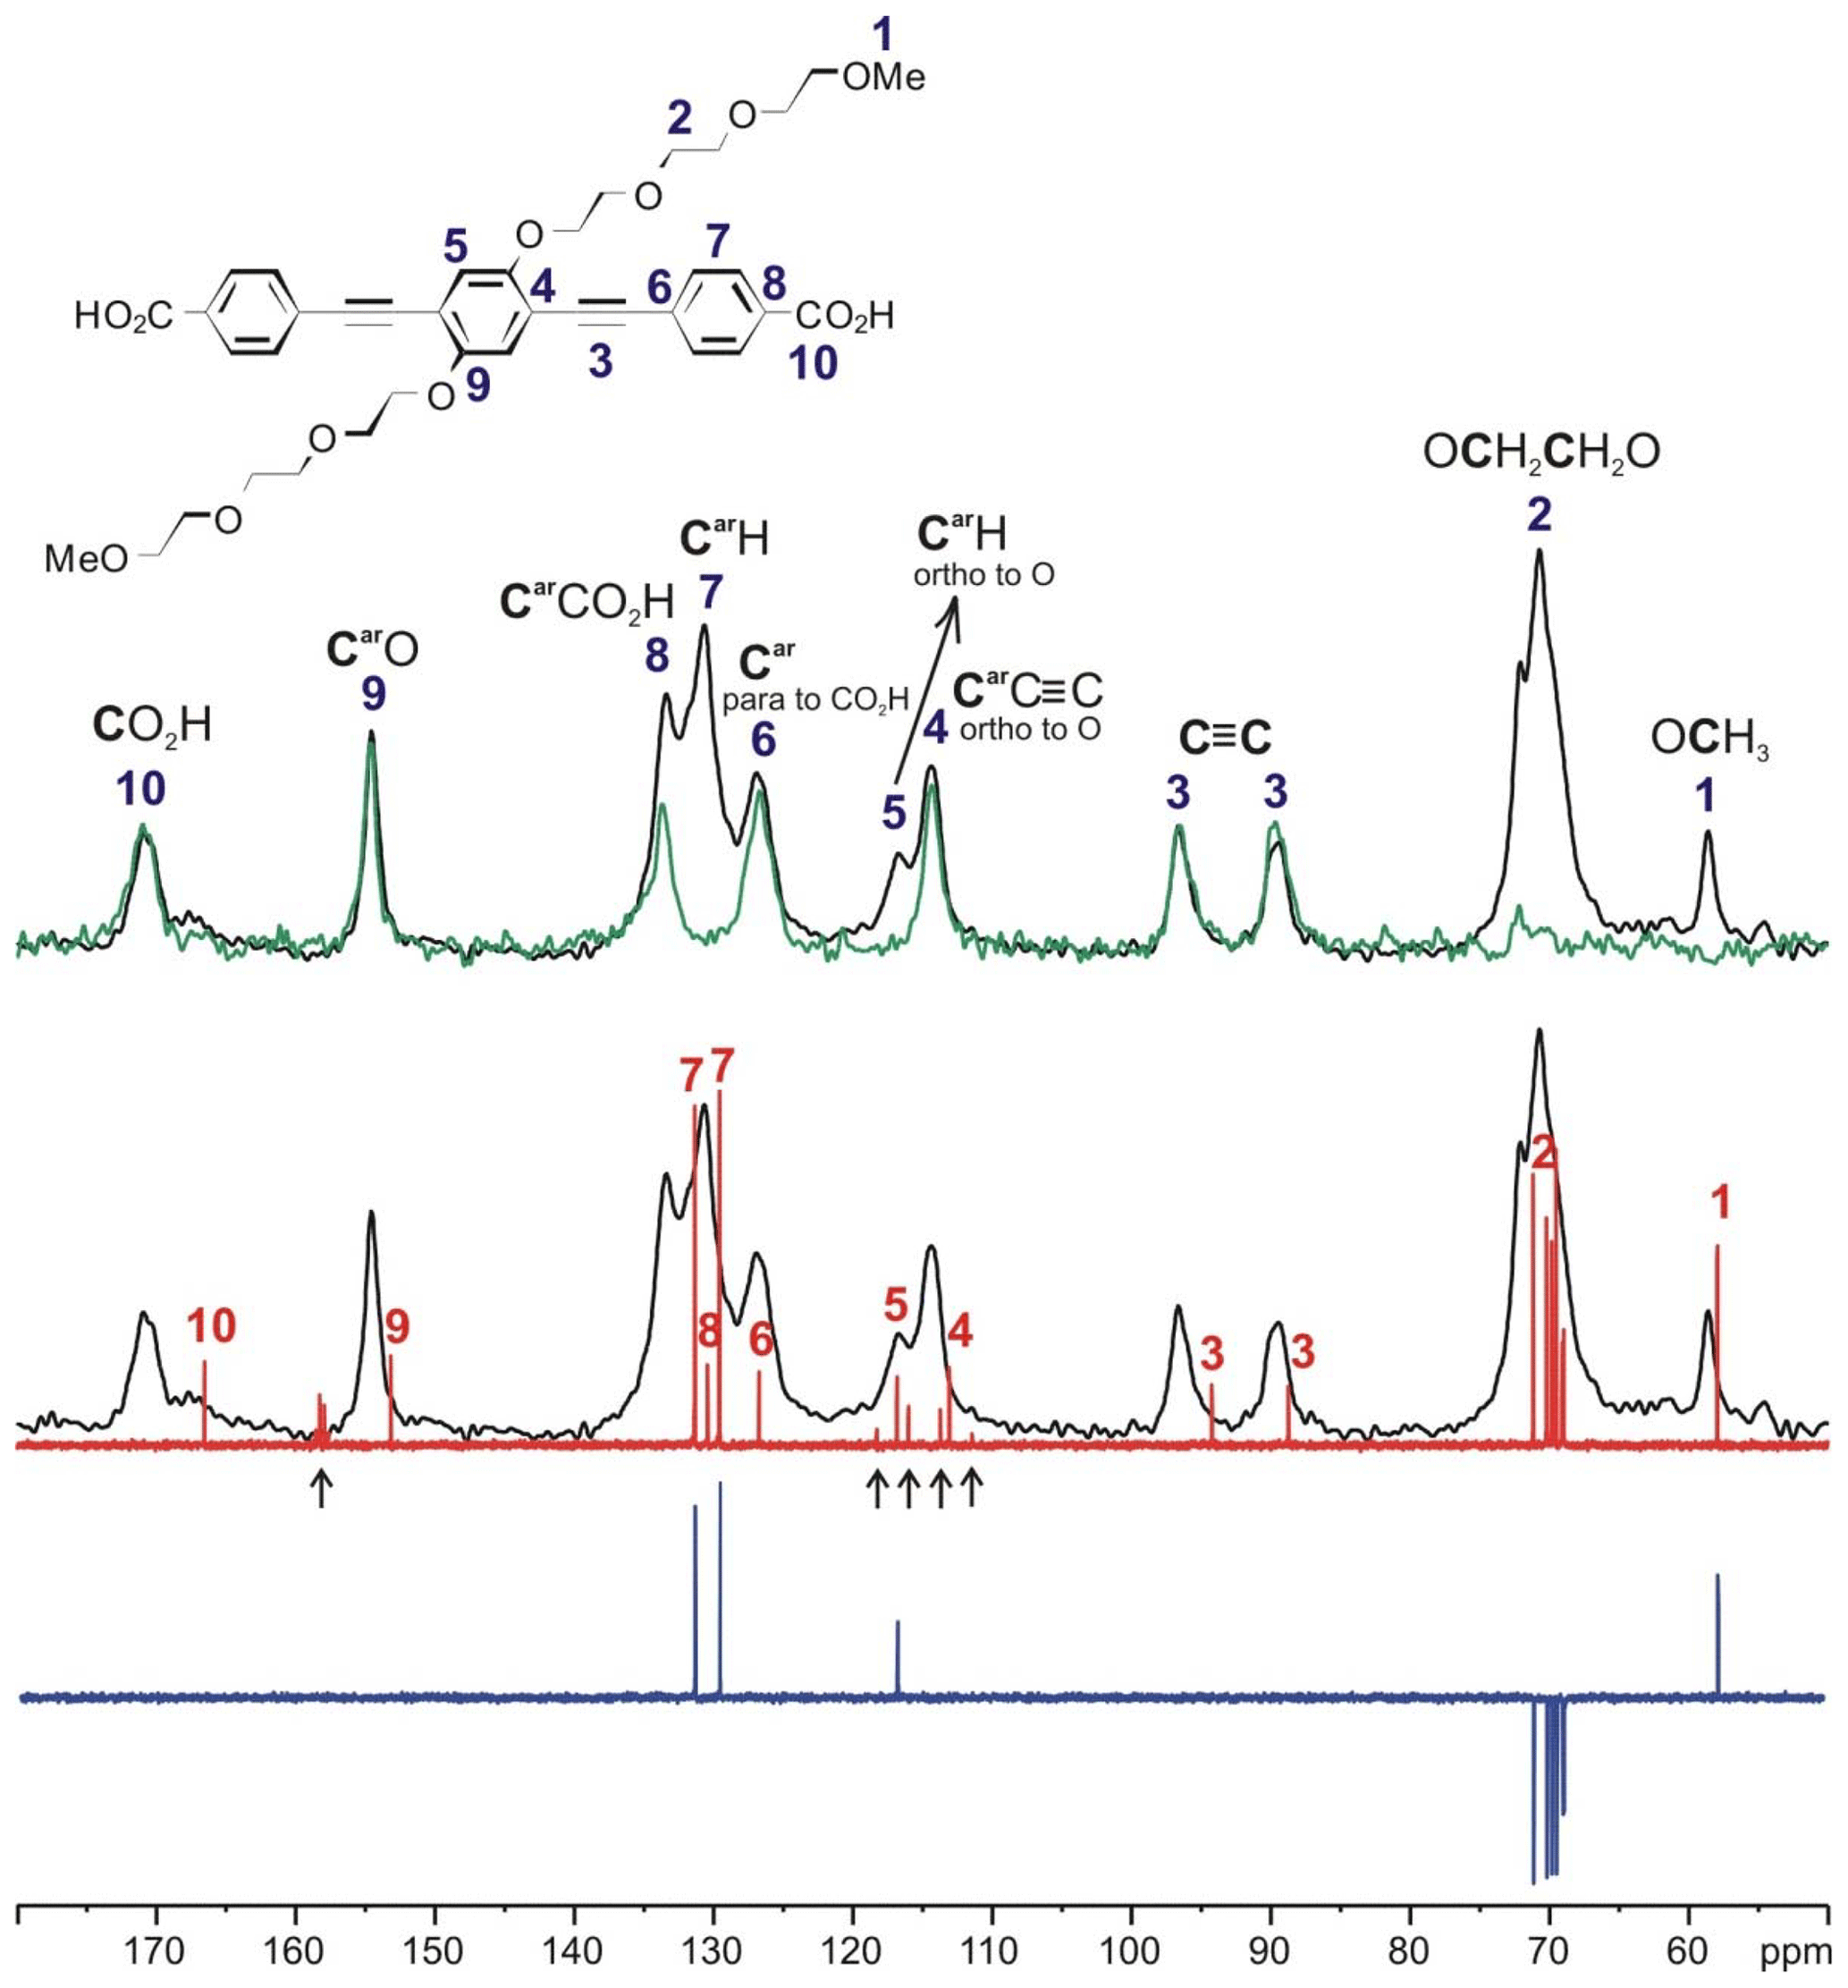
Figure 5Signal assignment for the 13C NMR spectrum of the linker of PIZOF-10 based on the interpretation of the 13C CP MAS NMR spectrum (black), 13C solid-state APT NMR spectrum (green), 1H broadband proton-decoupled liquid state (DMSO-d6), 13C NMR spectrum (red), and liquid-state (DMSO-d6) DEPT 135 13C NMR spectrum (blue). The signals marked with ↑ are assigned to trifluoroacetic acid, which was used in the last step of the synthesis of the linkers.
Table 2Assignment of the solid-state 13C NMR signals of PIZOF-10.


Figure 6Comparison of the 1H-13C HETCOR spectrum of PIZOF-10 measured at a short contact time (0.7 ms, black) and the 1H-13C HMQC spectrum (red).
Comparing the solid-state 13C spectra of the different PIZOFs, we found the most relevant differences between the spectra of the different PIZOFs in the CH2 region, showing the different kinds of side chains, and in the aromatic region between 111 and 118 ppm. While the PIZOF-2 spectrum simply contains the OCH3 resonance, no complete resolution is found for the different aliphatic carbon positions in the chains except for PIZOF-11 at room temperature. Further, the resonance of the CH of the central benzene ring overlaps with the line of . It could be separated for PIZOF-10 and PIZOF-11: see below. For PIZOF-2, however, a complete overlap of both resonances occurs, which does not permit a DIPSHIFT analysis of the central-ring CH at all.
4.2 Indication of anisotropic motions of the side chains
Figure 7 shows the directly excited 13C MAS NMR spectra as well as 13C CP MAS NMR spectra measured with 4 ms contact time for the three samples under study. If the long side chains in PIZOF-10 and PIZOF-11 were liquid-like and would move isotropically, the 1H-13C CP efficiency should be very low or even zero as compared to the 13C signals of the other framework carbons. The existence of rather strong aliphatic lines implies interpretations either as a consequence of slow motion of the chains, or as indeed fast but spatially restricted reorientation. The latter leads, even for very short correlation times, to a non-zero residual dipolar coupling (see above), which enables cross-polarization even in the case of a fast motion. To distinguish between these cases, the DIPSHIFT method was used.

Figure 7Comparison of directly excited 13C MAS NMR spectra and 13C CP MAS NMR spectra (4 ms contact time) of PIZOF-2, PIZOF-10, and PIZOF-11.
4.3 Line decompositions
As explained above, we focus on the signals of protonated carbons for the DIPSHIFT data. This concerns the CH of the lateral rings (overlapping at about 130 ppm with the resonances of some quaternary C) and the CH of the central ring. In PIZOF-10 and PIZOF-11, the related lines overlap partially with the line of the quaternary C bound to the acetylenic C (in PIZOF-2 there is a complete overlap which could not be resolved: see above). The side-chain resonances in PIZOF-10 and PIZOF-11 feature some overlap; their resolution could deliver information about the order parameter gradient along the side chain. It turns out that, despite the enhanced uncertainty because of decomposition, well-defined plots of intensity vs. were obtained.
Concerning the aliphatic region of PIZOF-11, while at 30 °C five CH2 lines are well resolved, at −15 °C there is a strong overlap because of increased line broadening. Figure 9 shows a decomposition in Lorentzian components. The lines could be assigned to the atomic positions by means of the predictions of ACD software (Advanced Chemistry Development Inc., 2017). Most lines at −15 °C can be assigned immediately to corresponding lines of the 30 °C spectrum, with one exception: the central resonance (δ position) seems to split at lower temperatures into two overlapping components. The position of one of them corresponds to δ in the 30 °C spectrum, and the other at a distance of about −1.2 ppm is denoted here as δ1. It is possible that different conformations (e.g. trans and gauche) along the chains are frozen-in at −15 °C, whereas faster motions at 30 °C average them, leading to an average chemical shift.
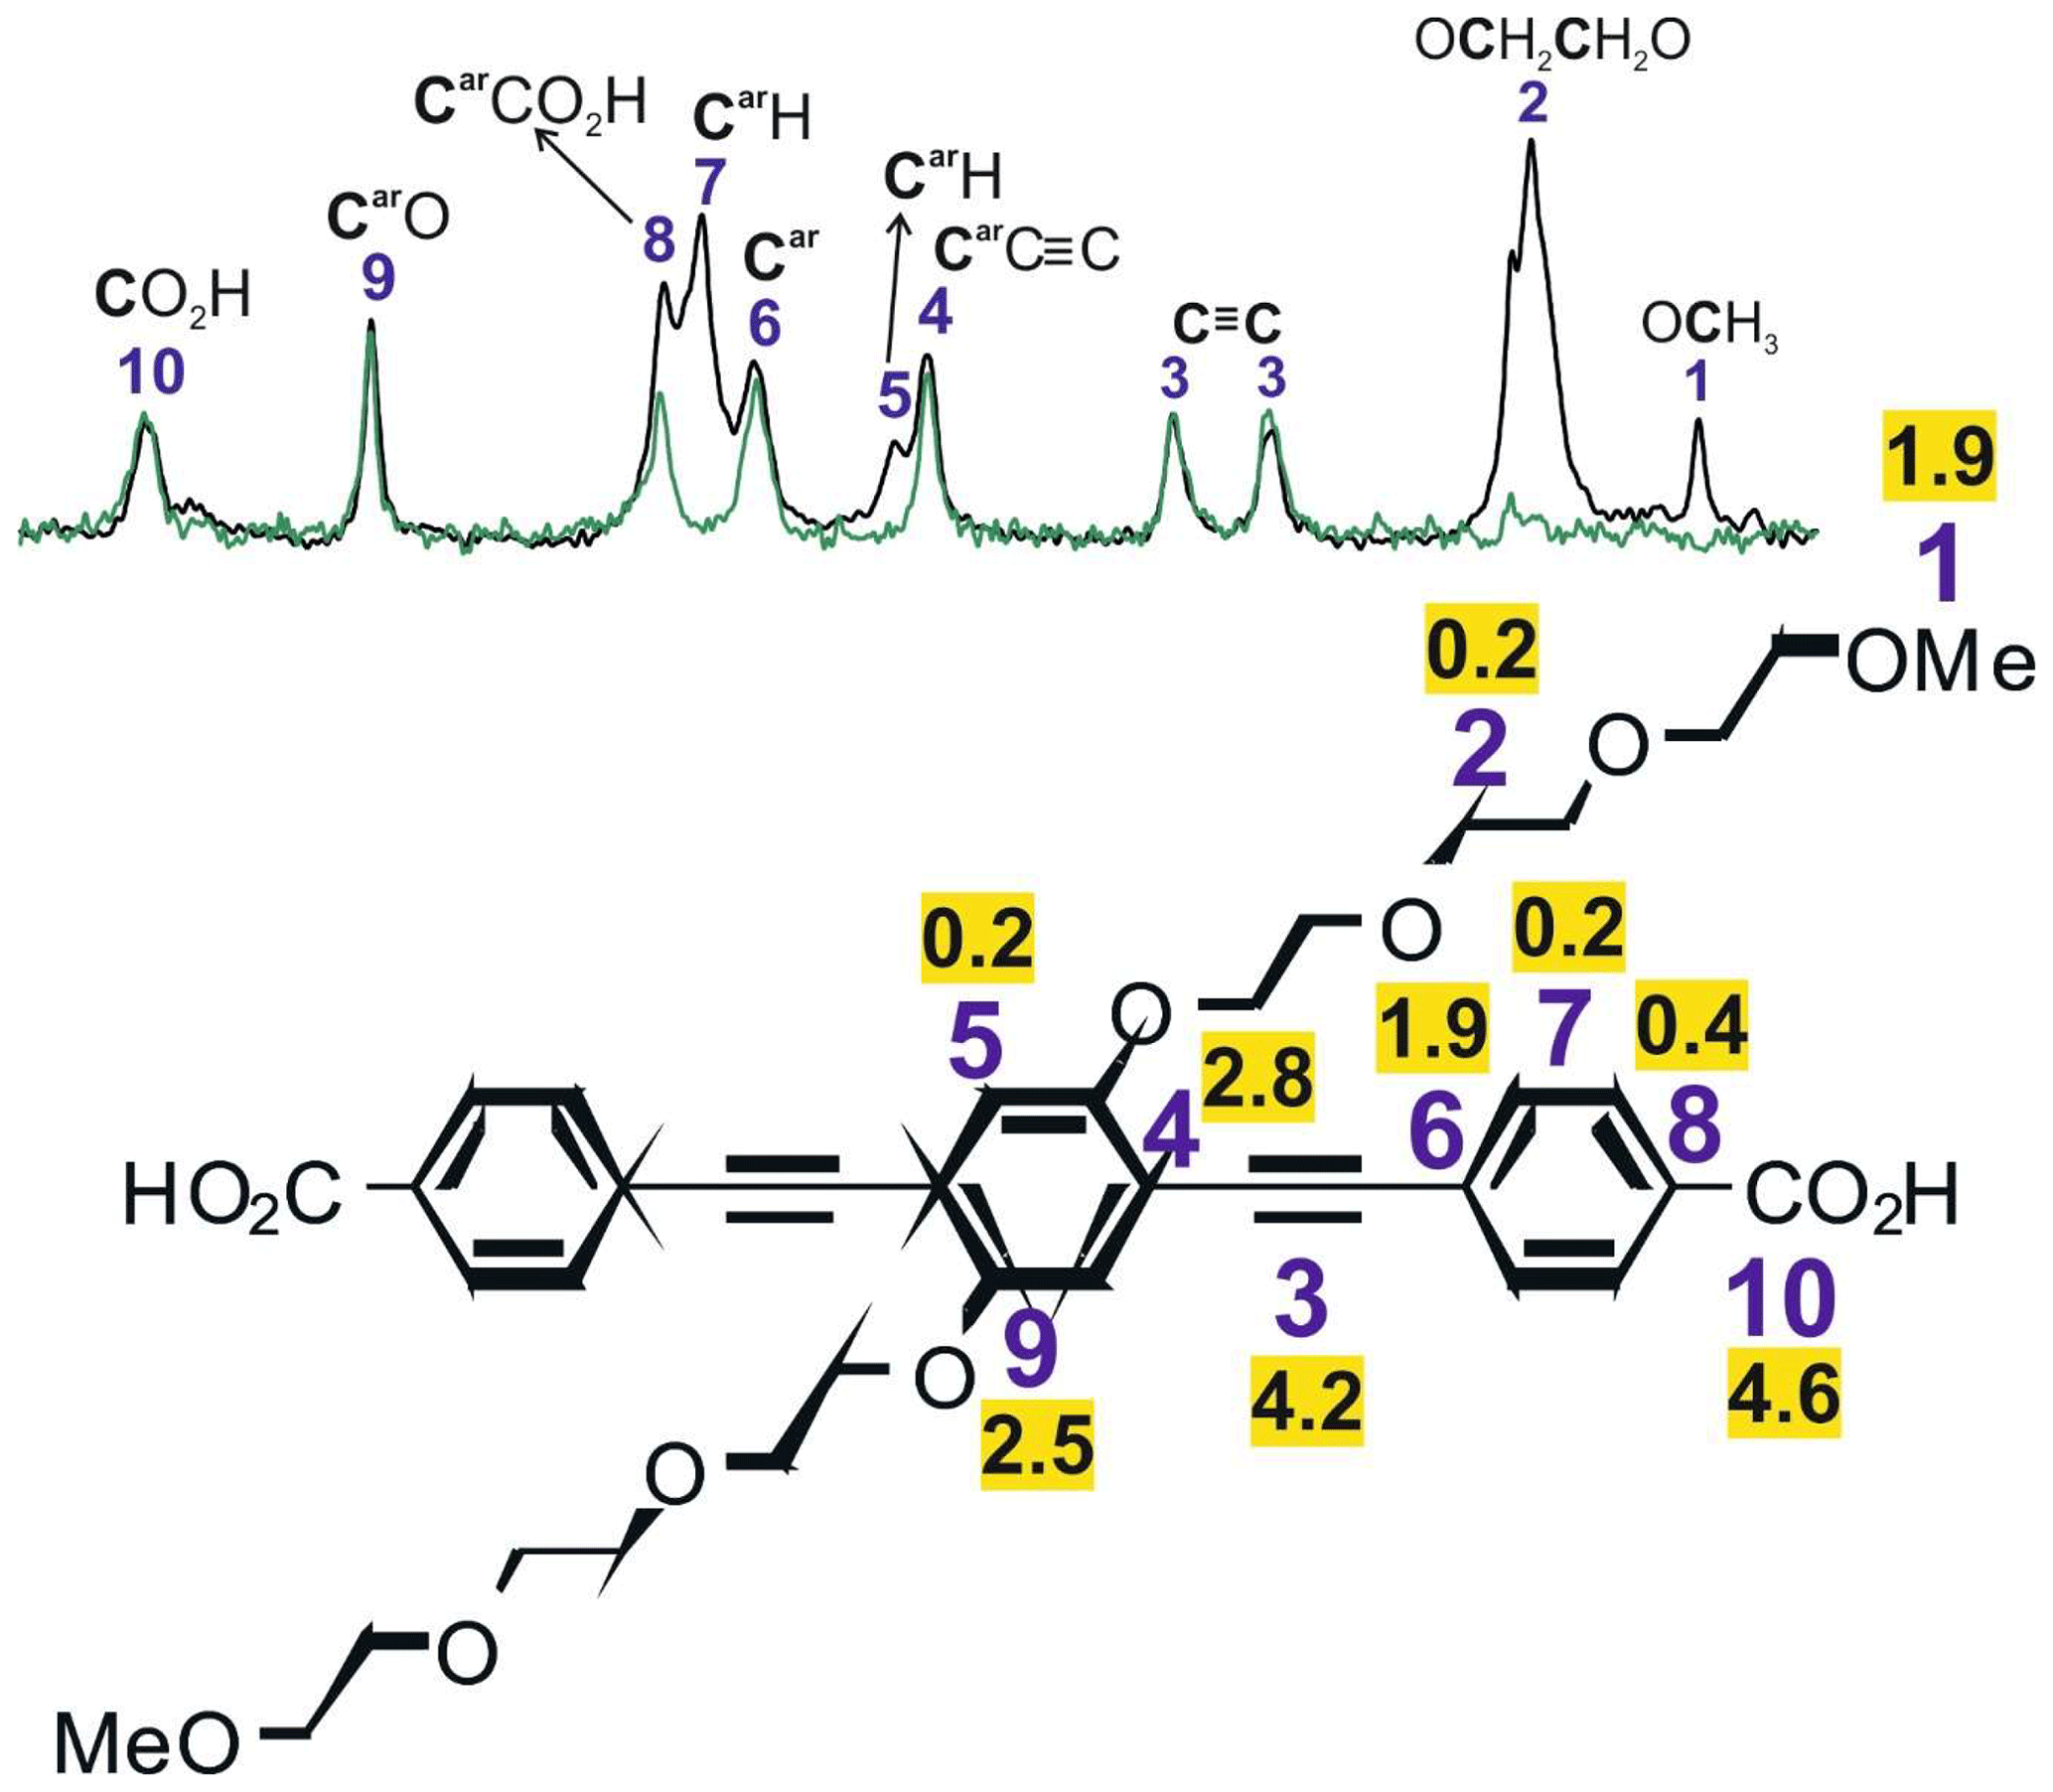
Figure 81H-13C CP buildup time constants (ms) for selected 13C signals of PIZOF-10. In the upper part, the 13C CPMAS spectrum (black) and the solid-state APT spectrum (green) are shown.
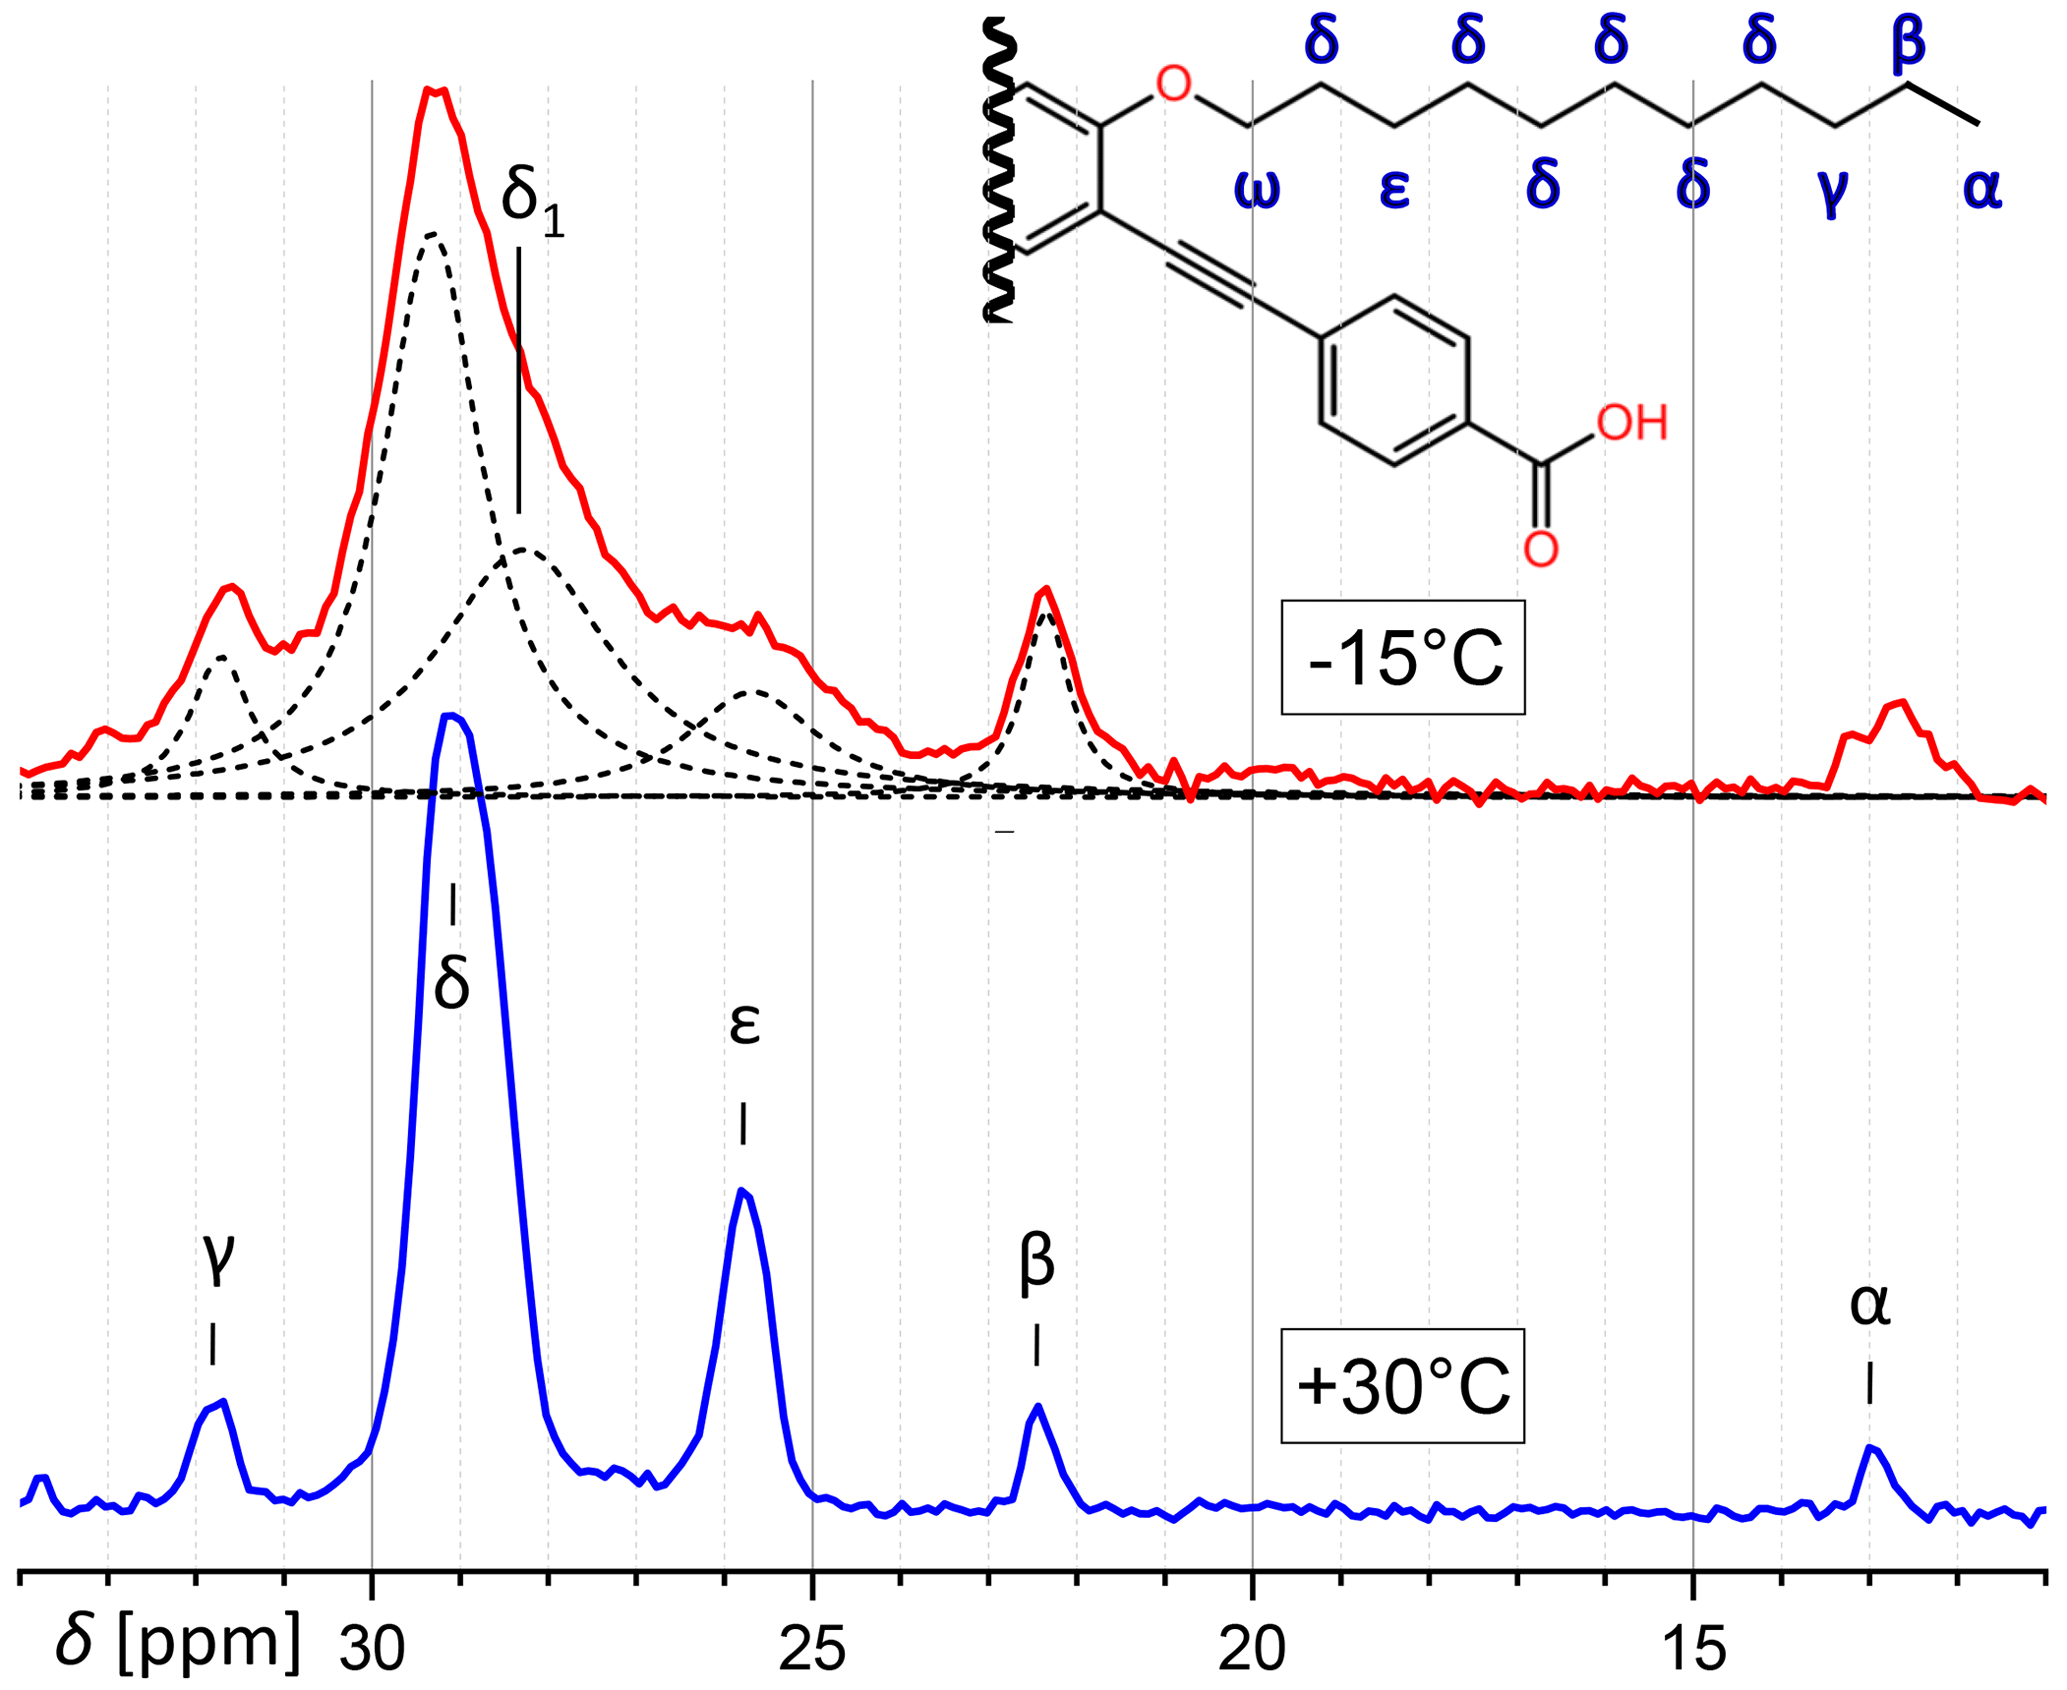
Figure 9Comparison of the aliphatic regions of 13C spectra of PIZOF-11 at different temperatures. While at 30 °C different positions are well separated from another, this is not the case at −15 °C. The decomposition into a number of Lorentzian lines is shown. One component of this decomposition (δ1) seems to have no counterpart at 30 °C. (ω-CH2 is at 69 ppm and is not visible here.)
In some contrast, the signal assignment for the aliphatic carbons (signal 2 in Fig. 5 and in Table 2) of PIZOF-10 is not fully clear. From a comparison with a prediction of isotropic chemical shifts obtained by the ACD software, we expect the resonances of carbons 2b, 2c, 2d, and 2e to be within a region of 0.7 ppm, carbon 2a to be shifted by about 1.2 ppm with respect to the centre of the former group of resonances, and carbon 2f to be shifted by about −0.6 ppm. (For the sub-numbering of the aliphatic carbons, see Fig. 10.) Taking into account that the solid-state resonances might deviate non-systematically from the solution-based shifts, we could attain a coarse assignment of the −15 °C lines to the following carbon positions: A to 2a; B to 2b, 2c, 2d, and 2e; and C to 2f. For the five components of the 25 °C spectrum, the assignment will however remain unknown at this stage. Typical solid-state NMR phenomena like conformational differences (e.g. trans or gauche) could generate additional shifts. A possible assignment will be given in the Discussion section.
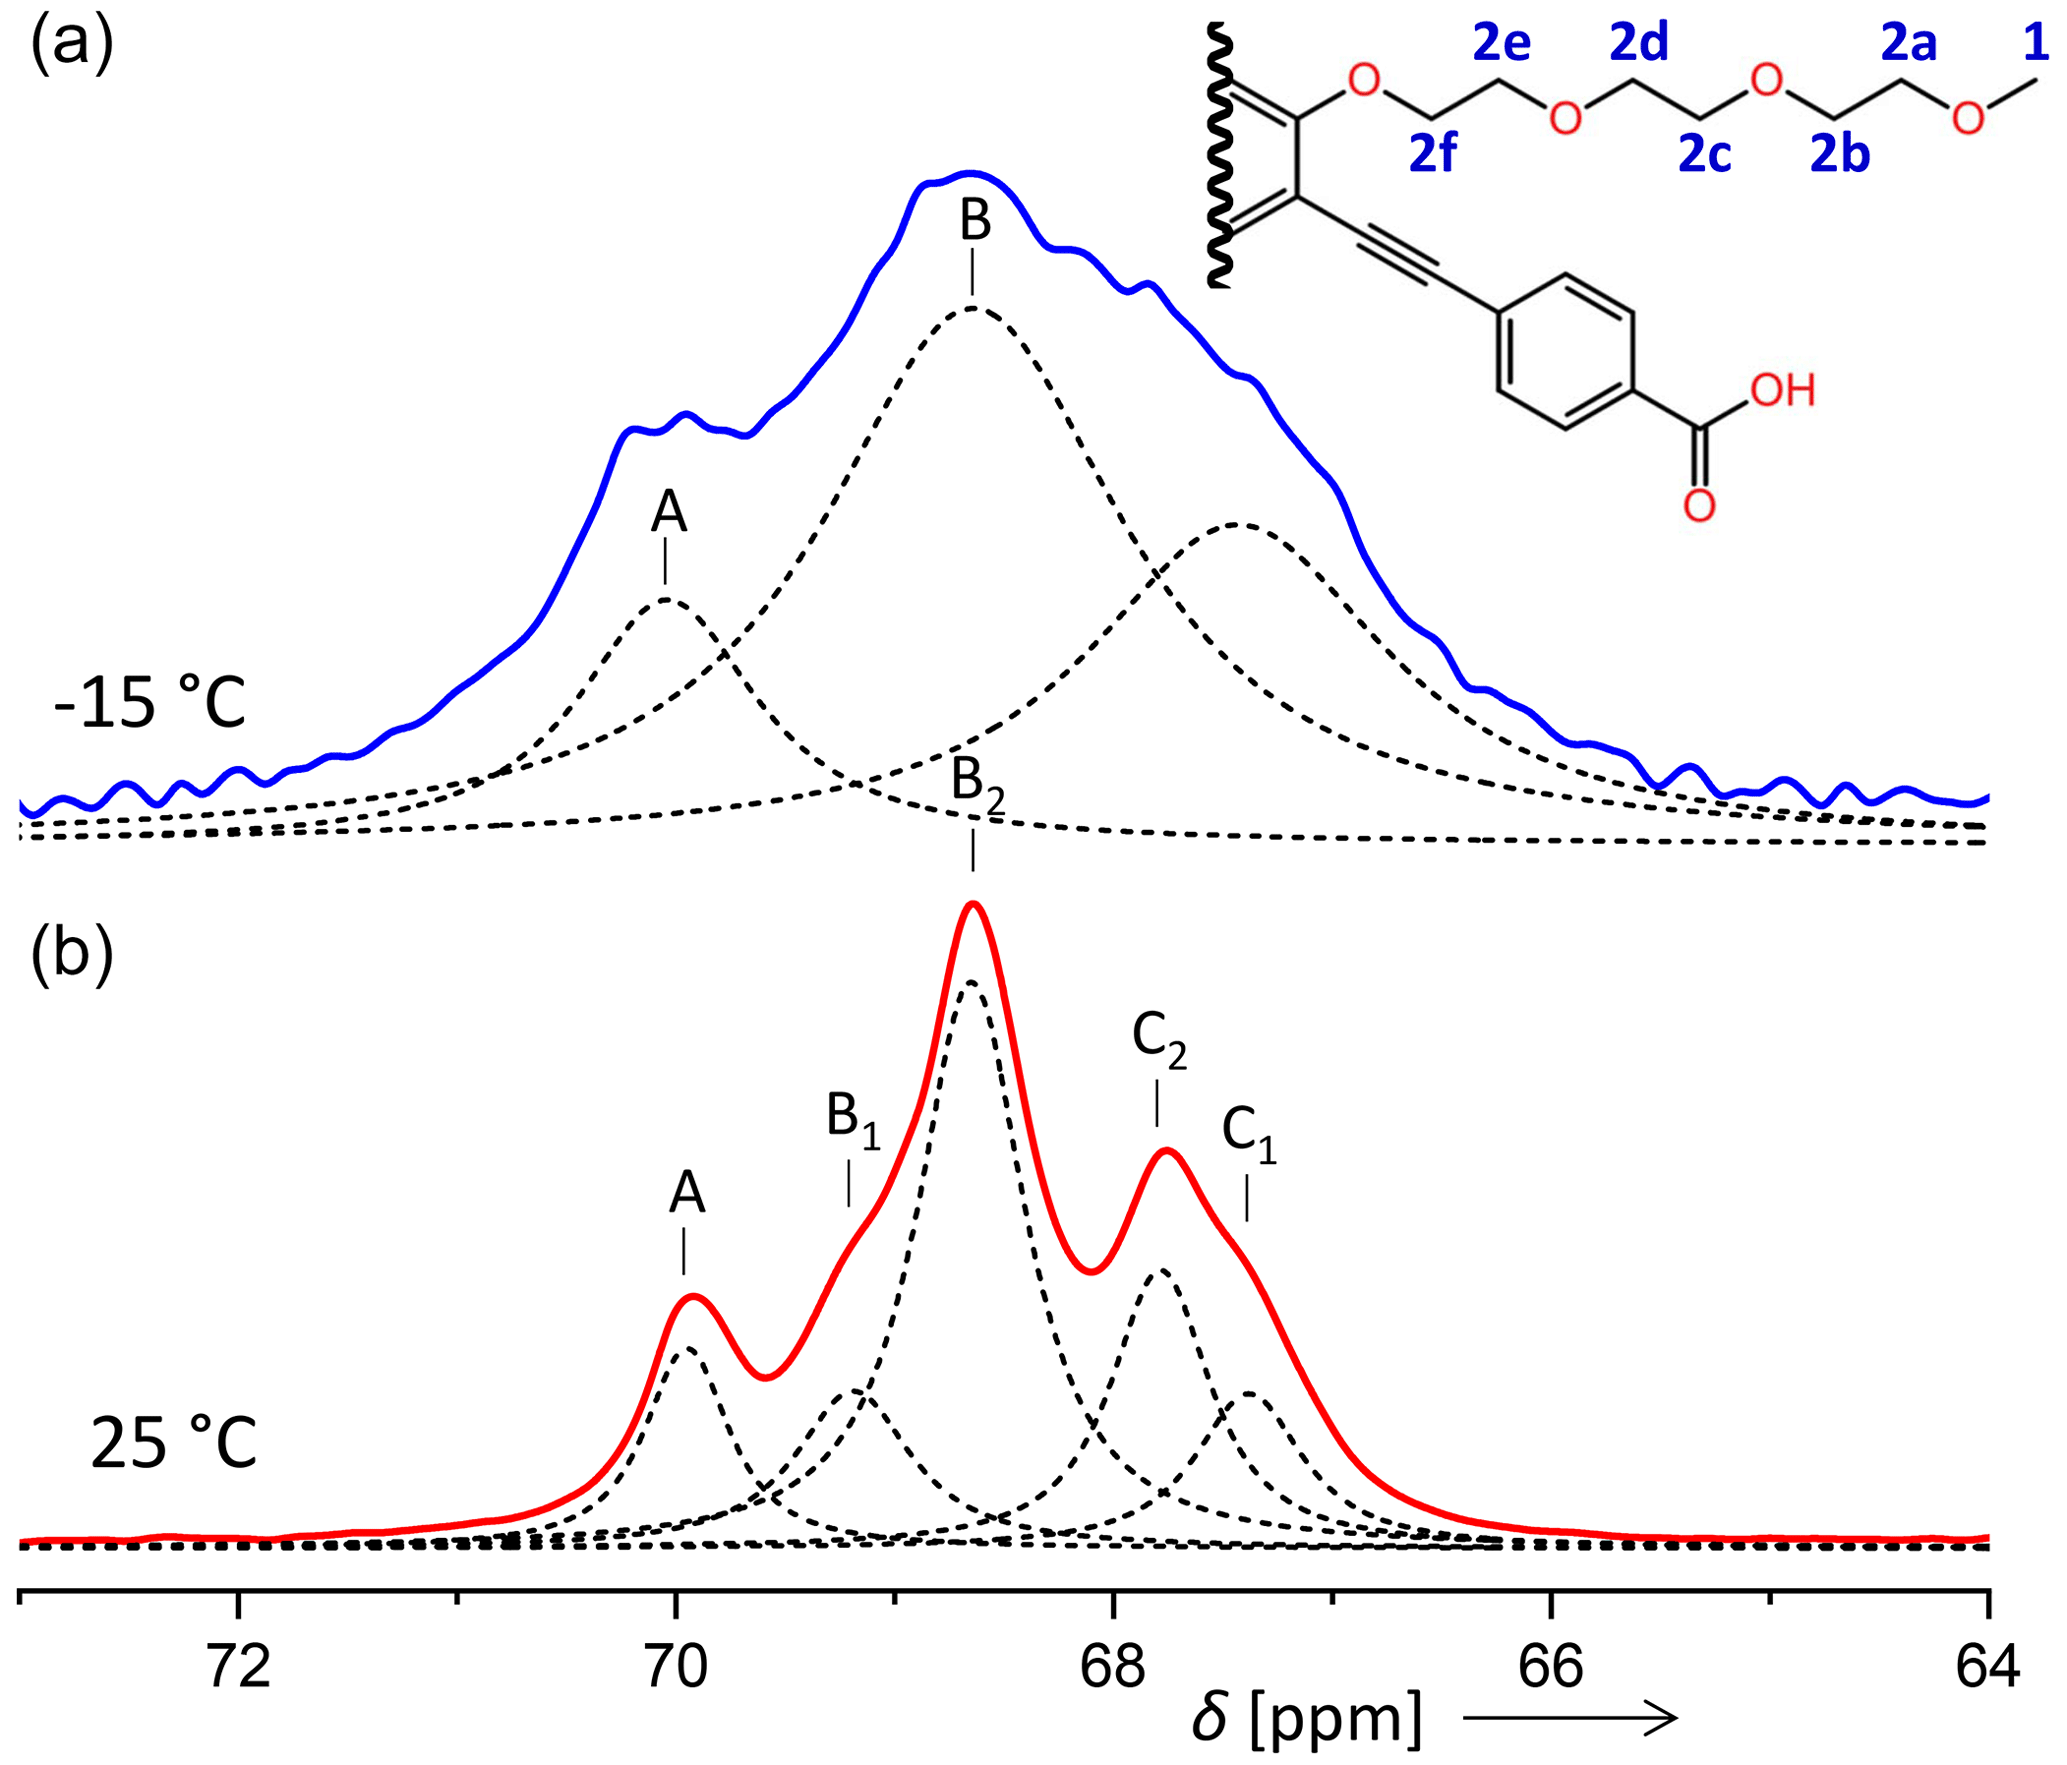
Figure 10Comparison of the aliphatic regions of 13C spectra of PIZOF-10 at different temperatures. While at 25 °C five components could be resolved (bottom), at −15 °C only three were detected (top). The numbering of the carbon positions serves discussions in the subsection “Line decompositions”.
The separation of the ring-CH resonances from overlapping quaternary C resonances is always straightforward. Further line-shape decompositions can be found in the Supplement.
4.4 Evaluation of the CP buildup curves
Comparisons of the signal intensities for PIZOF-10 and PIZOF-11 reveal similar CP efficiencies for most side-chain carbon signals to the other 13C signals of protonated carbons in the framework – except for the chain ends, where the CP efficiency significantly drops (Fig. 7).
In the CP experiments, several parameters influence the rate and efficiency of polarization transfer, in particular (i) the longitudinal relaxation time of the protons in the rotating frame T1ρ, (ii) the number of neighbouring protons and their distances from the 13C nuclei, and (iii) the mobility of the nuclei. To investigate the spin polarization transfer, CP buildup curves are measured (Mehring, 1983). 1H→13C CP MAS spectra are recorded with different contact times (here between 0.35 and 10 ms), and the intensities of the individual signals are plotted vs. the contact time. Protons directly bound to the carbon lead to fast and efficient CP buildup and hence to short buildup time constants TCH, whereas carbons without directly bound protons, e.g. larger distances to protons, show longer CP buildup times. Thermal motions result in a less efficient CP buildup and result in longer CP buildup times TCH (Schulze et al., 1990). CP buildup curves for PIZOF-10 are shown in the Supplement, and the time constants TCH obtained from this are shown in Fig. 8 and Table 3.
Table 3Buildup time constant TCH values obtained for the 13C signals in PIZOF-10 (for the corresponding buildup curves, see the Supplement).

The fastest CP buildups are observed for aromatic CH groups (5, 7) and CH2O groups (2). It is interesting to compare the CP buildup time constants for protonated carbon positions located at the framework (CH groups of the lateral rings 5 and 7) with the time constants for the CH2 groups of the side chains (2). If the rigidity of the framework and the side chains were identical, the TCH of CH2 would be shorter than for CH. In our experiments, the values for TCH of CH2 and CH are similar. This indicates that the side chains (2) are slightly more flexible than the framework (5, 7) but are still relatively rigid. Because the signals of the different side-chain positions are not resolved (2), the time constant cannot be determined for the different CH2 groups. The DIPSHIFT measurements however allow further interpretations. Theoretically, an immobile CH3 group should have the shortest time TCH compared to all the other carbons in PIZOF-10. The terminal CH3 at the end of the side chains (1), however, exhibits a rather long TCH value. This is likely due to the combined influence of methyl group rotations and the increased mobility of the chain end. It can, therefore, be concluded that the side chains are far from showing a liquid-like behaviour. Obviously, they are relatively ordered and fixed in space due to interactions between themselves and/or the framework. This is in agreement with previous 13C CP MAS NMR studies, e.g. of n-alkyl silanes bound to silica surfaces (Sindorf and Maciel, 1983) showing that (i) significant CP transfer occurs for all carbon atoms and (ii) the CP efficiency decreases with increasing distance from the surface, i.e. from the anchoring point of the chain.
4.5 Evaluation of the DIPSHIFT curves
DIPSHIFT data and model functions with fitted parameters Dres and r of the methyl carbon in PIZOF-2 are shown in Fig. 11. DIPSHIFT curves and mean-square deviation surfaces for the other carbon positions which were evaluated can be found in the Supplement.

Figure 11DIPSHIFT curves of OCH3 of PIZOF-2 at −15 °C for different spinning frequencies. The solid lines show model function 4 with values for the parameters Dres and rc which give the best fit to the experimental data for both spinning rates.
Numerical values for Dres and r are summarized in Tables 4–6 for the respective samples. The last columns all contain the order parameters . C–H distances are between 1.09 and 1.10 Å, which gives a coupling constant reduced by the Lee–Goldburg scaling factor kHz. The resulting uncertainty of about 1.4 % is smaller than the experimental uncertainties and therefore influences the uncertainty of the order parameter only weakly.
Table 4Residual dipolar couplings, damping constants, minimum mean-square deviations, and order parameters for methyl carbons and for protonated side-ring carbons in PIZOF-2. For the ring CH, two different fit models were applied: see the text.
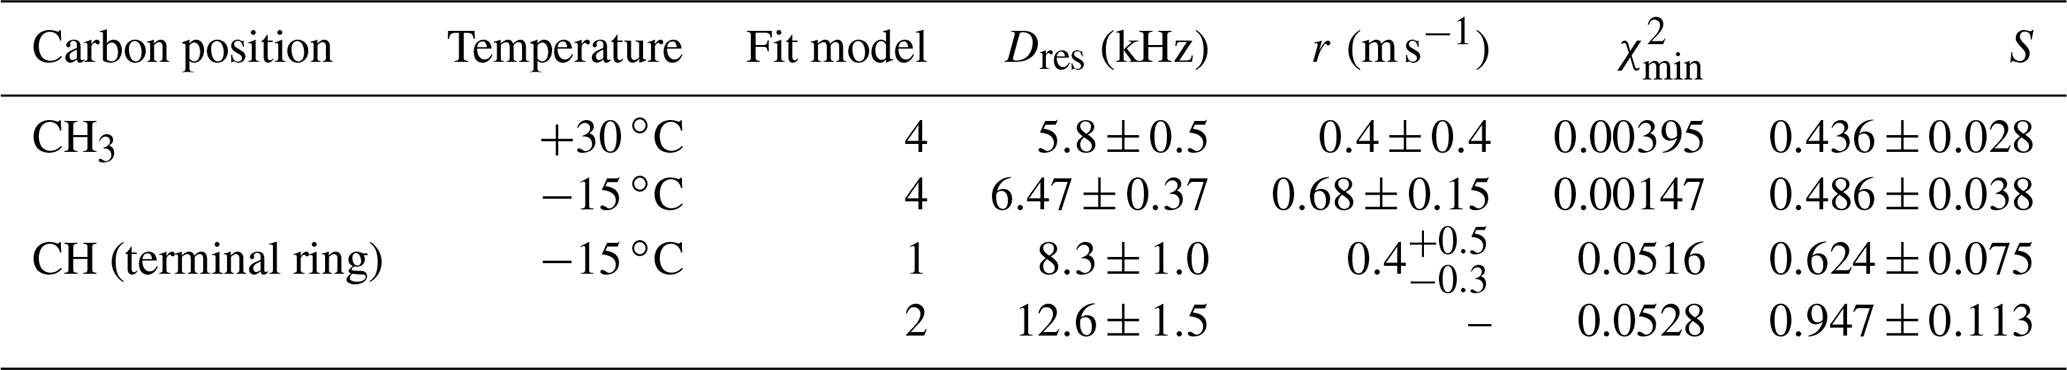
Table 5Residual dipolar couplings, damping constants, minimum mean-square deviations, and order parameters for some carbon positions and for components of methylene resonances in PIZOF-10. Again, for the ring CH, two different fit models were applied: see the text.
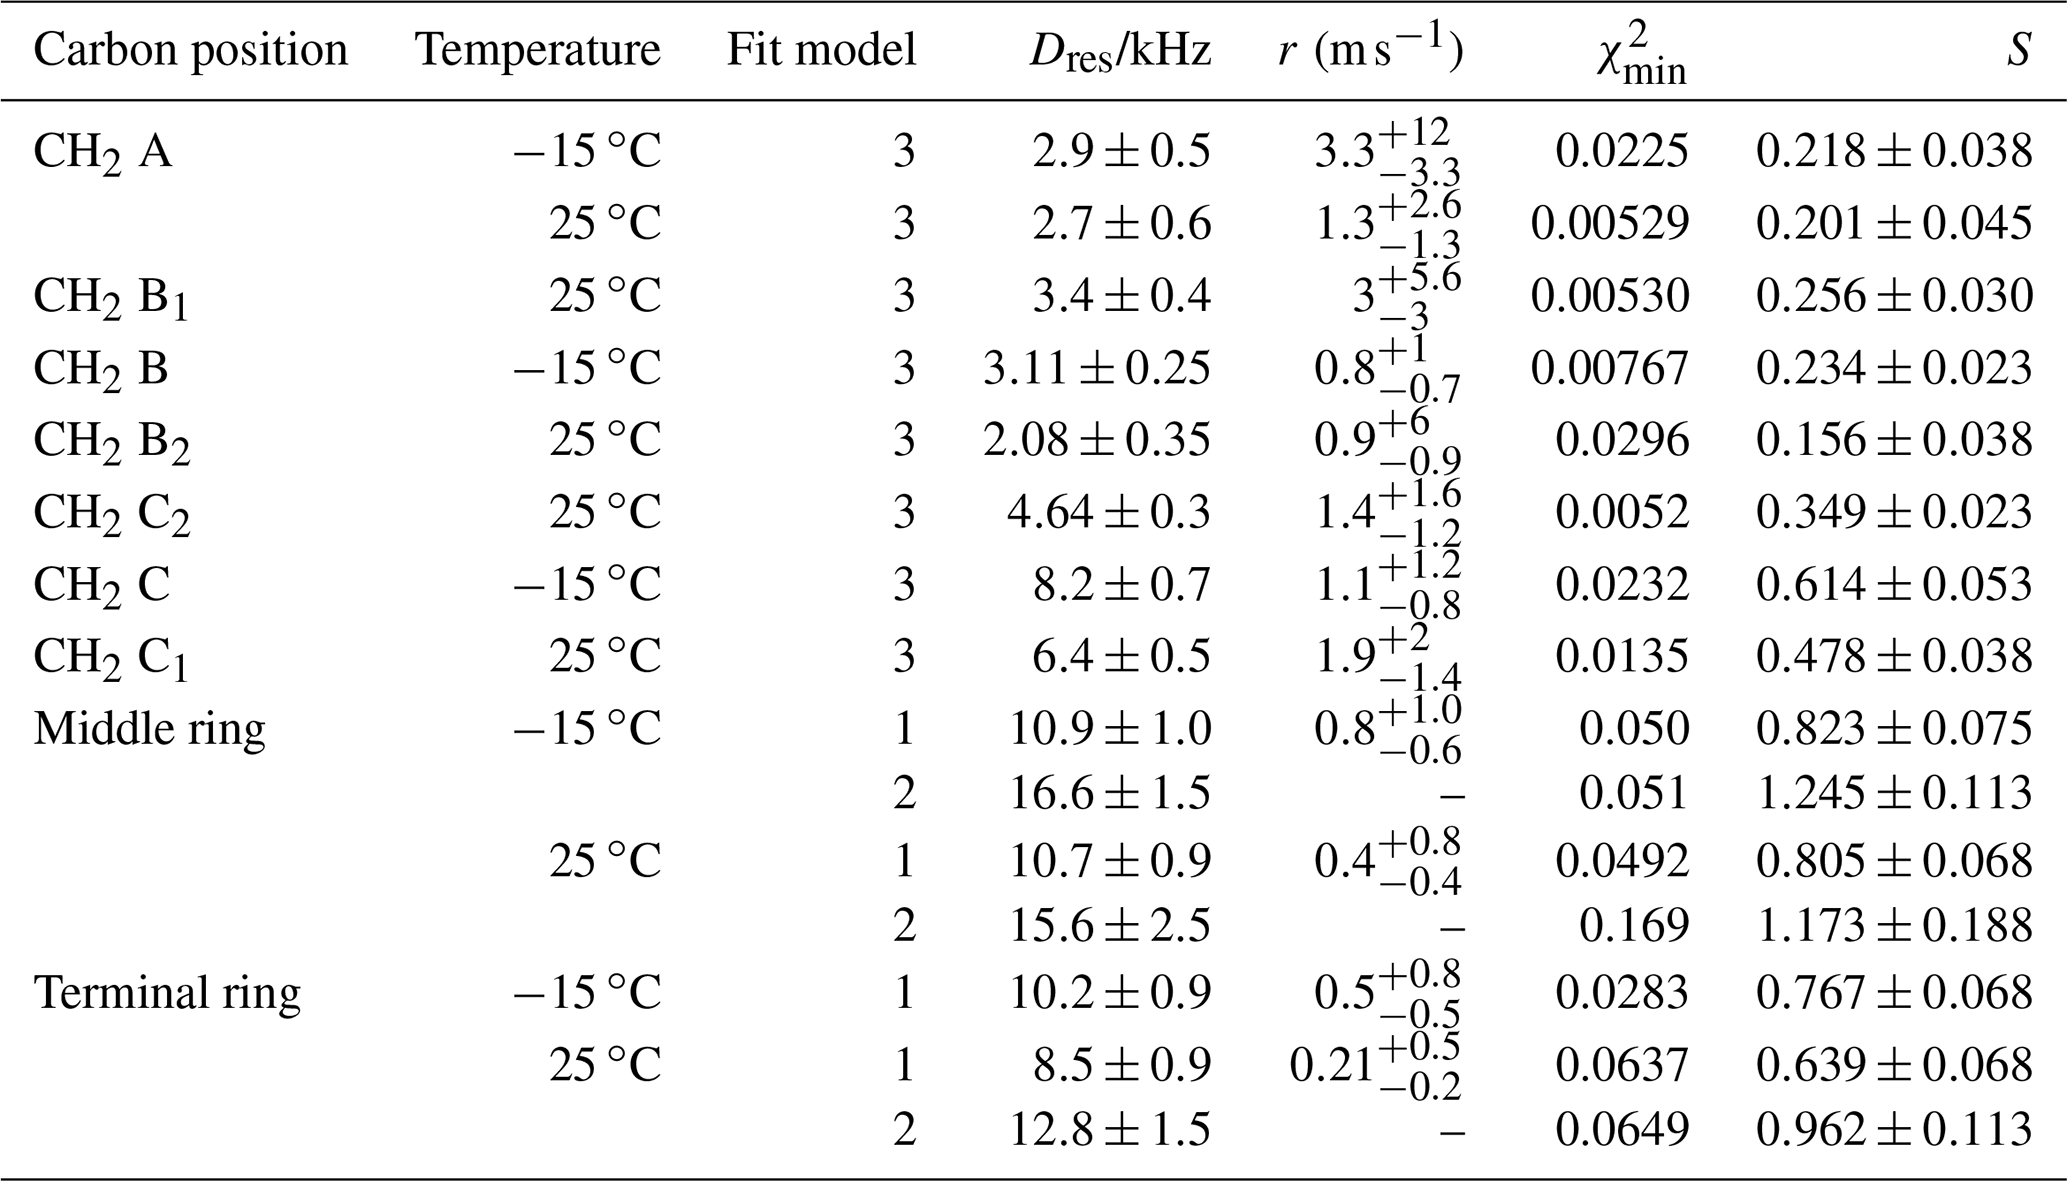
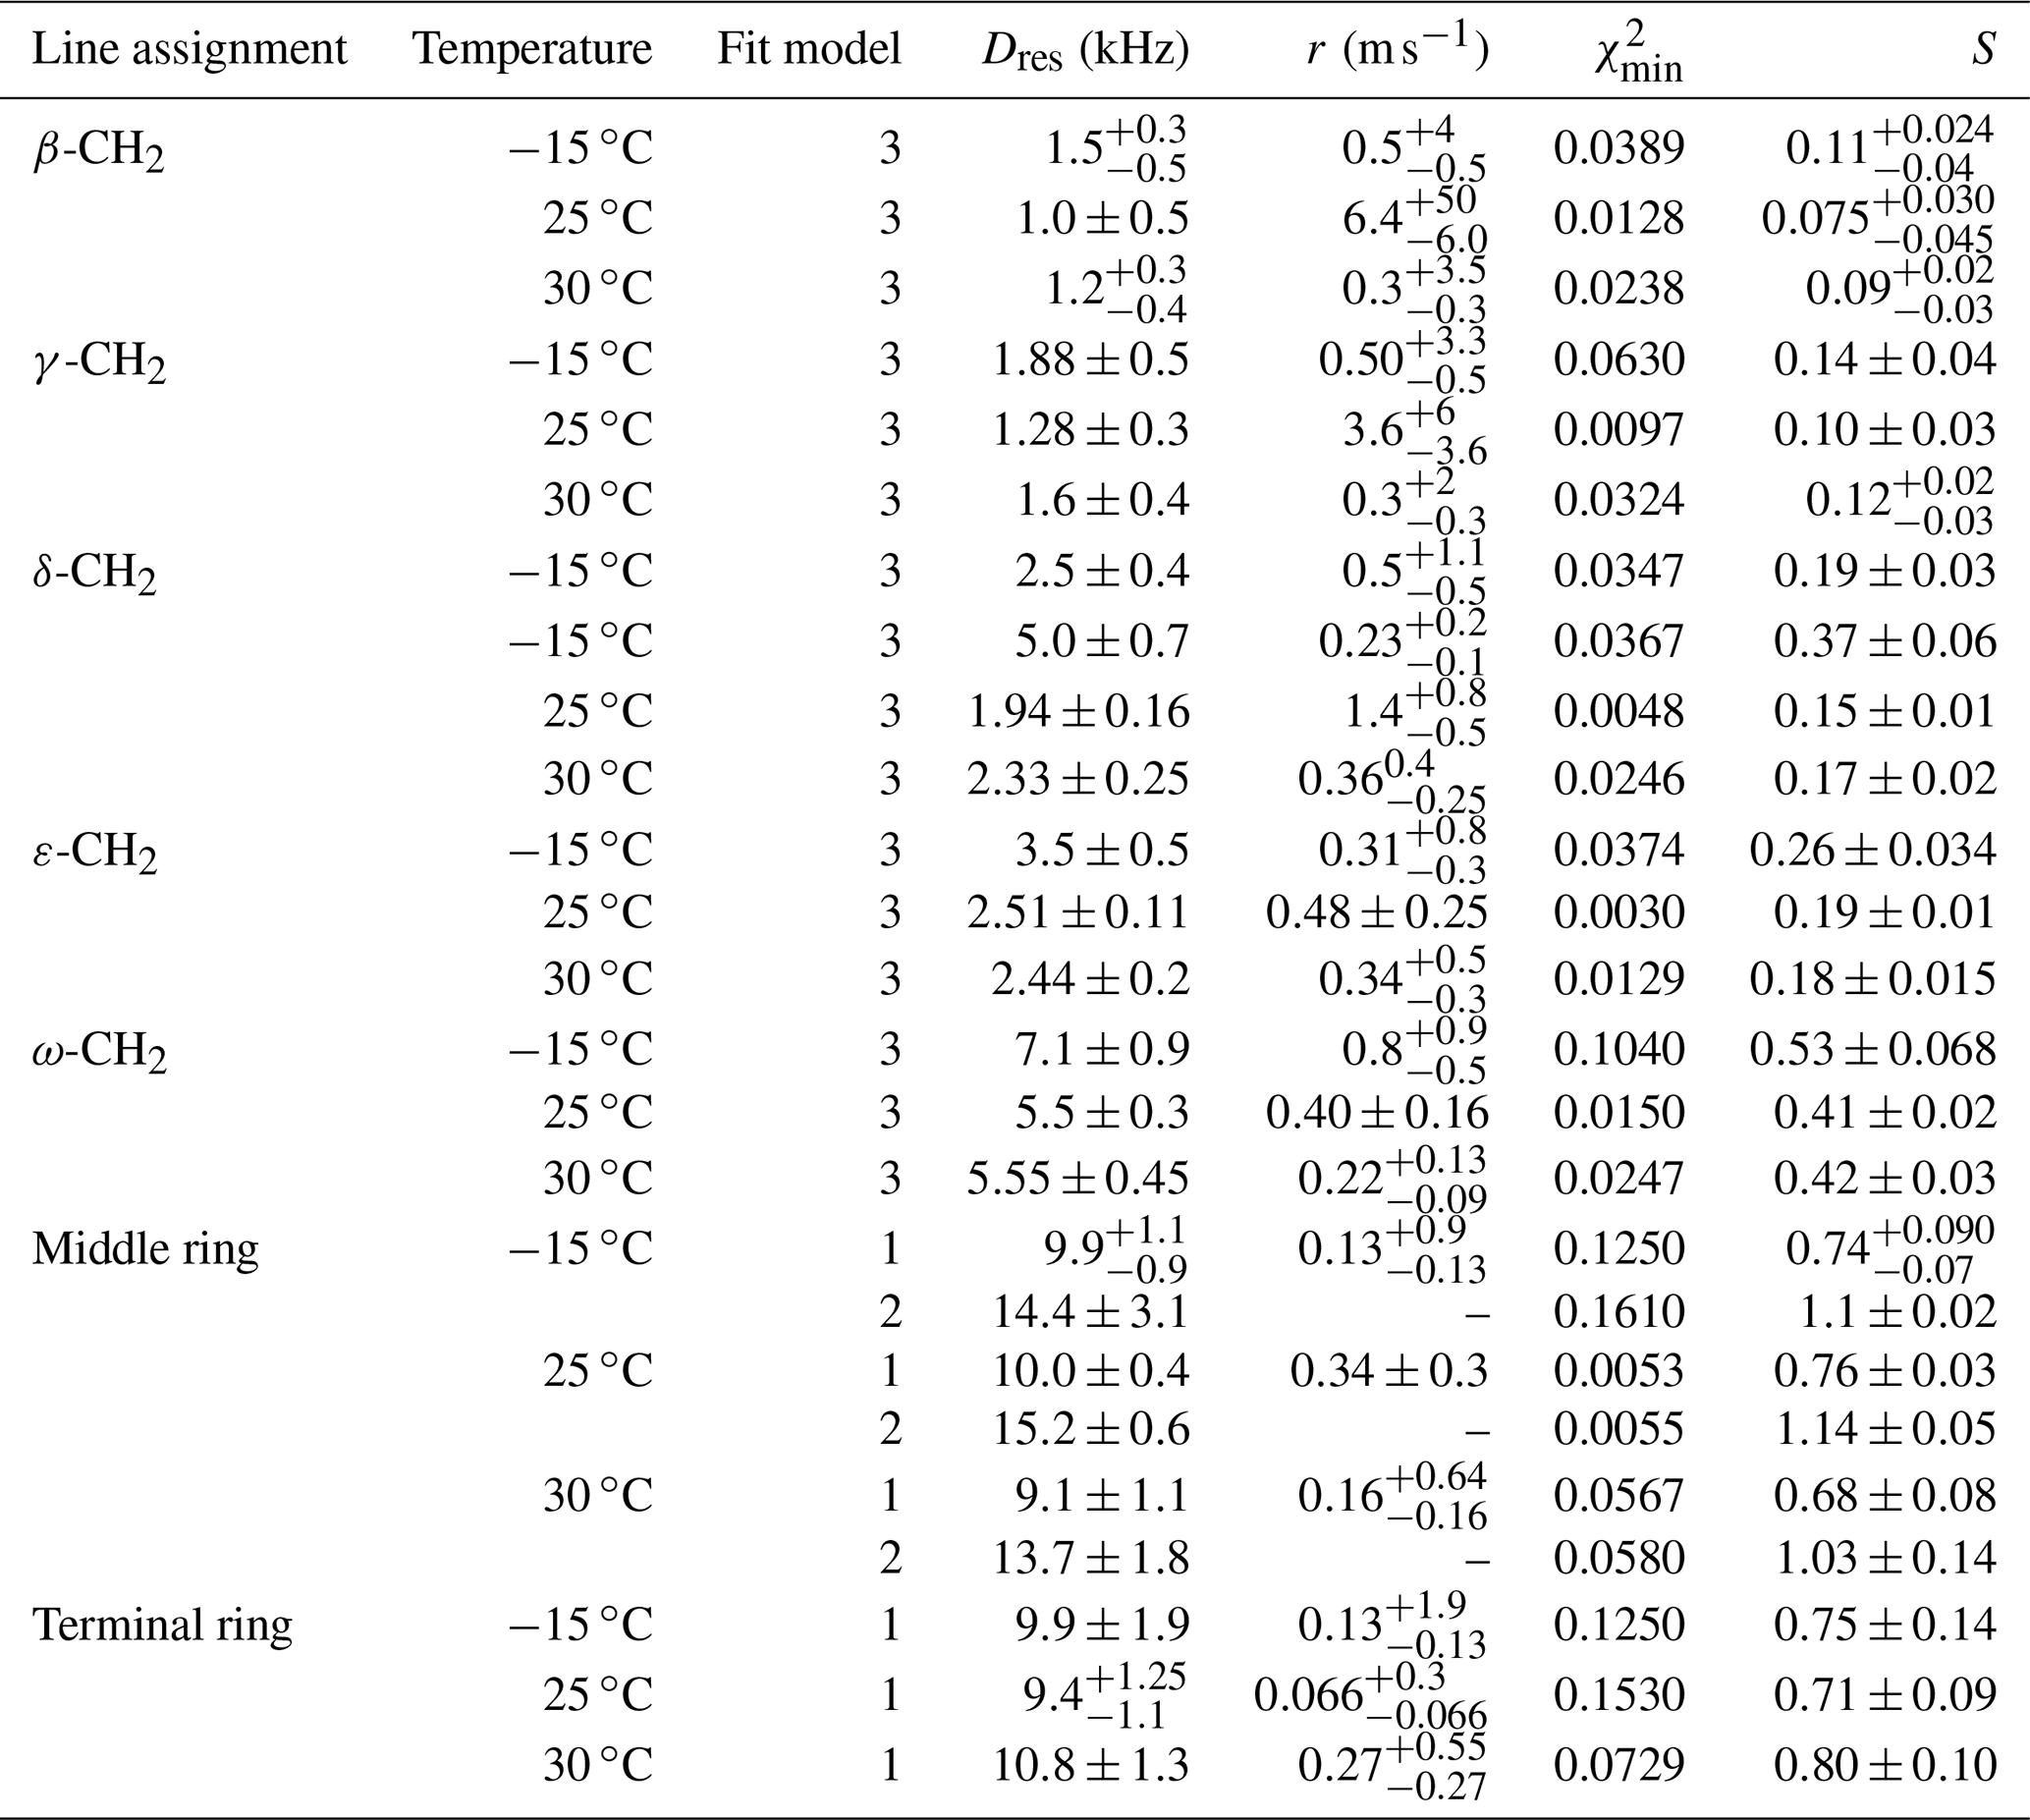
Table 6Residual dipolar couplings, damping constants, minimum mean-square deviations, and order parameters for some carbon positions in PIZOF-11. Again, for the ring CH, two different fit models were applied: see the text.
The accuracy of the order parameter values can also be affected by the inhomogeneity of the RF field. The latter leads to an inhomogeneity of the Lee–Goldburg scaling factor (LG factor; Lee and Goldburg, 1965), which is important for determining the order parameter. However, it was possible to estimate that the resulting measurement uncertainty is less than 1 %. For this estimation, data from Wurl et al. (2023) were used (see the Supplement).
The evolution of the 13C magnetization during a 1H-13C cross-polarization experiment is characterized for short times () by powder-averaged oscillations determined by the (residual) dipolar coupling. For longer times, however, spin diffusion within the proton system will be more and more important; it provides a re-polarization of those protons which are close to 13C and have been depolarized during CP. Both phenomena are expected to be slowed down by thermal motion.
The TCH values corresponding to the long-time buildup indicate an increased mobility towards the end of the side chains. With regards to the related thermal motion, we can distinguish two cases: (i) slow or intermediate nearly isotropic motion, which would cause a loss of CP efficiency upon speeding up, and (ii) fast anisotropic motion, which does not hamper CP buildup even in the fast limit because of the residual dipolar coupling. The latter enables both oscillatory behaviour in the CH systems at short times and spin diffusion in the proton system at long times. The DIPSHIFT results provide a distinction between these two options. The first case would lead to strongly damped rotational echoes in the FID; see above. A re-increase in the second half of the DIPSHIFT curve would not occur. The DIPSHIFT signals obtained for the PIZOF samples, however, show a clear recovery of the rotational echo, almost reaching the initial FID intensity.
In most of the cases investigated here, the residual dipolar couplings are essentially smaller than the value which would occur for immobile structural groups. Consequently, thermal motion that effectively averages the dipolar interactions must be present. This motion must be much faster than the strength of carbon–proton dipolar coupling. In other words, the correlation times must be shorter than 10−5 s (in the intermediate region in a range s, the motion would lead to a strong damping of the rotational echoes). The rotational echo after one rotation period is slightly damped but in no case to less than 70 % of the initial signal. This means that fast motion reduces the apparent dipolar coupling and the existence of a rather slow motion with correlation times of s causing the observed weak damping of the rotational echoes for room temperature as well as for −15 °C. This slow motion leads to further averaging of the dipolar interaction but just at times which are much longer than the duration of the DIPSHIFT modulation period.
The side-chain order parameter could be estimated for different positions on the basis of our line decomposition, remembering that only for PIZOF-11 at 25 °C are the aliphatic lines well resolved. Besides the δ1 component occurring at −15 °C only (see Fig. 9), all the low-temperature components of the deconvolution could be assigned to the well-separated room temperature lines and therefore also to carbon positions. A gradient of the order parameter along the chain could be detected: see Fig. 12. On this basis, we can give a possible explanation for the occurrence of the δ1 component. The value of its order parameter, which is placed between the S values of ε carbons and ω carbons, implies an assignment to the carbon being placed next to the ω carbon. At room temperature, its resonance is part of the signal group of the δ carbons. Perhaps because of conformational effects, it is shifted towards higher parts-per-million values at −15 °C.
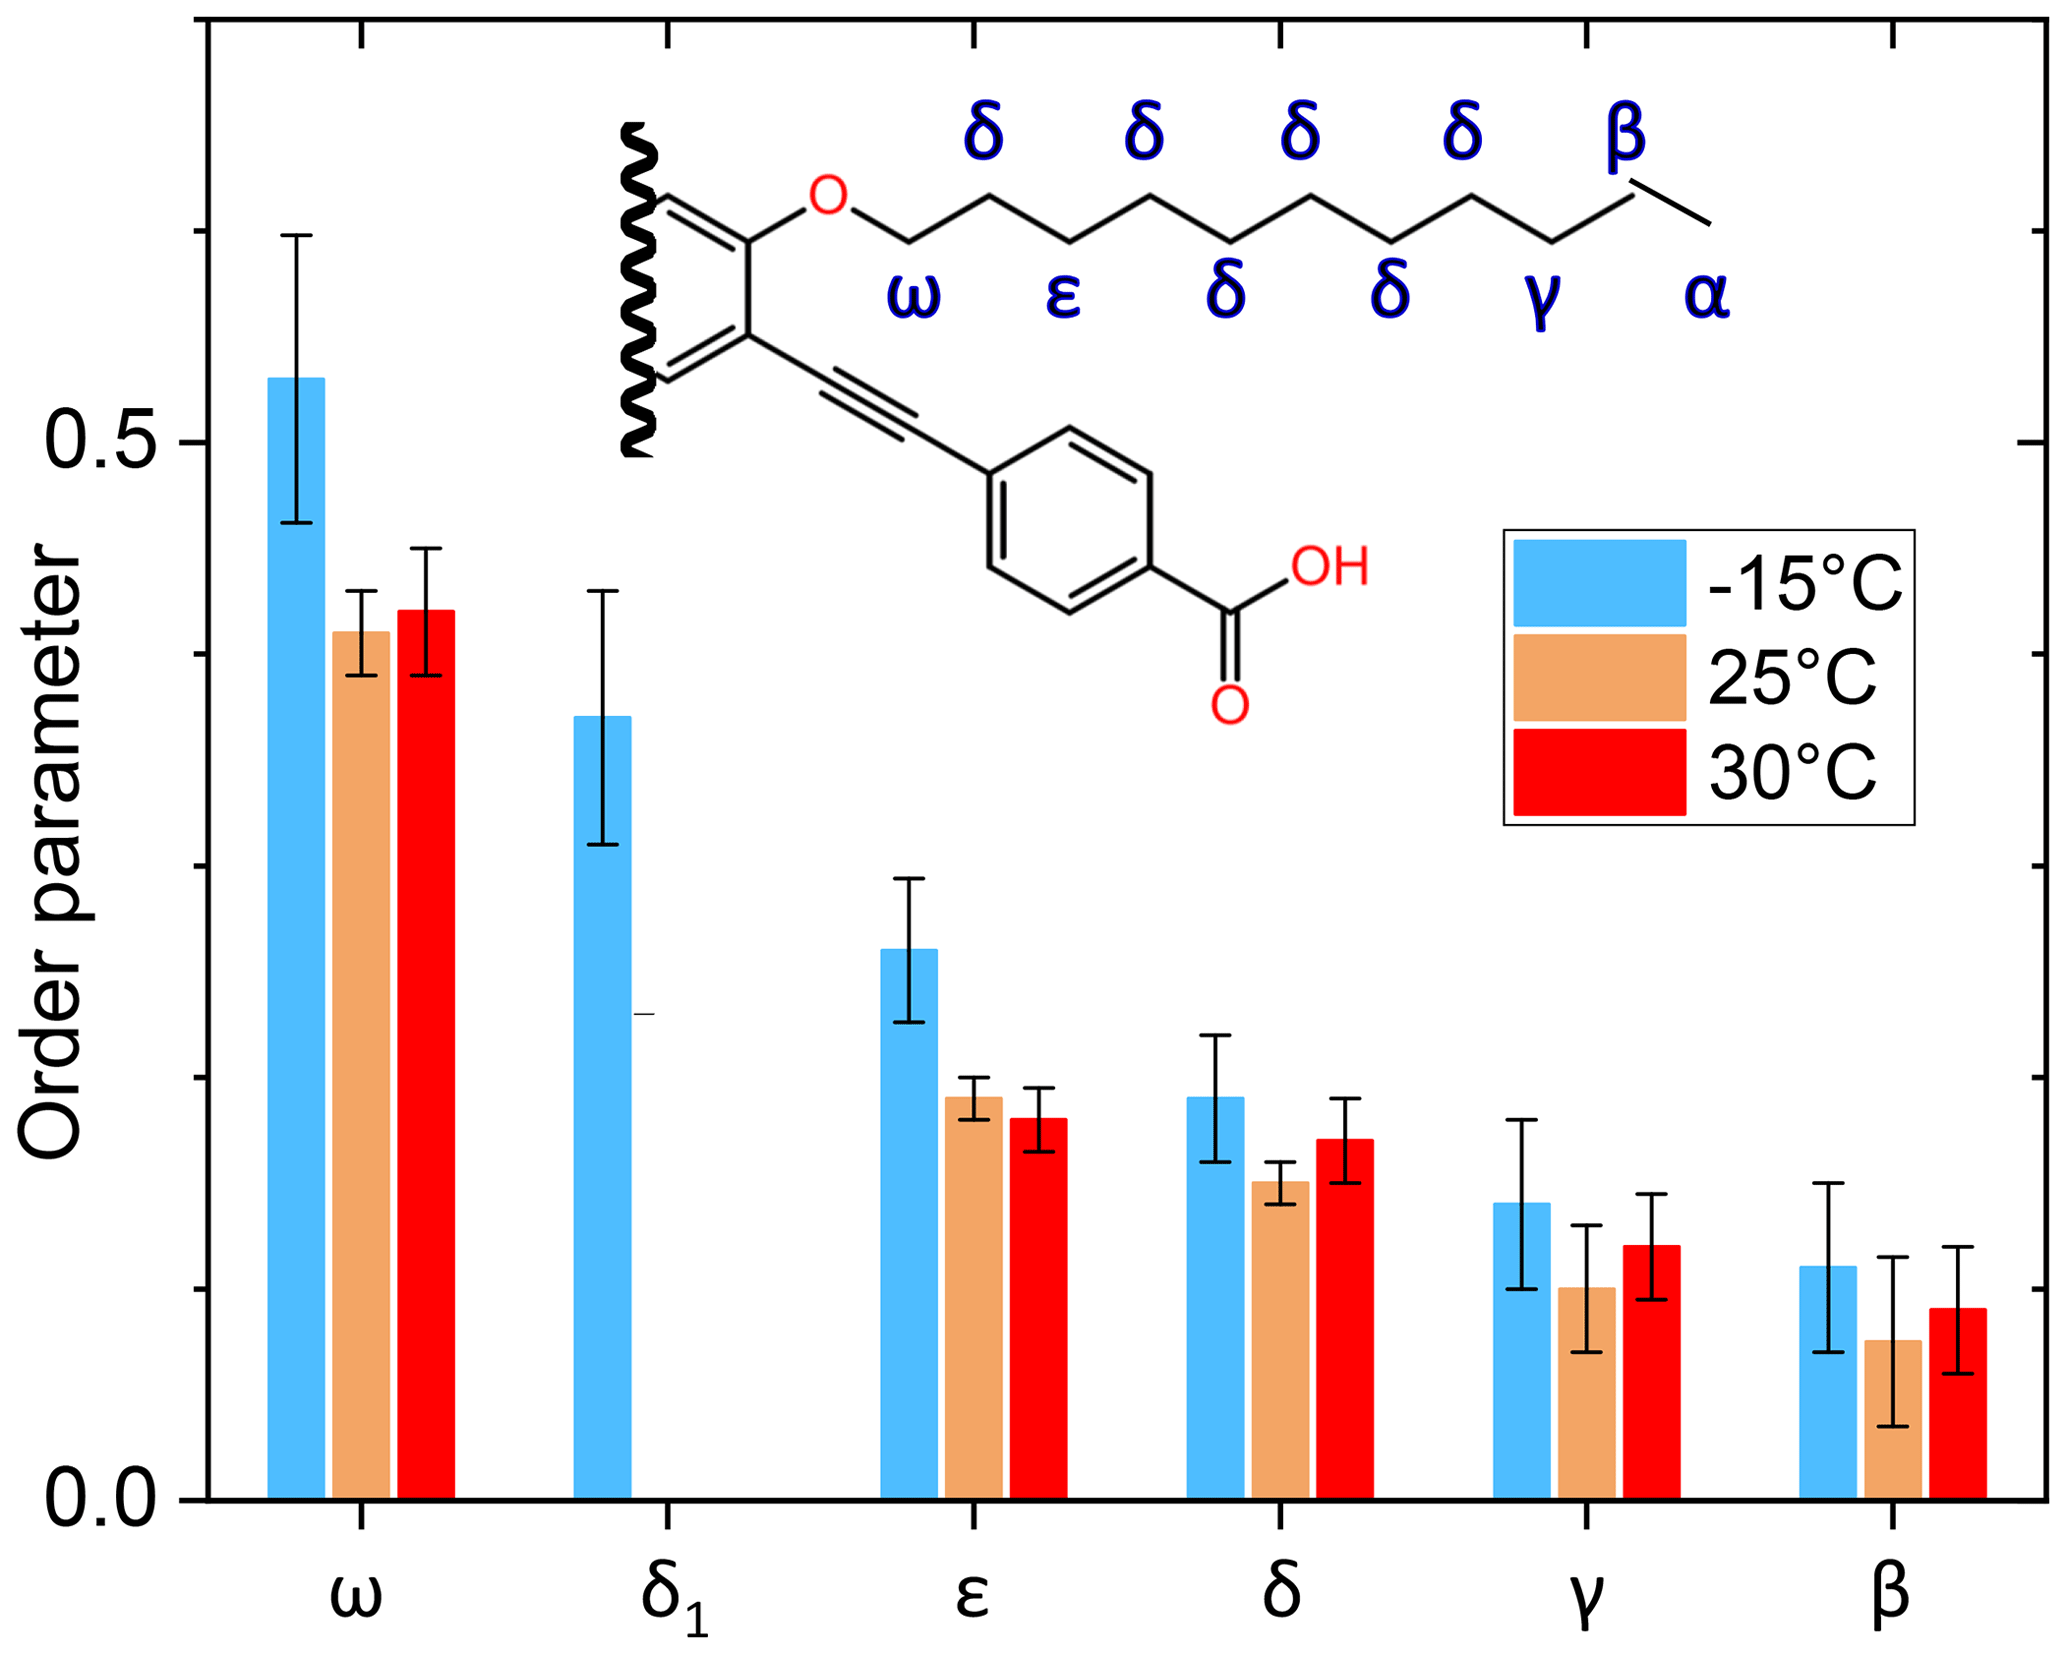
Figure 12Graphical representation of the order parameter gradient along the side chains of PIZOF-11. The label “δ1” marks the position in the chain where the origin of this line is assumed; see the text.
The order parameters of the side chains in PIZOF-10 are shown in Fig. 13. Following the liquid-state assignment (see “Line decompositions”), component A was assigned to position 2a and component C was assigned to position 2f. The order parameter of the carbon at position 2f is clearly larger than that of the remaining part of the side chain. This phenomenon also occurring in PIZOF-11 can be understood by the proximity of these carbons to the more rigid central rings: see below. The value of the order parameter of component C2 strongly suggests an assignment of this component to position 2e. The order parameter of component B1 exceeds that of B2 only weakly but is beyond the limits of uncertainty. Hence, an assignment of this component to carbon position 2d is likely to some degree.
A comparison of the different side-chain groups linked via O to the central rings shows that the order parameters of PIZOF-10 and PIZOF-11 are equal within experimental uncertainty. However, in PIZOF-2 at −15 °C, the bond-order parameter of the methyl group is clearly smaller than that of the ω-CH2 of both other PIZOFs, remembering that we have considered the fast rotation around the methyl symmetry axis in the fit. This indicates that there is a fast motion of the methyl axis itself which takes place in a range of angles which is of a larger amplitude than in the case of the ω methylenes in PIZOF-10 and PIZOF-11.
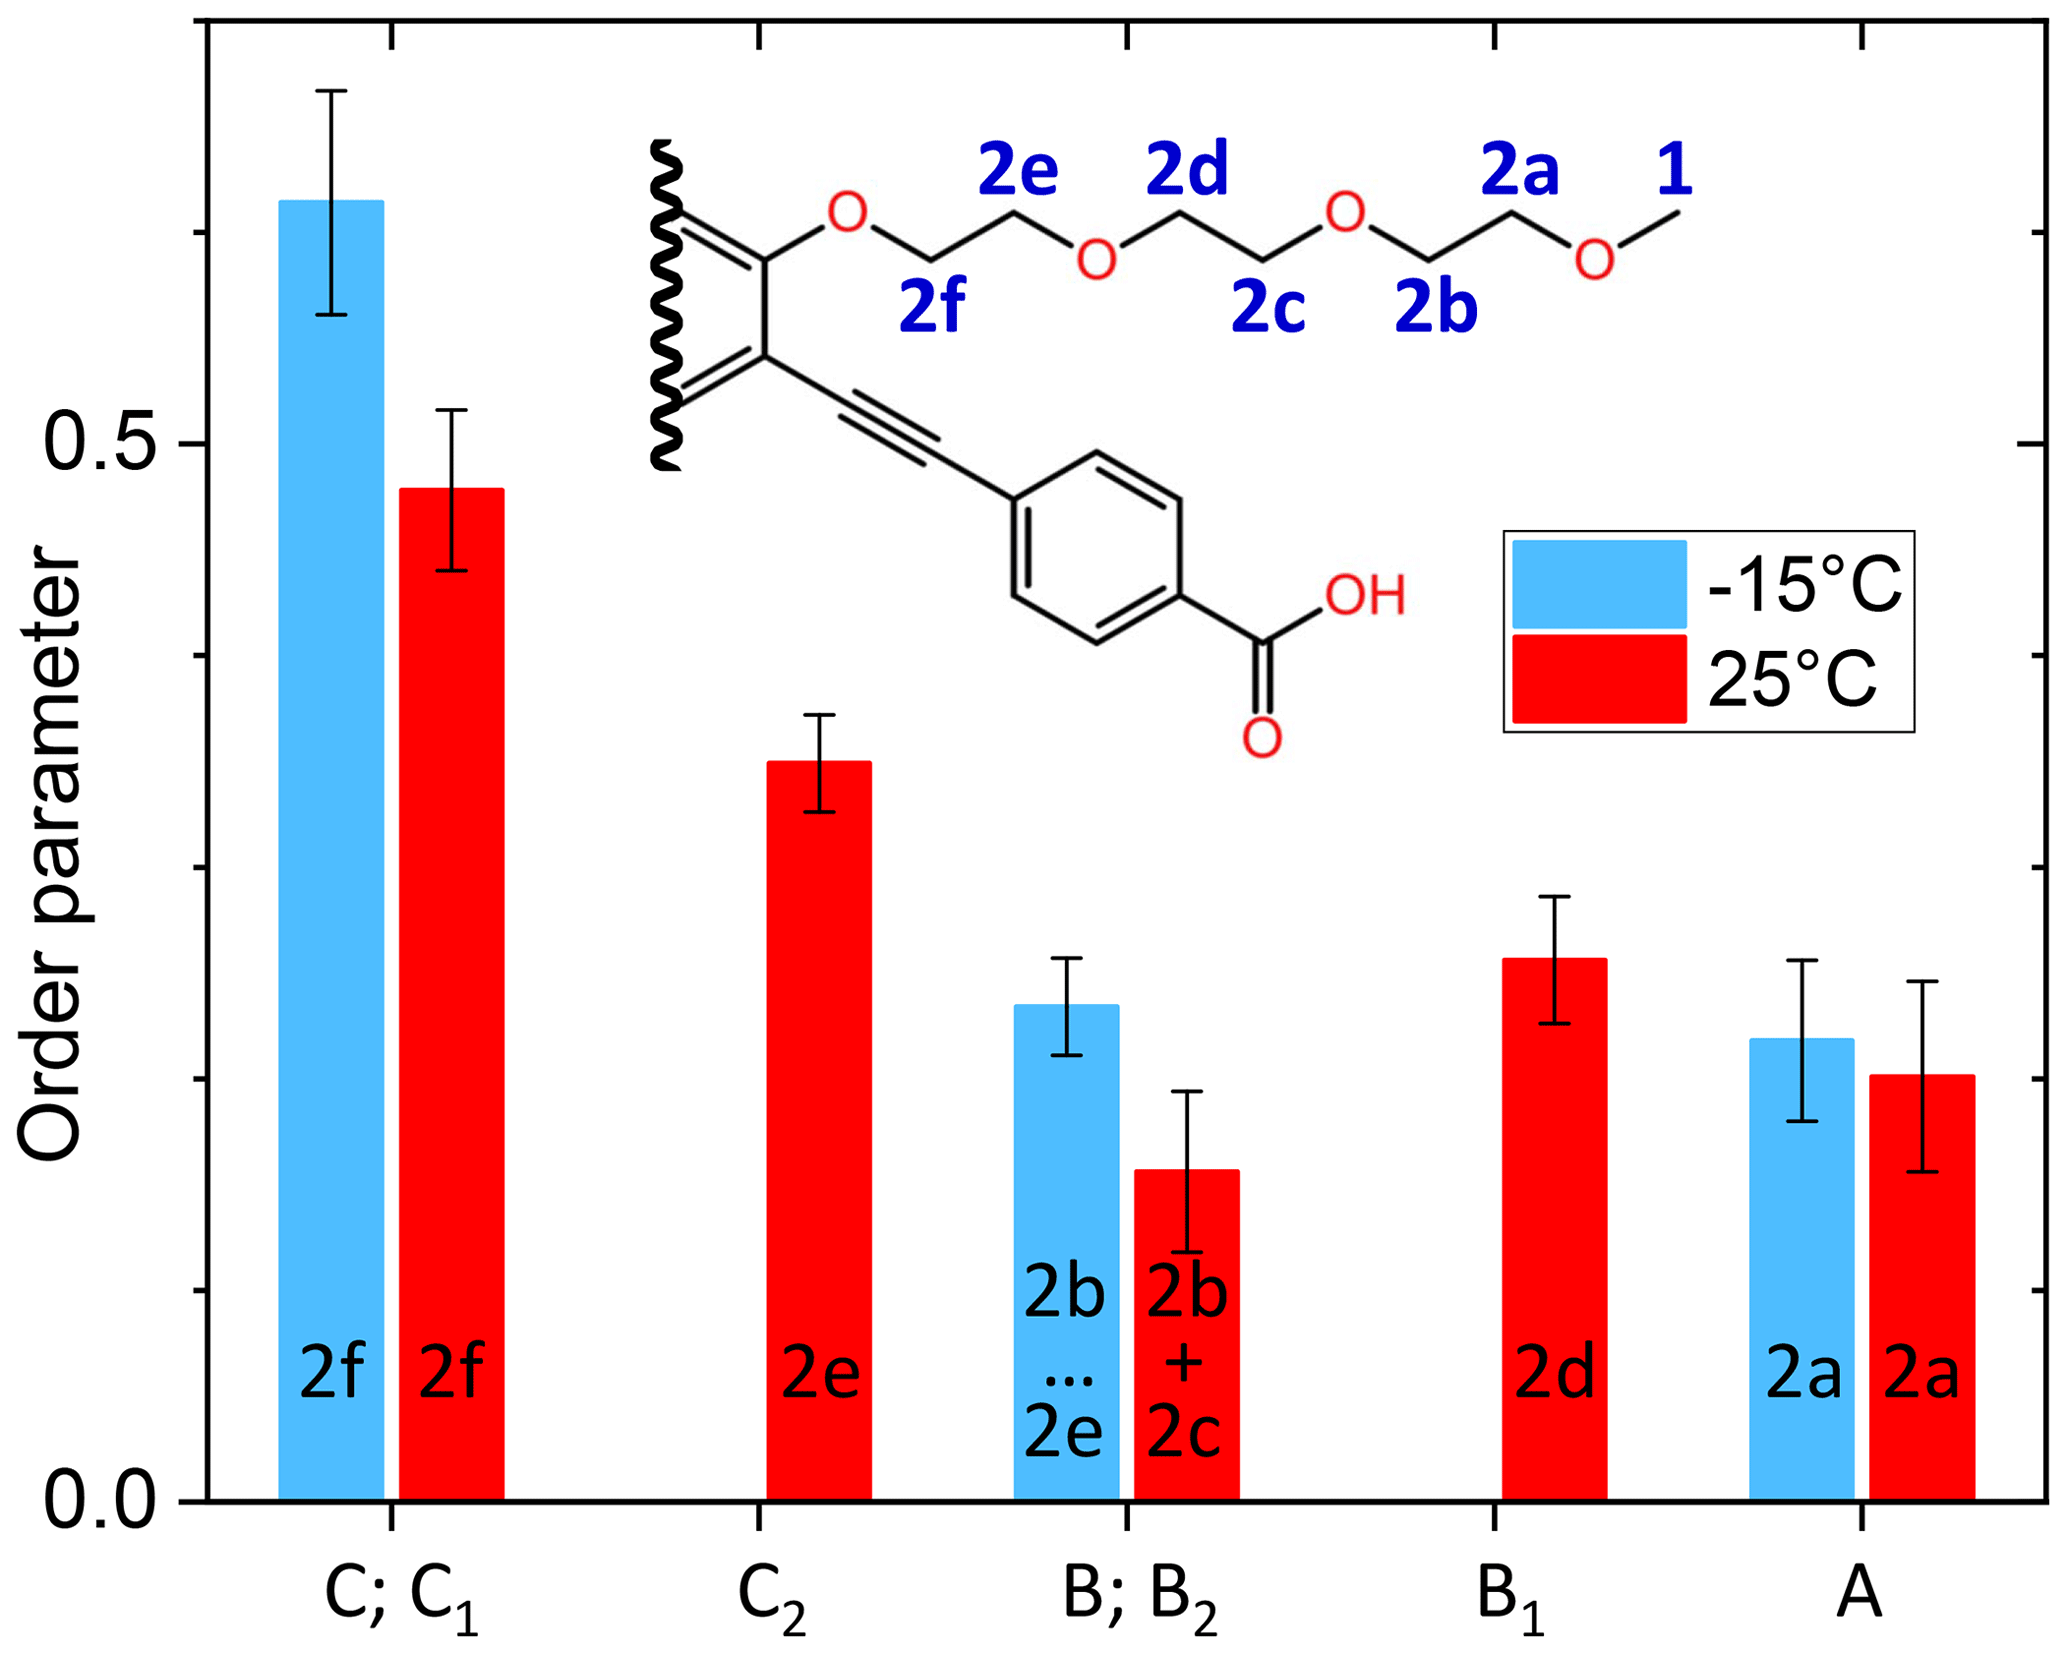
Figure 13Graphical representation of the order parameters for the different components of the methylene line in PIZOF-10.
The order parameters of the central rings are graphically compared in Fig. 14. The PIZOF-2 spectrum did not allow for a separation of the corresponding line from a completely overlapped group of signals. Hence, we now only deal with the two other samples. For PIZOF-10, similar order parameters (0.74 and 0.68 for −15 and 30 °C, respectively) to PIZOF-11 (0.82 and 0.80 for the same temperatures) were determined. We observe that the first ones are slightly smaller but are not beyond the limits of experimental uncertainty. The 180° flips of the rings are not expected because of the linked side chains. Indeed, an attempt to evaluate the DIPSHIFT curves by model function 2 (for 120° jumps of the CH bonds) failed; it delivered unrealistically high values for the residual dipolar coupling.

Figure 14Graphical representation of the order parameters for the protonated carbons in the middle rings (a) and terminal rings (b).
With regards to the terminal rings, flips could also not be detected; the fit attempt led to Dres values which would be larger than those expected for rigid molecular parts. Evidence of such rapid motion would only be given if Dres<DLG had been found to be outside the error limits. This also concerns slow flips, as this would lead to a larger T2 damping of the rotational echo. An order parameter <1 thus has to be explained by fast small-angle motions. For the central ring, π flips have a very small likelihood because of the attached side chains.
Long aliphatic and ethyleneglycol side chains of the PIZOF samples were shown to exhibit a gradient of anisotropy of motion. Not only the terminal methyl groups, but also the methylene groups close to the CH3 are subject to fewer restrictions than the inner CH2 groups. The carbons closest to the linker backbone are subject to the strongest motional restrictions.
“Restriction” in our sense does not concern the speed of motion but the degree of anisotropy. Assuming that this anisotropic motion would proceed as fluctuations of the CH2 plane normals or CH3 rotation axes within a cone with a defined opening angle, this angle would be larger the smaller the order parameter is. This is reminiscent of the dynamics in nematic liquid crystals; overall, we observe orientational restrictions to different degrees despite rather short correlation times. The difference in liquid crystals is found in the existence of the long-range order of the chains of the latter.
6.1 Cos-Fourier coefficients
6.1.1 Case 1: ensemble of rigid IS spin pairs
6.1.3 Case 3: spin triples IS2
6.1.4 Case 4: spin quartets IS3
The data sets generated and analyzed for this study as they appear in the figures of this article can be found in the Zenodo repository: https://doi.org/10.5281/zenodo.10156265 (Hempel et al., 2023).
The supplement related to this article is available online at https://doi.org/10.5194/mr-5-1-2024-supplement.
GH conducted theoretical considerations and data analysis, RK carried out the DIPSHIFT experiments and was involved in data analysis, SP performed the CPMAS and HETCOR experiments, and KS and EB supervised the research and discussed the results. All the authors contributed to the paper writing and approved the final manuscript version.
At least one of the (co-)authors is a member of the editorial board of Magnetic Resonance. The peer-review process was guided by an independent editor, and the authors also have no other competing interests to declare.
Publisher's note: Copernicus Publications remains neutral with regard to jurisdictional claims made in the text, published maps, institutional affiliations, or any other geographical representation in this paper. While Copernicus Publications makes every effort to include appropriate place names, the final responsibility lies with the authors.
We gratefully acknowledge the MOF sample synthesis by Peter Behrens and his co-workers Jann Lippke and Andreas Schaate (Leibniz Universität Hannover, Institut für Anorganische Chemie). The linkers used for the MOF samples were synthesized by Adelheid Godt and Thomas Preuße (Universität Bielefeld, Fakultät für Chemie). We also thank Adelheid Godt for carefully reading the manuscript and for her valuable suggestions.
This paper was edited by Thomas Wiegand and reviewed by two anonymous referees.
Advanced Chemistry Development Inc.: ACD/C+H NMR Predictors and DB, https://www.acdlabs.com (last access: 22 November 2022), 2017. a
Anderson, P. W. and Weiss, P. R.: Exchange Narrowing in Paramagnetic Resonance, Rev. Mod. Phys., 25, 269–276, https://doi.org/10.1103/RevModPhys.25.269, 1953. a, b
Bärenwald, R., Achilles, A., Lange, F., Ferreira, T. M., and Saalwächter, K.: Applications of Solid-State NMR Spectroscopy for the Study of Lipid Membranes with Polyphilic Guest (Macro)Molecules, Polymers, 8, 439, https://doi.org/10.3390/polym8120439, 2016. a
Bavykina, A., Kolobov, N., Khan, I. S., Bau, J. A., Ramirez, A., and Gascon, J.: Metal–Organic Frameworks in Heterogeneous Catalysis: Recent Progress, New Trends, and Future Perspectives, Chem. Rev., 120, 8468–8535, https://doi.org/10.1021/acs.chemrev.9b00685, 2020. a
Bignami, G. P. M., Davis, Z. H., Dawson, D. M., Morris, S. A., Russell, S. E., McKay, D., Parke, R. E., Iuga, D., Morris, R. E., and Ashbrook, S. E.: Cost-effective O-17 enrichment and NMR spectroscopy of mixed-metal terephthalate metal-organic frameworks, Chem. Sci., 9, 850–859, https://doi.org/10.1039/c7sc04649a, 2018. a
Brunner, E. and Rauche, M.: Solid-state NMR spectroscopy: an advancing tool to analyse the structure and properties of metal-organic frameworks, Chem. Sci., 11, 4297–4304, https://doi.org/10.1039/d0sc00735h, 2020. a
Clough, S. and Gray, K. W.: Stochastic Theory of Nuclear Magnetic Resonance Line in Rotating Solids, P. Phys. Soc. Lond., 79, 457, https://doi.org/10.1088/0370-1328/79/3/301, 1962. a
Cobo, M. F., Reichert, D., Saalwachter, K., and deAzevedo, E. R.: A double-component Anderson-Weiss approach for describing NMR signals of mobile SIn units: Application to constant-time DIPSHIFT experiments, J. Magn. Reson., 248, 115–125, https://doi.org/10.1016/j.jmr.2014.09.009, 2014. a
de Azevedo, E. R., Saalwächter, K., Pascui, O., De Souza, A. A., Bonagamba, T. J., and Reichert, D.: Intermediate motions as studied by solid-state separated local field NMR experiments, J. Chem. Phys., 128, 104505, https://doi.org/10.1063/1.2831798, 2008. a, b, c
Duer, M.: Solid-State NMR Spectroscopy: Principles and Applications, Blackwell Science Ltd., Oxford, ISBN 0-632-05351-8, 2002. a
Ferey, G.: Hybrid porous solids: past, present, future, Chem. Soc. Rev., 37, 191–214, https://doi.org/10.1039/b618320b, 2008. a
Ferguson, D. B. and Haw, J. F.: Transient Methods for in-Situ Nmr of Reactions on Solid Catalysts Using Temperature Jumps, Anal. Chem., 67, 3342–3348, https://doi.org/10.1021/ac00114a034, 1995. a
Fung, B. M., Khitrin, A. K., and Ermolaev, K.: An improved broadband decoupling sequence for liquid crystals and solids, J. Magn. Reson., 142, 97–101, https://doi.org/10.1006/jmre.1999.1896, 2000. a
Gao, F., Yan, R., Shu, Y., Cao, Q., and Zhang, L.: Strategies for the application of metal–organic frameworks in catalytic reactions, RSC Adv., 12, 10114–10125, https://doi.org/10.1039/D2RA01175A, 2022. a
Hajjar, R., Volkringer, C., Loiseau, T., Guillou, N., Marrot, J., Ferey, G., Margiolaki, I., Fink, G., Morais, C., and Taulelle, F.: Ga-71 Slow-CTMAS NMR and Crystal Structures of MOF-Type Gallium Carboxylates with Infinite Edge-Sharing Octahedra Chains (MIL-120 and MIL-124), Chem. Mater., 23, 39–47, https://doi.org/10.1021/cm1025427, 2011. a
He, P., Lucier, B. E. G., Terskikh, V. V., Shi, Q., Dong, J., Chu, Y., Zheng, A., Sutrisno, A., and Huang, Y.: Spies Within Metal-Organic Frameworks: Investigating Metal Centers Using Solid-State NMR, J. Phys. Chem. C, 118, 23728–23744, https://doi.org/10.1021/jp5063868, 2014. a
Hempel, G., Sotta, P., Long, D. R., and Saalwächter, K.: Efficient polynomial analysis of magic-angle spinning sidebands and application to order parameter determination in anisotropic samples, Magn. Reson., 2, 589–606, https://doi.org/10.5194/mr-2-589-2021, 2021. a, b
Hempel, G., Kurz, R., Paasch, S., Saalwächter, K., and Brunner, E.: Solid-state 13C-NMR spectroscopic determination of sidechain mobilities in zirconium-based metal-organic frameworks, Zenodo [data set], https://doi.org/10.5281/zenodo.10156265, 2023. a
Hirschinger, J.: A simple analytical model to describe dynamic magic-angle spinning experiments, Concept. Magn. Reson. A, 28a, 307–320, https://doi.org/10.1002/cmr.a.20064, 2006. a
Hoffmann, H. C., Paasch, S., Muller, P., Senkovska, I., Padmanaban, M., Glorius, F., Kaskel, S., and Brunner, E.: Chiral recognition in metal-organic frameworks studied by solid-state NMR spectroscopy using chiral solvating agents, Chem. Commun., 48, 10484–10486, https://doi.org/10.1039/c2cc35366k, 2012. a
Horcajada, P., Serre, C., Vallet-Regi, M., Sebban, M., Taulelle, F., and Ferey, G.: Metal-organic frameworks as efficient materials for drug delivery, Angew. Chem. Int. Edit., 45, 5974–5978, https://doi.org/10.1002/anie.200601878, 2006. a
Jain, M. G., Rajalakshmi, G., Agarwal, V., Madhu, P. K., and Mote, K. R.: On the direct relation between REDOR and DIPSHIFT experiments in solid-state NMR, J. Magn. Reson., 308, 106563, https://doi.org/10.1016/j.jmr.2019.07.050, 2019. a
Jiang, Y. J., Huang, J., Marx, S., Kleist, W., Hunger, M., and Baiker, A.: Effect of Dehydration on the Local Structure of Framework Aluminum Atoms in Mixed Linker MIL-53(Al) Materials Studied by Solid-State NMR Spectroscopy, J. Phys. Chem. Lett., 1, 2886–2890, https://doi.org/10.1021/jz1010835, 2010. a
Kaskel, S.: The Chemistry of Metal-Organic Frameworks, Wiley-VCH, Weinheim, ISBN: 978-3-527-33874-0, 2016. a
Ke, F., Yuan, Y. P., Qiu, L. G., Shen, Y. H., Xie, A. J., Zhu, J. F., Tian, X. Y., and Zhang, L. D.: Facile fabrication of magnetic metal-organic framework nanocomposites for potential targeted drug delivery, J. Mater. Chem., 21, 3843–3848, https://doi.org/10.1039/c0jm01770a, 2011. a
Kitagawa, S., Kitaura, R., and Noro, S.-I.: Functional Porous Coordination Polymers, Angew. Chem. Intern. Ed., 43, 2334–2375, https://doi.org/10.1002/anie.200300610, 2004. a
Klein, N., Hoffmann, H. C., Cadiau, A., Getzschmann, J., Lohe, M. R., Paasch, S., Heydenreich, T., Adil, K., Senkovska, I., Brunner, E., and Kaskel, S.: Structural flexibility and intrinsic dynamics in the M-2(2,6-ndc)(2)(dabco) (M = Ni, Cu, Co, Zn) metal-organic frameworks, J. Mater. Chem., 22, 10303–10312, https://doi.org/10.1039/c2jm15601f, 2012. a
Lawson, H. D., Walton, S. P., and Chan, C.: Metal–Organic Frameworks for Drug Delivery: A Design Perspective, ACS Appl. Mater. Inter., 13, 7004–7020, https://doi.org/10.1021/acsami.1c01089, 2021. a
Lee, W. and Goldburg, W.: Nuclear-Magnetic-Resonance Line Narrowing by a Rotating rf Field, Phys. Rev, 140, A1261–A1271, 1965.
Lesage, A., Sakellariou, D., Steuernagel, S., and Emsley, L.: Carbon-proton chemical shift correlation in solid-state NMR by through-bond multiple-quantum spectroscopy, J. Am. Chem. Soc., 120, 13194–13201, https://doi.org/10.1021/ja983048+, 1998a. a
Lesage, A., Steuernagel, S., and Emsley, L.: Carbon-13 spectral editing in solid-state NMR using heteronuclear scalar couplings, J. Am. Chem. Soc., 120, 7095–7100, https://doi.org/10.1021/ja981019t, 1998b. a
Li, H., Li, L., Lin, R.-B., Zhou, W., Zhang, Z., Xiang, S., and Chen, B.: Porous metal-organic frameworks for gas storage and separation: Status and challenges, EnergyChem, 1, 100006, https://doi.org/10.1016/j.enchem.2019.100006, 2019. a
Lieder, C., Opelt, S., Dyballa, M., Henning, H., Klemm, E., and Hunger, M.: Adsorbate Effect on AlO4(OH)(2) Centers in the Metal-Organic Framework MIL-53 Investigated by Solid-State NMR Spectroscopy, J. Phys. Chem. C, 114, 16596–16602, https://doi.org/10.1021/jp105700b, 2010. a
Lippke, J., Brosent, B., von Zons, T., Virmani, E., Lilienthal, S., Preuße, T., Hülsmann, M., Schneider, A. M., Wuttke, S., Behrens, P., and Godt, A.: Expanding the Group of Porous Interpenetrated Zr-Organic Frameworks (PIZOFs) with Linkers of Different Lengths, Inorg. Chem., 56, 748–761, https://doi.org/10.1021/acs.inorgchem.6b01814, 2017. a, b
Liu, X., Shan, Y., Zhang, S., Kong, Q., and Pang, H.: Application of metal organic framework in wastewater treatment, Green Energy and Environment, 8, 698–721, https://doi.org/10.1016/j.gee.2022.03.005, 2023. a
Loiseau, T., Muguerra, H., Ferey, G., Haouas, M., and Taulelle, F.: Synthesis and structural characterization of a new open-framework zinc terephthalate Zn-3(OH)(2)(bdc)(2).2DEF, with infinite Zn-(mu(3)-OH)-Zn chains, J. Solid State Chem., 178, 621–628, https://doi.org/10.1016/j.jssc.2004.12.004, 2005. a
Lucier, B. E. G., Chen, S. S., and Huang, Y. N.: Characterization of Metal-Organic Frameworks: Unlocking the Potential of Solid-State NMR, Accounts Chem. Res., 51, 319–330, https://doi.org/10.1021/acs.accounts.7b00357, 2018. a
Maranescu, B. and Visa, A.: Applications of Metal-Organic Frameworks as Drug Delivery Systems, Int. J. Mol. Sci., 23, 4458, https://doi.org/10.3390/ijms23084458, 2022. a
Maurin, G., Serre, C., Cooper, A., and Férey, G.: The new age of MOFs and of their porous-related solids, Chem. Soc. Rev., 46, 3104–3107, https://doi.org/10.1039/C7CS90049J, 2017. a
Mehring, M.: Principles of High Resolution NMR in Solids, Springer, ISBN-13: 978-3-642-96334-6, https://doi.org/10.1007/978-3-642-96332-2, 1983. a
Metz, G., Wu, X. L., and Smith, S. O.: Ramped-Amplitude Cross-Polarization in Magic-Angle-Spinning Nmr, J. Magn. Reson. Ser. A, 110, 219–227, https://doi.org/10.1006/jmra.1994.1208, 1994. a
Mowat, J. P. S., Miller, S. R., Slawin, A. M. Z., Seymour, V. R., Ashbrook, S. E., and Wright, P. A.: Synthesis, characterisation and adsorption properties of microporous scandium carboxylates with rigid and flexible frameworks, Micropor. Mesopor. Mat., 142, 322–333, https://doi.org/10.1016/j.micromeso.2010.12.016, 2011. a
Munowitz, M. G., Griffin, R. G., Bodenhausen, G., and Huang, T. H.: Two-Dimensional Rotational Spin-Echo Nuclear Magnetic-Resonance in Solids – Correlation of Chemical-Shift and Dipolar Interactions, J. Am. Chem. Soc., 103, 2529–2533, https://doi.org/10.1021/ja00400a007, 1981. a
Paasch, S. and Brunner, E.: Trends in solid-state NMR spectroscopy and their relevance for bioanalytics, Anal. Bioanal. Chem., 398, 2351–2362, https://doi.org/10.1007/s00216-010-4037-5, 2010. a
Pascanu, V., González Miera, G., Inge, A. K., and Martín-Matute, B.: Synthesis of metal-organic frameworks: A mini review, Korean J. Chem. Eng., 9, 17–29, https://doi.org/10.1021/jacs.9b00733, 2019. a
Petrov, O. V., Chlan, V., Rohlíček, J., Demel, J., Veselý, J., and Lang, J.: Exploring Structural Disorders in Aluminum-Containing Metal–Organic Frameworks: Comparison of Solid-State 27Al NMR Powder Spectra to DFT Calculations on Bulk Periodic Structures, J. Phys. Chem. C, 124, 12569–12579, https://doi.org/10.1021/acs.jpcc.0c03000, 2020. a
Pines, A., Gibby, M., and Waugh, J.: Proton-Enhanced Nmr of Dilute Spins in Solids, J. Chem. Phys., 59, 569–590, 1973. a, b
Pursch, M., Sander, L. C., and Albert, K.: Chain order and mobility of high-density C-18 phases by solid-state NMR spectroscopy and liquid chromatography, Anal. Chem., 68, 4107–4113, https://doi.org/10.1021/ac9606113, 1996. a
Remya, V. R. and Kurian, M.: Synthesis and catalytic applications of metal–organic frameworks: a review on recent literature, International Nano Letters, 141, 7223–7234, https://doi.org/10.1007/s40089-018-0255-1, 2019. a
Renault, M., Cukkemane, A., and Baldus, M.: Solid-State NMR Spectroscopy on Complex Biomolecules, Angew. Chem. Int. Edit., 49, 8346–8357, https://doi.org/10.1002/anie.201002823, 2010. a
Roy, P., Schaate, A., Behrens, P., and Godt, A.: Post-Synthetic Modification of Zr-Metal-Organic Frameworks through Cycloaddition Reactions, Chem.-Eur. J., 18, 6979–6985, https://doi.org/10.1002/chem.201103288, 2012. a
Schaate, A., Roy, P., Preusse, T., Lohmeier, S. J., Godt, A., and Behrens, P.: Porous Interpenetrated Zirconium-Organic Frameworks (PIZOFs): A Chemically Versatile Family of Metal-Organic Frameworks, Chem.-Eur. J., 17, 9320–9325, https://doi.org/10.1002/chem.201101015, 2011. a, b
Schaefer, J., Mckay, R. A., and Stejskal, E. O.: Dipolar Rotational Spin-Echo C-13 Nmr of Polymers, J. Magn. Reson., 52, 123–129, https://doi.org/10.1016/0022-2364(83)90262-7, 1983. a
Schulze, D., Ernst, H., Fenzke, D., Meiler, W., and Pfeifer, H.: Applicability of the Nmr Cross-Polarization Technique to Separate Rigid and Mobile Components in Coal Structure, J. Phys. Chem.-US, 94, 3499–3502, https://doi.org/10.1021/j100372a026, 1990. a, b
Simonutti, R., Comotti, A., Bracco, S., and Sozzani, P.: Surfactant organization in MCM-41 mesoporous materials as studied by C-13 and Si-29 solid-state NMR, Chem. Mater., 13, 771–777, https://doi.org/10.1021/cm001088i, 2001. a
Sindorf, D. W. and Maciel, G. E.: Solid-State Nmr-Studies of the Reactions of Silica Surfaces with Polyfunctional Chloromethylsilanes and Ethoxymethylsilanes, J. Am. Chem. Soc., 105, 3767–3776, https://doi.org/10.1021/ja00350a003, 1983. a, b
Tranchemontagne, D. J., Mendoza-Cortés, J. L., O'Keeffe, M., and Yaghi, O. M.: Secondary building units, nets and bonding in the chemistry of metal–organic frameworks, Chem. Soc. Rev., 38, 1257–1283, https://doi.org/10.1039/B817735J, 2009. a
Volkringer, C., Loiseau, T., Ferey, G., Morais, C. M., Taulelle, F., Montouillout, V., and Massiot, D.: Synthesis, crystal structure and Ga-71 solid state NMR of a MOF-type gallium trimesate (MIL-96) with mu(3)-oxo bridged trinuclear units and a hexagonal 18-ring network, Micropor. Mesopor. Mat., 105, 111–117, https://doi.org/10.1016/j.micromeso.2007.05.018, 2007. a
Witherspoon, V. J., Xu, J., and Reimer, J. A.: Solid-State NMR Investigations of Carbon Dioxide Gas in Metal-Organic Frameworks: Insights into Molecular Motion and Adsorptive Behavior, Chem. Rev., 118, 10033–10048, https://doi.org/10.1021/acs.chemrev.7b00695, 2018. a
Wittmann, T., Tschense, C. B. L., Zappe, L., Koschnick, C., Siegel, R., Staglich, R., Lotsch, B. V., and Senker, J.: Selective host-guest interactions in metal-organic frameworks via multiple hydrogen bond donor-acceptor recognition sites, J. Mater. Chem. A, 7, 10379–10388, https://doi.org/10.1039/c8ta12190g, 2019. a
Wong, Y. T. A., Martins, V., Lucier, B. E. G., and Huang, Y. N.: Solid-State NMR Spectroscopy: A Powerful Technique to Directly Study Small Gas Molecules Adsorbed in Metal-Organic Frameworks, Chem.-Eur. J., 25, 1848–1853, https://doi.org/10.1002/chem.201803866, 2019. a
Wurl, A., Saalwächter, K., and Mendes Ferreira, T.: Time-domain proton-detected local-field NMR for molecular structure determination in complex lipid membranes, Magn. Reson., 4, 115–127, https://doi.org/10.5194/mr-4-115-2023, 2023.
Yan, Y., Kolokolov, D. I., da Silva, I., Stepanov, A. G., Blake, A. J., Dailly, A., Manuel, P., Tang, C. C., Yang, S. H., and Schroder, M.: Porous Metal-Organic Polyhedral Frameworks with Optimal Molecular Dynamics and Pore Geometry for Methane Storage, J. Am. Chem. Soc., 139, 13349–13360, https://doi.org/10.1021/jacs.7b05453, 2017. a