the Creative Commons Attribution 4.0 License.
the Creative Commons Attribution 4.0 License.
 | 16 Apr 2026
Accelerated 19F biomolecular magic-angle spinning NMR with paramagnetic dopants
Lea M. Becker
Giorgia Toscano
Anna Kapitonova
Rajkumar Singh
Undina Guillerm
Roman J. Lichtenecker
The advantageous characteristics attributed to the 19F nucleus have made it a popular target for nuclear magnetic resonance (NMR) once again in recent years. Aside from solution NMR, an increasing number of studies have been conducted applying solid-state magic-angle spinning (MAS) NMR to fluorine-labelled samples. Here, the high chemical shift anisotropy and strong dipolar couplings can be utilised to get structural insights into proteins and measure long distances. Despite increasing popularity and promising benefits, the sensitivity of biomolecular 19F MAS NMR often suffers from slow longitudinal T1 relaxation and therefore long recycle delays. In this work, we expand paramagnetic doping, an approach commonly used to reduce proton T1 relaxation times, to 19F-labelled biological samples. We study the effect of Gd(DTPA) and Gd(DTPA-BMA) on 19F T1 and T2, and 13C T1 and T2 relaxation in a [5-19F13C]-tryptophan-labelled protein via 19F-detected MAS NMR experiments. The observed paramagnetic relaxation enhancement substantially reduces measurement times of 19F MAS NMR experiments without compromising resolution. Additionally, we report the chemical shift assignments of all four fluorotryptophan signals in the 12×39 kDa-large protein TET2 using a mutagenesis approach.
- Article
(2533 KB) - Full-text XML
-
Supplement
(23193 KB) - BibTeX
- EndNote


Biomolecular 19F nuclear magnetic resonance (NMR) has regained attention in recent years due to the unique properties of the 19F nucleus and the diverse labelling strategies for proteins and nucleic acids, which make it a versatile tool for a wide range of applications and systems (Sengupta, 2024; Gronenborn, 2022; Juen et al., 2024; Overbeck et al., 2020; Heller et al., 2024). Recently, there have been exciting developments in the synthesis of compounds for the 19F-labelling of proteins (Boeszoermenyi et al., 2019; Toscano et al., 2024a, b; Suleiman et al., 2024). The introduction of a carbon-13 to form a 19F−13C spin pair facilitates new spectroscopic possibilities such as two-dimensional experiments and the exploration of the 19F−13C TROSY effect. Additional deuteration of labelling compounds can reduce the need for 1H decoupling and lead to a reduction of unwanted relaxation pathways.
In contrast to solution-state NMR, solid-state magic-angle spinning (MAS) 19F NMR was challenging for a long time due to the high chemical shift anisotropy (CSA) of the 19F nucleus and strong dipolar 1H−19F couplings, which can lead to severe line broadening (Ulrich, 2005). Following the development of faster spinning and specialised probe designs that enable efficient averaging and decoupling of the CSA and dipolar couplings, biomolecular 19F MAS NMR is becoming more feasible. These advancements have led to 19F NMR studies of protein microcrystals, membrane proteins, and large biomolecular assemblies such as virus capsids. The focus of these studies was set on assignments and structural investigations utilising the possibility of measuring distances of up to 20 Å (Roos et al., 2018; Duan et al., 2022; Shcherbakov et al., 2019, 2021; Porat-Dahlerbruch et al., 2022; Wang et al., 2018).
Despite the large gyromagnetic ratio of the fluorine nucleus, the sensitivity of 19F-excited MAS NMR experiments is often limited by long longitudinal T1 relaxation times, which are often several seconds (Duan et al., 2022; Roos et al., 2018; Wang et al., 2018; Porat-Dahlerbruch et al., 2022). As the recycle delay for an optimal signal-to-noise ratio (SNR) is directly related to the longitudinal relaxation of the excited nucleus (; Schanda, 2009), most of the experiment time is spent waiting for the spin polarisation to build up again. The use of deuterated precursors for 19F labelling results in even longer T1 relaxation, as short-range 1H−19F dipolar couplings are reduced and dipolar relaxation pathways are minimised.
Paramagnetic doping is an established and effective method to reduce the acquisition time of measurements. In solids, it has primarily been used for experiments in which protons are the initially excited nuclei. The addition of a paramagnetic compound to the sample, e.g. Cu2+ or Gd3+ chelates, results in enhanced nuclear spin relaxation. The longitudinal Γ1 and transverse Γ2 paramagnetic relaxation enhancement (PRE) is given by Solomon (1955); Bertini et al. (2001); Bloembergen and Morgan (1961); Konig (1982)
with the vacuum permeability μ0, the gyromagnetic ratio of the nucleus γI, the electron g value ge, the Bohr magneton μB, the electron spin quantum number S, the electron-nucleus distance r, the rotational correlation time τc, and the nuclear and electron Larmor frequencies ωI and ωe. The goal is to find a concentration of the paramagnetic compound in the buffer that, on the one hand, significantly accelerates 1H T1 relaxation, allowing a shorter recycle delay and therefore faster acquisition, and, on the other hand, does not shorten T2, so as not to induce line broadening. While the paramagnetic effects depend on the proximity of the unpaired electron, the enhancement of longitudinal relaxation is spread across the molecule from those nuclei directly relaxed by the paramagnetic centre to other nuclei via 1H−1H spin diffusion (Wickramasinghe et al., 2009). The first studies to achieve a significant increase in SNR per unit time utilised Cu2+-EDTA as a dopant, which remains widely used to date (Wickramasinghe et al., 2007, 2009). However, the higher PRE effect of Gd3+ chelates, such as Gd(DOTA), Gd(DTPA-BMA), or Gd(DTPA), enables the use of lower concentrations of the compound, reducing possible interactions with the studied biomolecule and sample heating (Linser et al., 2007; Ullrich et al., 2014; Mroue et al., 2014; Öster et al., 2019).
Even though paramagnetic doping was mainly applied for its effect on the T1 relaxation of protons, it also increases the relaxation of other nuclei, with the strength of the effect being proportional to the squared gyromagnetic ratio of the nucleus (Eq. 1). Due to the high gyromagnetic ratio of 19F, a significant reduction in measurement time can be expected for biomolecular 19F MAS NMR experiments with similar concentrations of paramagnetic compounds, as are used for proton-excited experiments.
Transversal and longitudinal PREs of fluorine in solution were measured previously to obtain distance restraints between a fluorine atom and a paramagnetic moiety (Shi et al., 2012; Matei and Gronenborn, 2016; Bondarenko et al., 2019; Huang et al., 2020). In solids, Lu et al. (2020) demonstrated paramagnetic doping with Cu2+ ions in the context of fluorinated crystalline pharmaceuticals for structural characterisation by 19F MAS NMR. They achieved a significant reduction of the 19F T1 relaxation times in their samples, resulting in approximately 2.5 times faster acquisition of fluorine NMR spectra, which highlights the potential benefits of combining paramagnetic doping and 19F solid-state MAS NMR (Lu et al., 2020).
In this work, we explore the potential benefits of paramagnetic doping for biomolecular 19F MAS NMR on proteins, which has not been reported so far, to the best of our knowledge. Using the deuterated 5-fluorotryptophan-labelled protein TET2 (12×39 kDa), we measure 19F T1 and T2, and 13C T1 and T2 as a function of the concentration of two Gd3+ complexes, Gd(DTPA-BMA) and Gd(DTPA). We find that a concentration of 8 mM Gd(DTPA-BMA) is optimal to reduce measurement times of 19F MAS NMR experiments through a decrease in the 19F T1 relaxation time without significant line broadening.
2.1 Protein production and purification
The aminopeptidase TET2 from Pyrococcus horikoshii (UniProt entry O59196) was produced via overexpression of the pET41c-PhTET2 plasmid in Escherichia coli BL21(DE3) RIL cells. The plasmid is available from AddGene (https://www.addgene.org/182428/, last access: 15 February 2026). For the resonance assignment, tryptophans were mutated into phenylalanines in different combinations either as single mutant (mutant 1: W106F) or as triple mutants (mutant 2 (only W106): W136F, W164F, W276F; mutant 3 (only W136): W106F, W164F, W276F; mutant 4 (only W164): W106F, W136F, W276F; mutant 5 (only W276): W106F, W136F, W164F). The 19F labelling was achieved either with 5-fluoroindole (Sigma-Aldrich, catalogue number F9108) in protonated medium (mutants) or with []-5-fluoroanthranilic acid (5FC-anthranilic acid) in deuterated medium (wild type).
The 5-fluoroanthranilic acid isotopologue was synthesised in-house by adapting the synthetic route reported by Suleiman et al. (2024) to the present labelling scheme; details of the synthesis will be published elsewhere.
The plasmid (kanamycin resistance) was transformed into competent BL21(DE3) RIL cells (chloramphenicol resistance) via heat shock. Unless otherwise mentioned, all cultures contained kanamycin and chloramphenicol, and shaking was performed at 200 rpm and 37 °C.
5-fluoroindole labelling was achieved as follows. After precultures in LB medium and minimal M9 medium, the main culture was inoculated to an optical density at 600 nm (OD600) of 0.2 and shaken until it reached 0.6–0.7. At this point, 1 g L−1 glyphosate (abcr, Karlsruhe, Germany; catalogue number AB505195) was added, and the culture was grown for 15 min before 100 mg L−1 5-fluoroindole, 50 mg L−1 L-tyrosine (Sigma T3754), and 50 mg L−1 L-phenylalanine (Sigma 78019) were added. The culture was grown for 45 min, and expression was induced with 1 mM isopropyl-β-D-thiogalactopyranosid (IPTG). Cells were harvested at 6500 rcf for 15 min after 4 h of shaking.
Labelling with 5FC-anthranilic acid was achieved as follows. Cells were adjusted to deuterated M9 medium by growth in consecutive precultures of LB medium and M9 medium prepared with 100 % H2O, 50 % H2O/50 % D2O, and 100 % D2O. The final preculture and the main culture were prepared with 15NH4Cl and D-2H7-glucose. The main culture was inoculated to an OD600 of 0.2 and shaken until it reached 0.6–0.7. At this point, 1 g L−1 glyphosate, 50 mg L−1 L-tyrosine, 50 mg L−1 L-phenylalanine, and 15 mg L−1 5FC-anthranilic acid were added, and the culture was shaken for 40 min. The temperature was then reduced to 28 °C for 15 min before induction with 1 mM IPTG. Cells were grown overnight at 28 °C and then harvested at 6500 rcf for 15 min.
The cell pellet was re-suspended in lysis buffer (50 mM Tris-HCl pH 7.5, 150 mM NaCl, 0.05 mg mL−1 DNase, 2 mM MgCl2, 0.025 mg mL−1 RNase, and 0.5 tablets cOmplete EDTA-free protease inhibitor), kept on ice for 30 min, and sonicated for 2 min. A heat shock was performed at 80 °C for 15 min. After the addition of 10 mL buffer A (20 mM Tris-HCl pH 7.5, 100 mM NaCl), the cell debris was collected by centrifugation at 46 000 rcf for 40 min at 4 °C. The supernatant was washed with buffer A using an Amicon ultra centrifugal filter with a molecular weight cutoff of 100 kDa before loading onto a RESOURCE Q column (Cytiva) and eluted with a gradient over 10 column volumes from buffer A to buffer B (20 mM Tris-HCl pH 7.5, 1 M NaCl). The fractions containing the protein were concentrated, loaded onto a HiLoad 10/300 Superdex 200 pg column (Cytiva), and eluted in buffer A.
2.2 Sample preparation
Samples for solid-state MAS NMR were prepared by batch crystallisation of TET2 with 2-methyl-2,4-pentanediol (MPD; Sigma 68340) (Gauto et al., 2019a). A solution of 10 mg mL−1 protein and the paramagnetic compound (where applicable; Gd(DTPA): Sigma 381667, Gd(DTPA-BMA): GE Healthcare Omniscan (contains 4.2 % NaCa(DTPA-BMA)) in buffer A was mixed with MPD in a ratio of 1:1. The concentration given for the paramagnetic compound in the following is related to the final concentration in the sample, including MPD. The microcrystals were filled into a 1.3 mM MAS rotor (Bruker) by ultracentrifugation overnight at 4 °C and 68 000 rcf.
2.3 NMR
MAS NMR experiments were performed on a Bruker Avance Neo spectrometer operating at 14.09 T (600 MHz 1H Larmor frequency). A triple-resonance HFX probe head from PhoenixNMR equipped with a 1.3 mm MAS stator from Bruker was used, with the X channel tuned to 13C. Temperature calibration was done with an external 2H4-methanol sample (Karschin et al., 2022), and chemical shift referencing was done indirectly via the 1H signal of 2,2-dimethyl-2-silapentane-5-sulfonate sodium salt (DSS). All experiments were performed at a MAS frequency of 55.555 kHz and a sample temperature of approximately 309 K. Spectra were processed with Bruker Topspin software (versions 4.1.4 and 4.5.0).
Pulse sequence diagrams can be found in Fig. 1. All experiments were performed with 19F detection (10 ms acquisition time), and 1H and 13C decoupling unless stated otherwise. Composite pulse decoupling during acquisition was typically achieved with 10 kHz swfTPPM (Thakur et al., 2006) on 1H and 10 kHz WALTZ-16 (Shaka et al., 1983) on 13C. The recycle delay was set to of 19F, depending on the concentration of the paramagnetic compound, except for the 19F saturation recovery experiment, in which the recycle delay was set to 1.2 s. The pre-saturation block in the saturation recovery experiment was repeated n=50 times with a delay Δ=4.5 ms. Magnetisation transfer in 13C relaxation experiments was achieved via dipolar 19F−13C cross-polarisation (CP) steps. Typical CP spin-lock radio-frequency field strengths were 40 kHz on 13C and 90 kHz on 19F, with a linear ramp of 90 %–100 % and a transfer time of 400 µs. 19F and 13C relaxation experiments were recorded as pseudo two-dimensional spectra with one 19F frequency dimension and one pseudo dimension in which a relaxation delay τ was incremented.
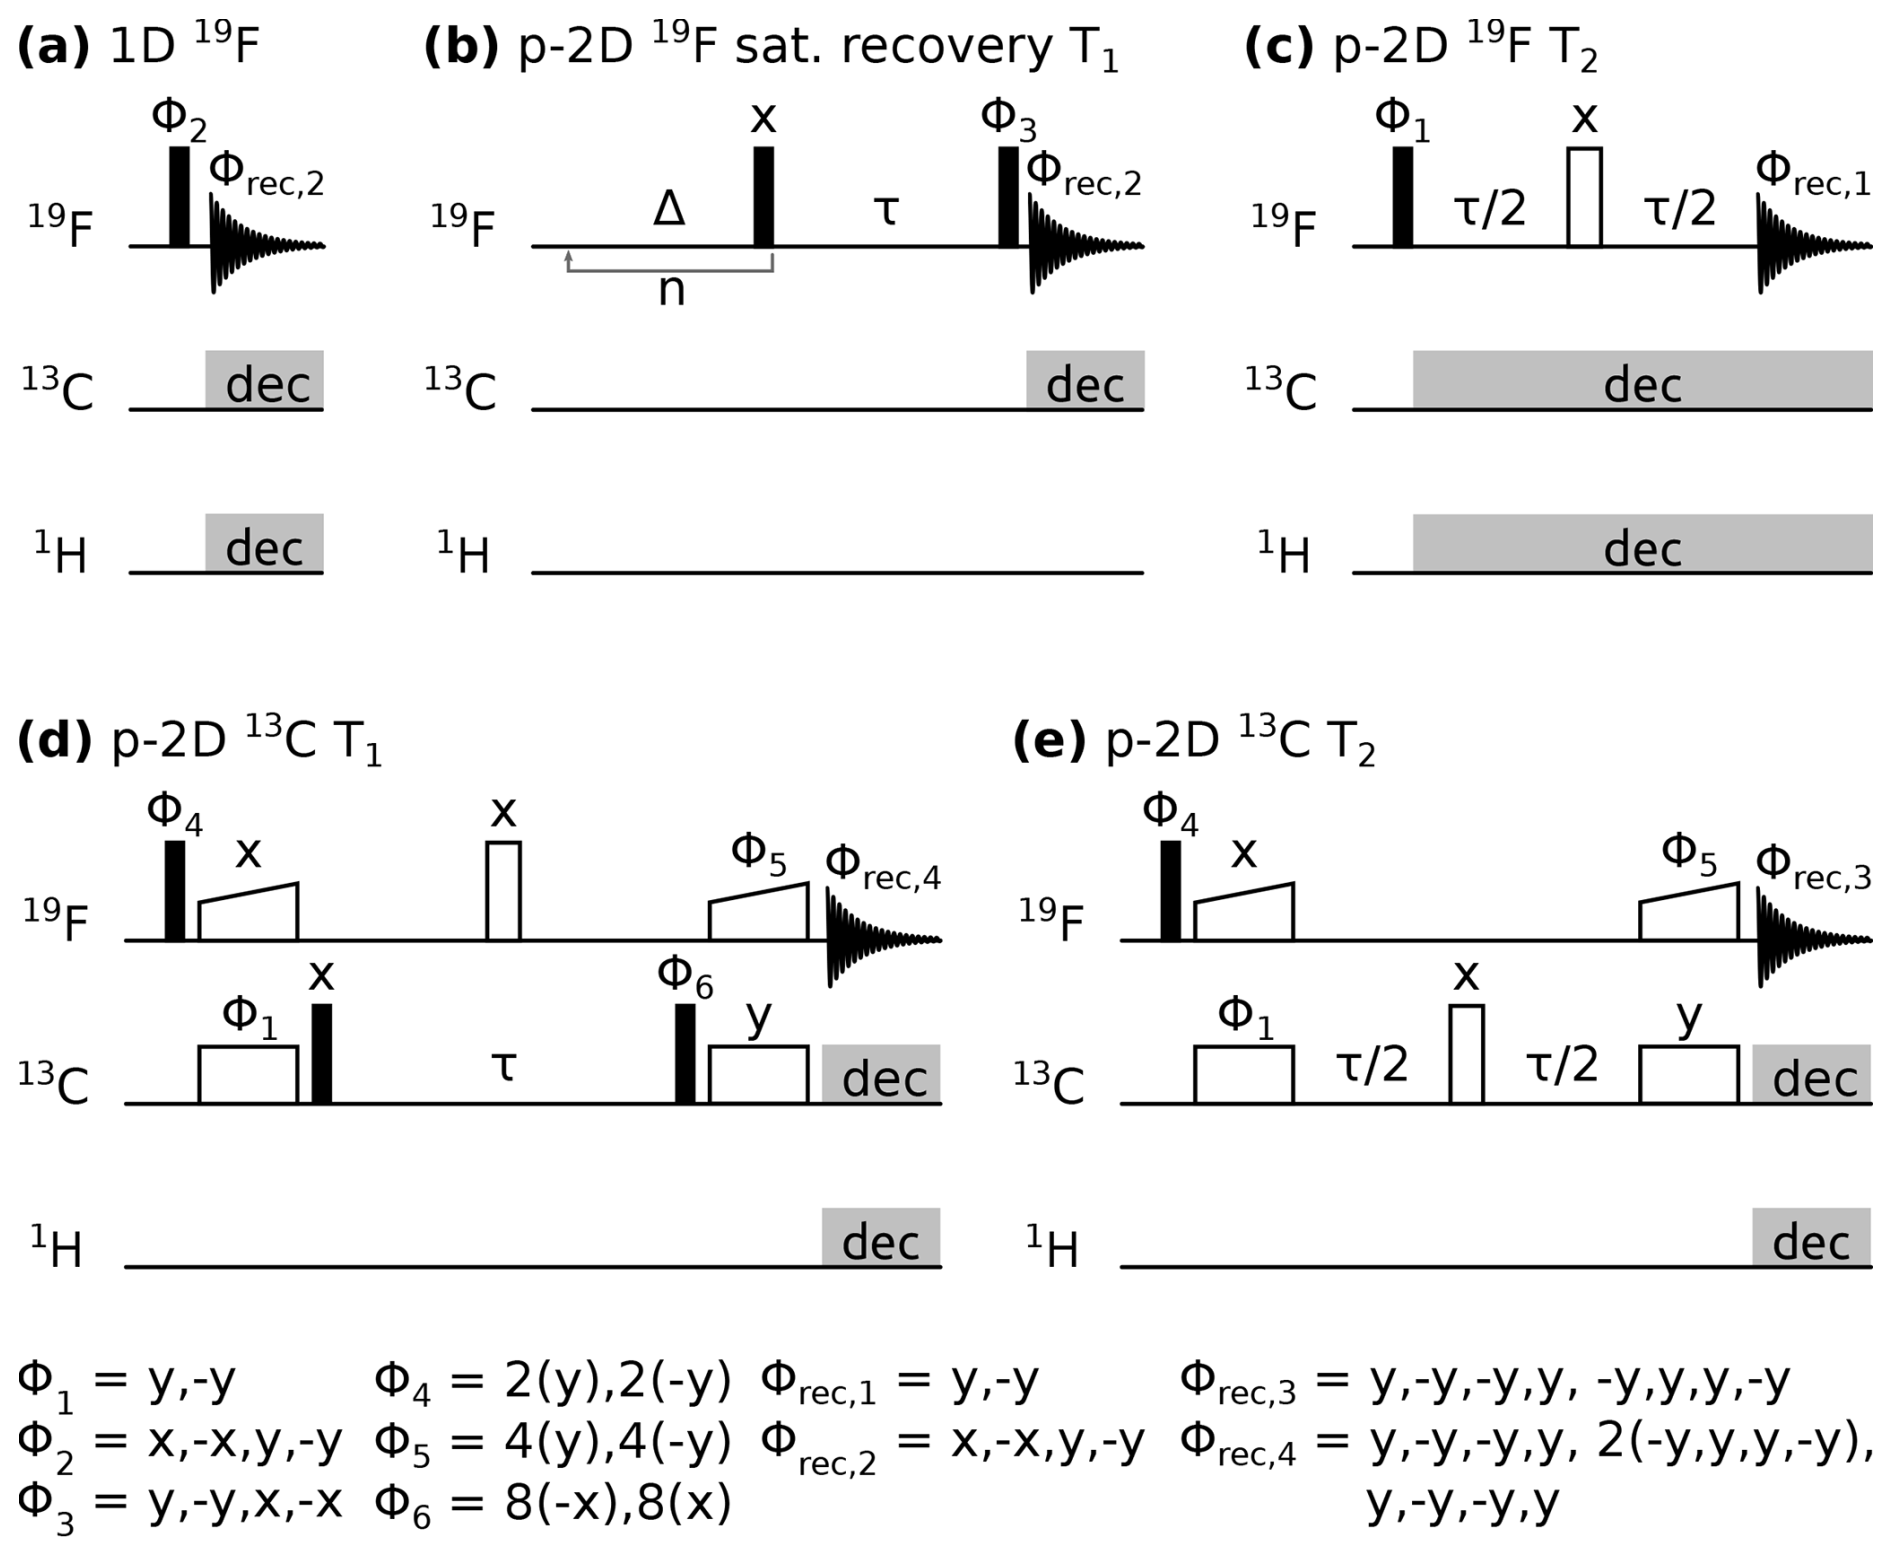
Figure 1Pulse sequences used in this study. Closed, open, and wide-open rectangles denote 90°, 180°, and CP spin-lock pulses, respectively. Grey rectangles indicate composite pulse decoupling. Δ and τ are delays, and n indicates a loop. Pulse phases are indicated above the pulse, with Φn marking a pulse undergoing phase cycling, as noted below. Acquisition is denoted with a free induction decay scheme with the receiver phase Φrec,n indicated above. p-2D stands for pseudo two-dimensional spectrum with one frequency dimension and one pseudo dimension in which a delay τ is incremented.
2.4 Relaxation rate analysis
Spectra were processed as pseudo two-dimensional spectra in Topspin and converted to UCSF format with the bruk2ucsf program provided in Sparky (Goddard and Kneller, 2008). Python scripts for analysis of relaxation rate constants were written in-house, utilising the Nmrglue package (Helmus and Jaroniec, 2013). Spectra were split into individual 1D slices, and peaks were fitted with the routine implemented in Nmrglue. The intensities were then fitted to a mono-exponential function. Errors were determined by Monte Carlo analysis (500 iterations) using one standard deviation of the spectral noise.
3.1 Assignment of fluorine-labelled tryptophans in TET2
TET2 is a dodecameric aminopeptidase from P. horikoshii that has been studied extensively by MAS NMR previously (Gauto et al., 2019b, 2022). Each of the 12 identical subunits contains four tryptophan residues: W106, W136, W164, and W276 (Fig. 2a). To achieve fluorine labelling of the aromatic ring, we expressed TET2 in deuterated M9 medium and added 5-fluoroanthranilic acid, which is metabolised by the bacteria into 5-fluoro-L-tryptophan (Fig. 2b). This precursor has a 19F−13C spin pair at position 5 in the aromatic ring and is deuterated at positions 3, 4, and 6. We will refer to the labelled protein as 5FC-W-TET in the remainder of this discussion. As expected, the 19F MAS NMR spectrum of 5FC-W-TET shows four individual peaks (Fig. 2c, upper spectrum). For the assignment of the signals, we prepared five Trp to Phe mutants in non-deuterated medium using the commercially available precursor 5-fluoroindole (see the Methods section for details). The respective spectra show either one (triple mutants) or three (single mutant) signals, which allowed us to assign the four signals (Fig. 2c, bottom spectra). Note that the spectrum of the deuterated wild type is shifted due to an isotope shift (Luck et al., 1996).
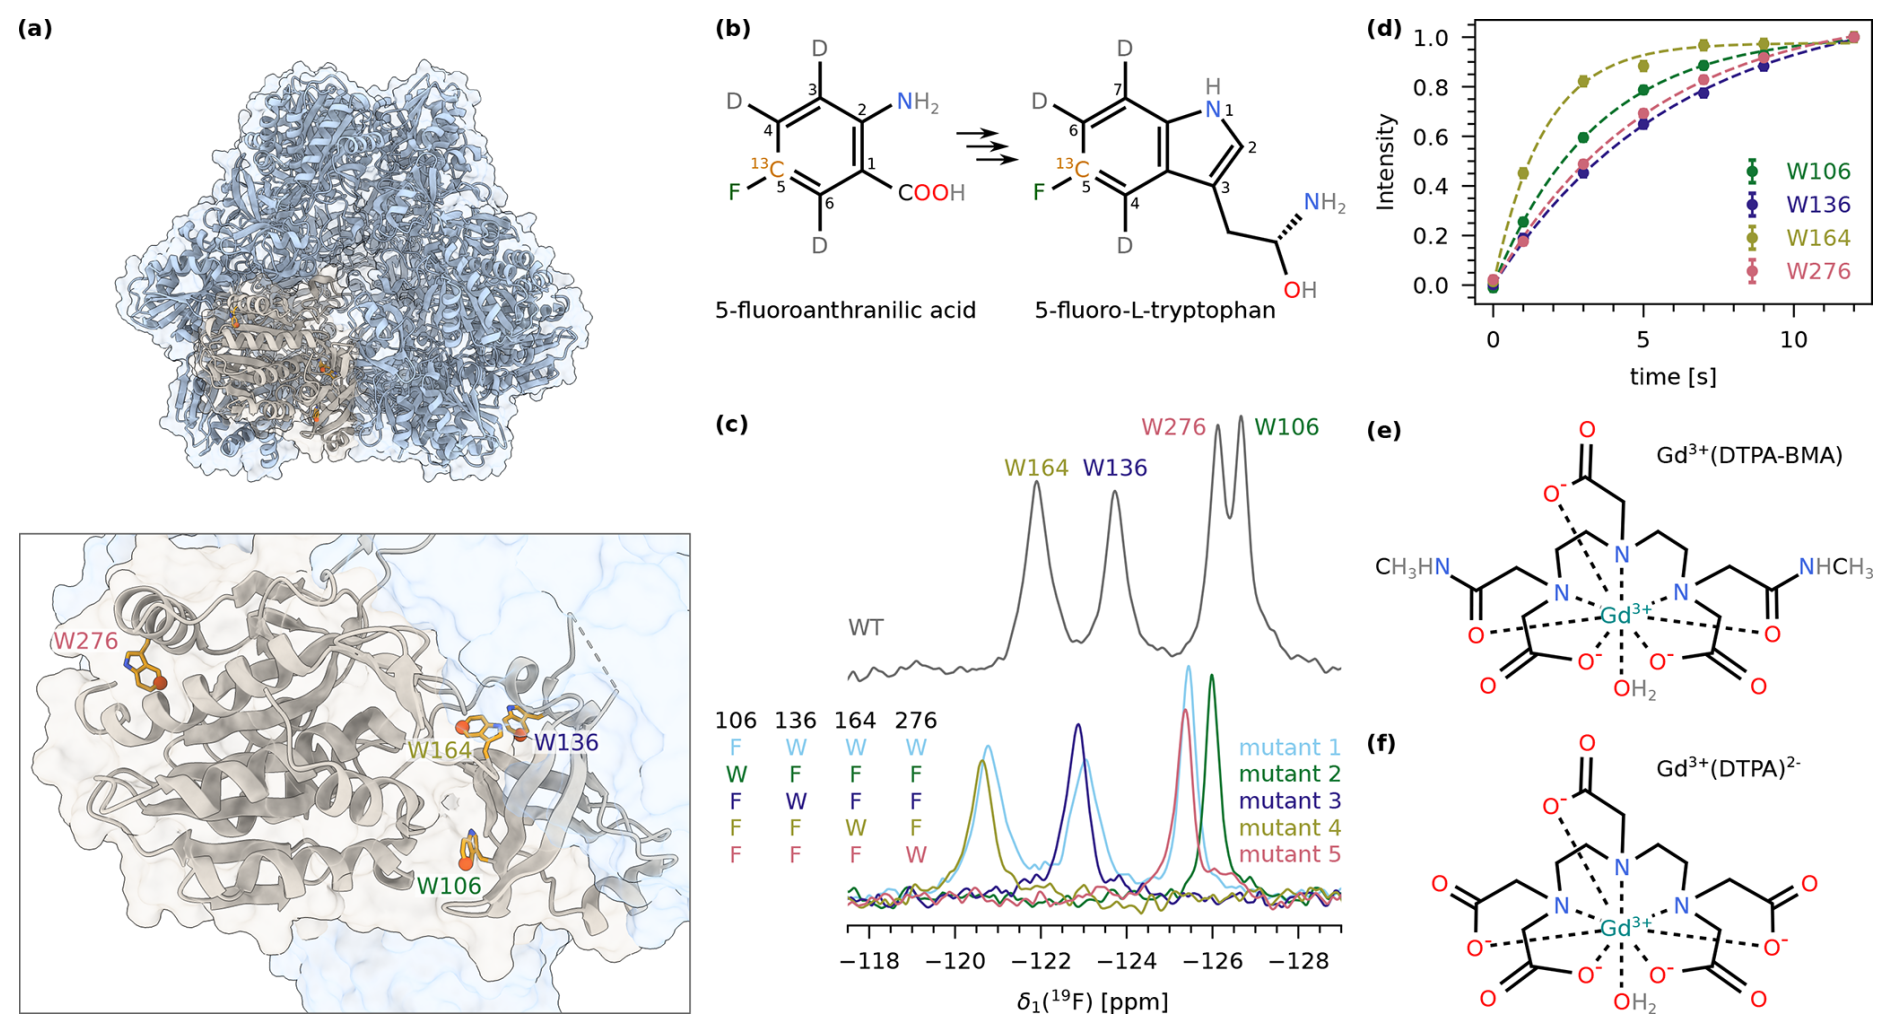
Figure 2(a) Structure of the dodecameric TET2 (PDB: 1Y0R) (Borissenko and Groll, 2005) in cartoon representation with one subunit highlighted in beige (upper panel). The lower panel shows a close-up of one subunit with the four tryptophans indicated as orange sticks. Position 5 in the tryptophan ring is highlighted with spheres. (b) Structure of 5-fluoroanthranilic acid (left), which is converted into 5-fluoro-L-tryptophan (right) by the bacteria. (c) 1D 19F MAS NMR spectrum of 5FC-W-TET. The upper panel displays the spectrum of the wild type, showing all four tryptophan peaks. The lower panel shows spectra of the five assignment mutants (mutant 1: W106F; mutant 2: W136F, W164F, W276F; mutant 3: W106F, W164F, W276F; mutant 4: W106F, W136F, W276F; mutant 5: W106F, W136F, W164F; see the Methods section for details). The resulting assignment is indicated at the top. The wild-type spectrum is shifted due to the isotope shift, as this sample is deuterated compared to the mutants. (d) Exponential fits of 19F saturation recovery experiments on 5FC-W-TET without paramagnetic dopant. (e) Structure of Gd(DTPA-BMA). (f) Structure of Gd(DTPA).
3.2 The effect of Gd(DTPA-BMA) and Gd(DTPA) on bulk 19F and 13C relaxation
In recent years, several studies have been published using biomolecular 19F MAS NMR to study structural aspects of proteins (Roos et al., 2018; Duan et al., 2022; Shcherbakov et al., 2019, 2021; Porat-Dahlerbruch et al., 2022; Wang et al., 2018). The 19F T1 relaxation time was often reported to be several seconds long, leading to a long to obtain an optimal SNR. We measured 19F T1 of 5FC-W-TET with a saturation recovery experiment (Fig. 2d), and obtained values between 1.67±0.08 s (W164) and 6.0±0.4 s (W136). Considering the highest value, this would correspond to a recycle delay of .
To reduce the 19F T1, we used paramagnetic doping with two different Gd3+ chelates. We prepared samples with six concentrations of Gd(DTPA-BMA) (0, 2, 4, 6, 8, and 16 mM, Fig. 2e), and measured 19F T1 and T2, and 13C T1 and T2 for each residue (Figs. S1, S2, S3, S4, S6 in the Supplement). For Gd(DTPA) (Fig. 2f), we prepared samples with 2 and 8 mM of the compound and measured 19F T1 and T2 (Fig. S5, S6). The bulk relaxation rates (average over all residues) are shown in Fig. 3a–d.
At 8 mM Gd(DTPA), the increase in R2 led to a broadening of the whole spectrum that made the individual peaks indistinguishable (Fig. S7). Additionally, Gd(DTPA) changed the crystallisation behaviour of TET2, possibly due to binding to the protein surface (Fig. S8) (Petros et al., 1990). We therefore refrained from preparing samples with other concentrations or measuring 13C relaxation rate constants.
We find that both compounds lead to an increase in R1 as well as R2. To quantify the effect of the two compounds, we determined the longitudinal and transverse PREs (Γ1 and Γ2), which are given by the slope of a linear fit of the respective relaxation rate constants as a function of the concentration of paramagnetic dopant. We performed fits of the bulk and per-residue relaxation rate constants to obtain the PREs for Gd(DTPA-BMA) (19F and 13C; Fig. 3e–f) and for Gd(DTPA) (only 19F; Fig. 3g–h).
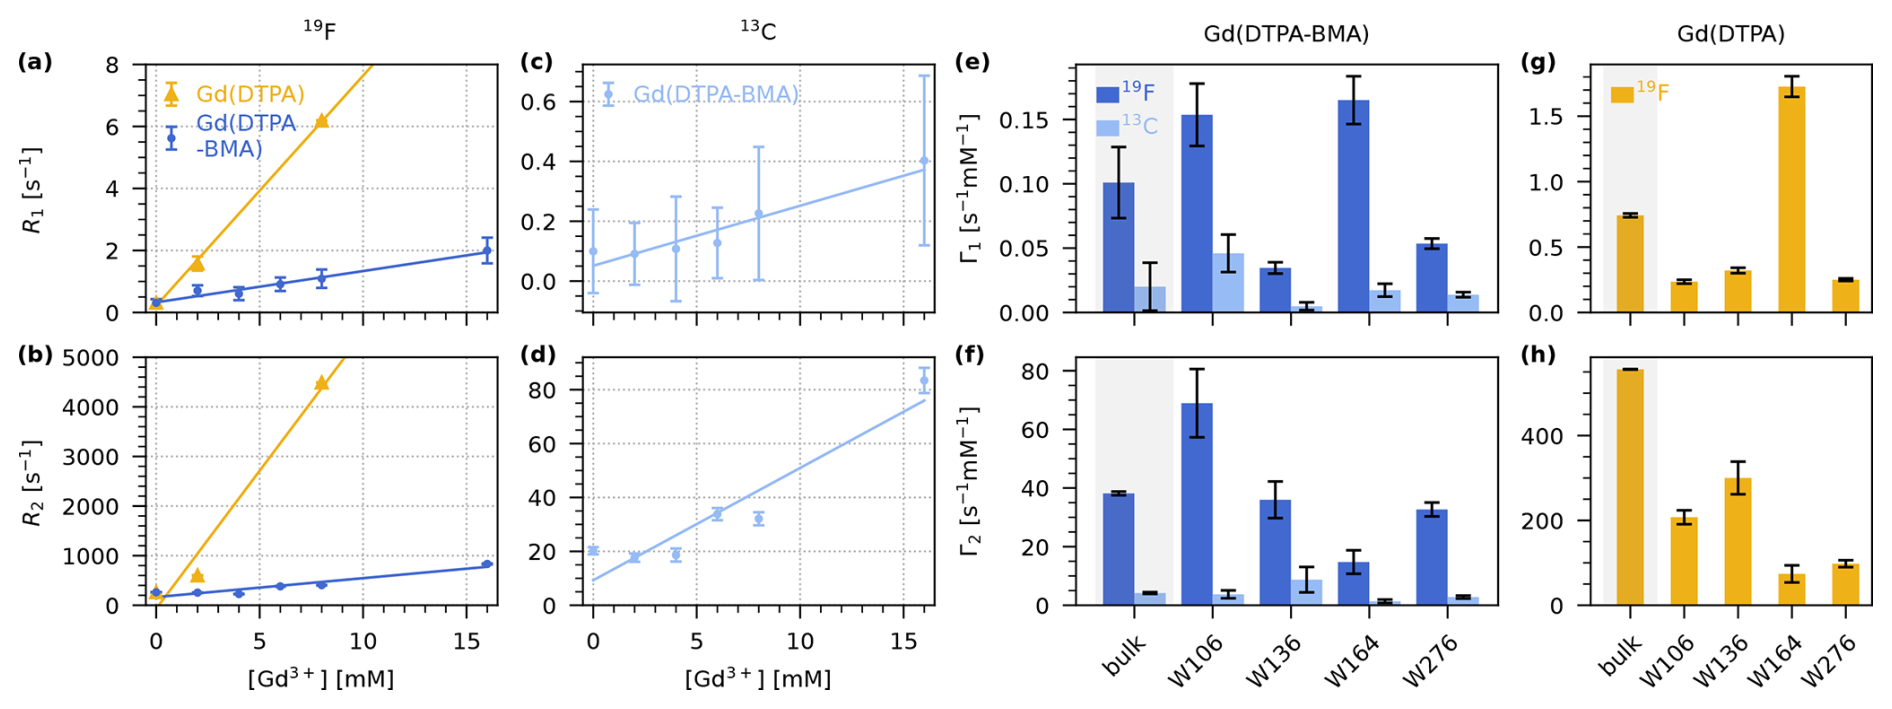
Figure 319F and 13C longitudinal and transverse PRE (Γ1 and Γ2) for Gd(DTPA-BMA) and Gd(DTPA) measured on 5FC-W-Trp. (a–b) Linear fits of bulk 19F R1 (a) and R2 (b) relaxation rate constants as a function of the concentration of Gd(DTPA-BMA) (blue) and Gd(DTPA) (yellow). (c–d) Linear fits of bulk 13C R1 (c) and R2 (d) relaxation rate constants as a function of the concentration of Gd(DTPA-BMA) (light blue). (e–f) 19F (dark blue) and 13C (light blue) Γ1 (e) and Γ2 (f) for Gd(DTPA-BMA). (g–h) 19F Γ1 (g) and Γ2 (h) for Gd(DTPA). The bulk relaxation rate constants in (a)–(d) are the average over the four residues (see Figs. S1, S2, S3, S4, S5) except for the rate at 8 mM Gd(DTPA), which was only measured as a bulk rate due to line broadening. In (e)–(h), the first bar of each plot is the bulk PRE resulting from the fits in (a)–(d) (grey background), followed by the individual values for each residue resulting from the fits in Figs. S1, S2, S3, S4, S5. Note that the per-residue fits for Gd(DTPA) (g, h) are performed with only two points (0 and 2 mM), while the bulk fit is performed with three points (0, 2, and 8 mM). This leads to a deviation between Γbulk and the average over the residue-wise values.
As expected, both Γ1 and Γ2 are smaller for 13C than for 19F. This is due to the smaller gyromagnetic ratio of the carbon nucleus (Eq. 1).
Interestingly, the measured 19F PREs for Gd(DTPA) are much higher than for Gd(DTPA-BMA). The bulk effect of Gd(DTPA) on R1 () is roughly seven times stronger than the effect of Gd(DTPA-BMA) (). For Γ2, the difference is even bigger: The bulk value for Gd(DTPA) () is over 14 times higher than the value for Gd(DTPA-BMA) (). The differences in relaxation behaviour are likely the result of the specific physicochemical properties of the two compounds (e.g. the slower water exchange rate of Gd(DTPA-BMA)) (Caravan et al., 1999).
We find that in our case, paramagnetic doping with 8 mM Gd(DTPA-BMA) is the best compromise between a significant reduction of 19F T1 without heavily compromising T2 and therefore spectral resolution. The decrease in bulk T1 from 3.2±1.3 s at 0 mM to 0.92±0.25 s at 8 mM Gd(DTPA-BMA) translates to a reduction of from 4.0±1.6 to 1.2±0.4 s. The more than 3-fold shorter recycle delay significantly reduces the measurement times of 19F MAS NMR spectra, or, in other words, increases the SNR per unit time. Although the same effect could be achieved with lower concentrations of Gd(DTPA), we prefer the use of Gd(DTPA-BMA) due to a potential interaction of Gd(DTPA) with the protein in our case (see above). Figure 4 shows a comparison of the 19F spectra of 5FC-W-TET with and without dopant (13C spectra are shown in Fig. S9).
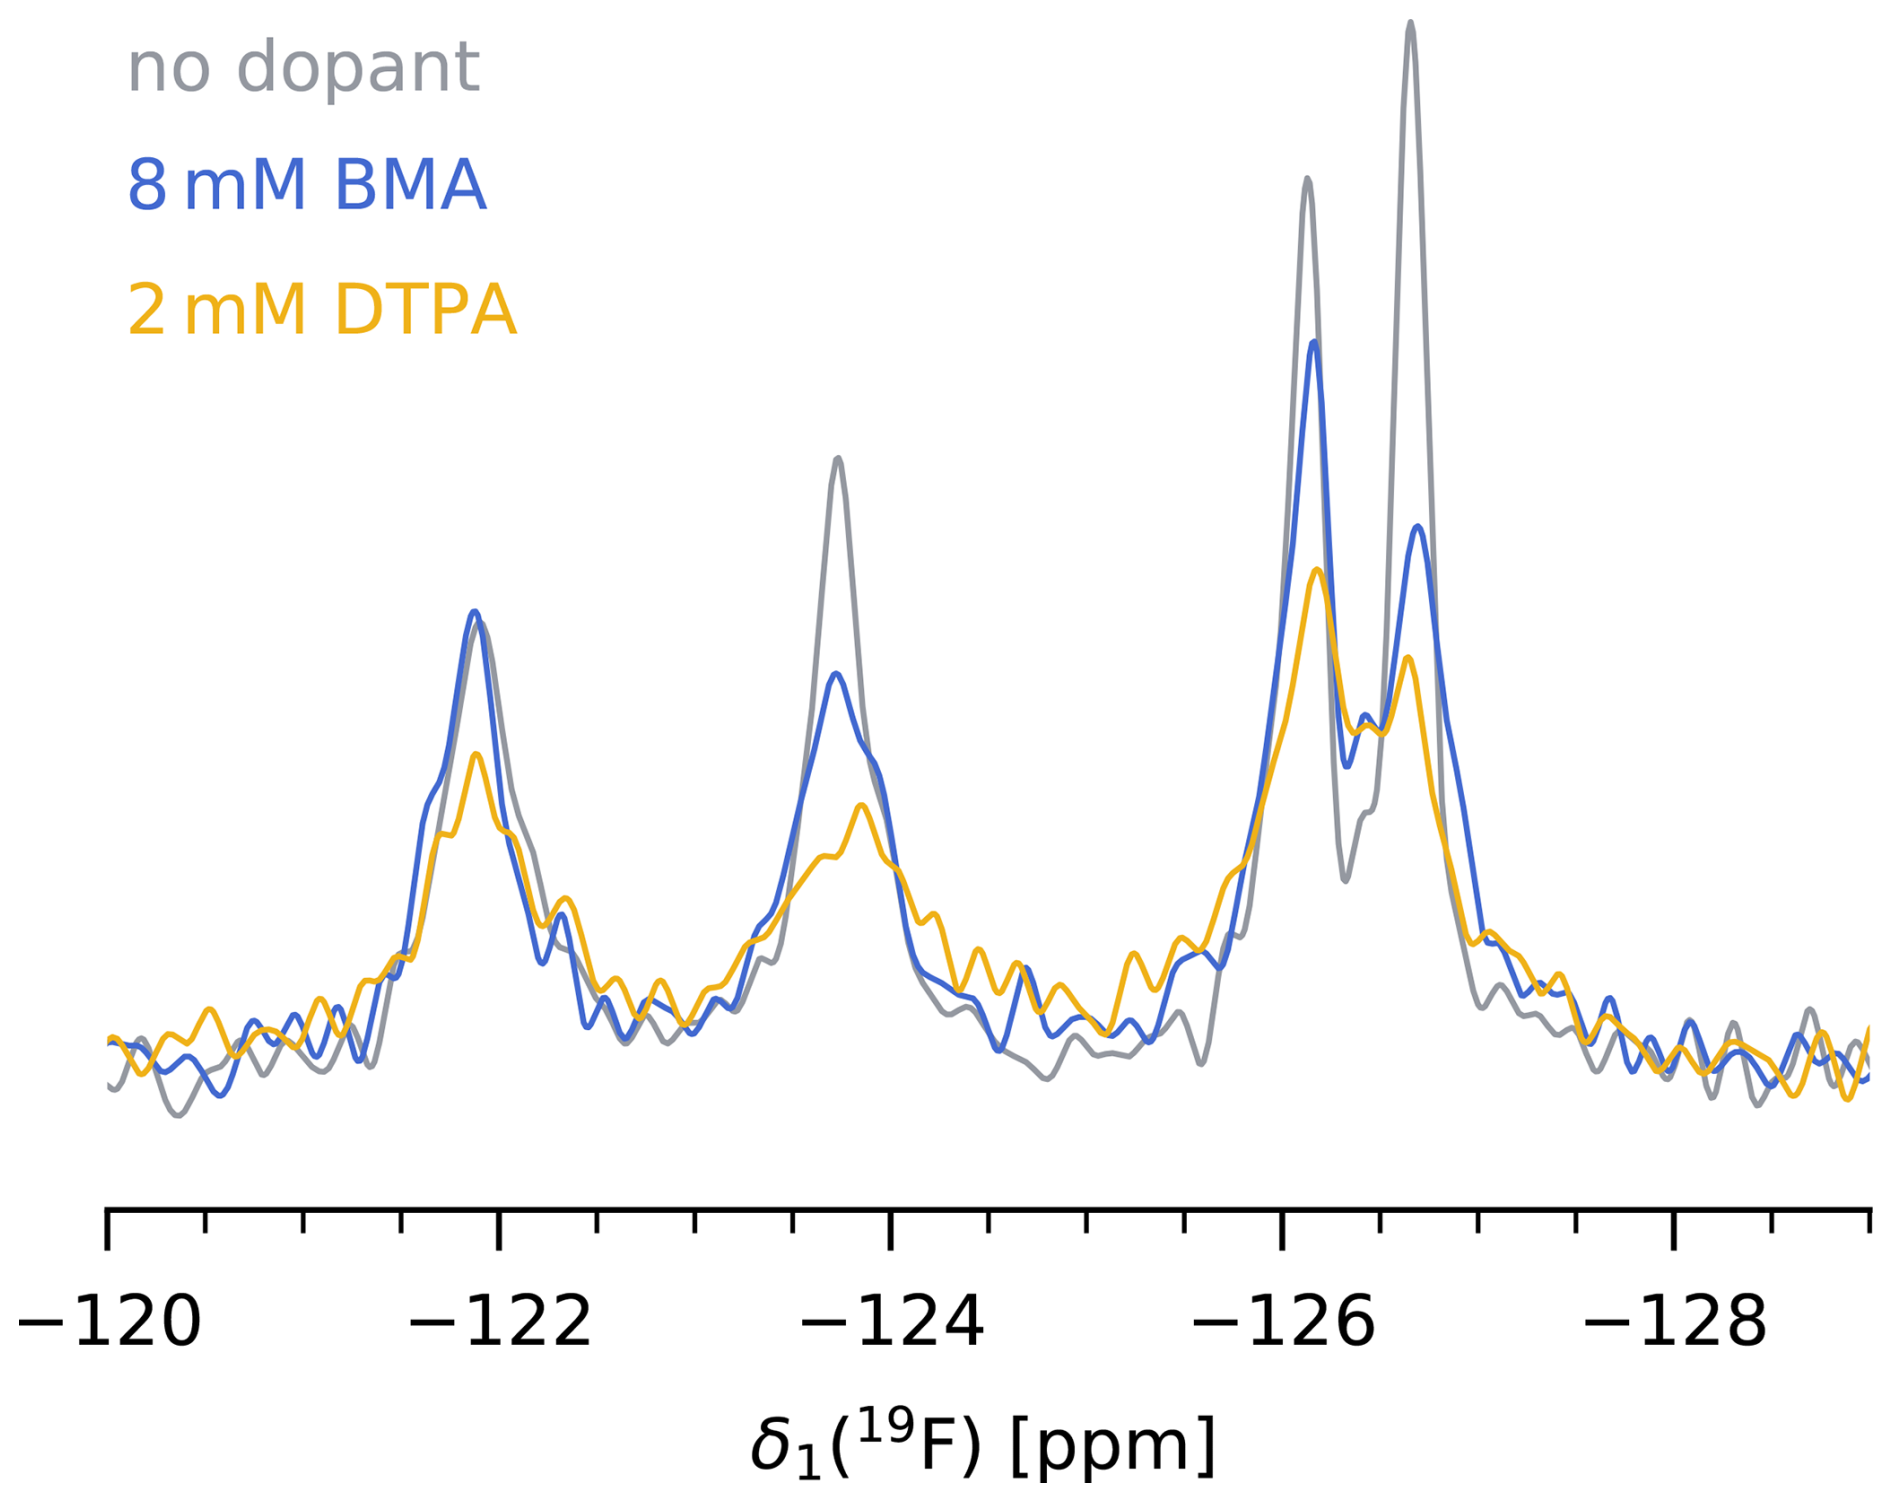
Figure 419F MAS NMR spectrum of 5FC-W-TET without dopant (grey), with 8 mM Gd(DTPA-BMA) (blue), and with 2 mM Gd(DTPA) (yellow). was set to five times the 19F T1 of the slowest relaxing peak for each sample. Note that the absolute intensities between samples are not comparable, as the amount of protein inside the rotor is hard to determine.
3.3 The relative PREs of individual tryptophan residues
The observed PREs for the individual tryptophans differ (Fig. 3e–h), which can be expected as they are impacted by a multitude of factors, such as the solvent accessibility of the residue, its dynamics, or the density of surrounding protons (Tang et al., 2011; Wickramasinghe et al., 2009). The influences of these factors can conversely even be used to characterise the surfaces and interaction interfaces of proteins with so-called solvent PREs (Pintacuda and Otting, 2002; Öster et al., 2017; Hocking et al., 2013).
To rationalise the observed PRE data for the four Trp sites, we compared them to structural parameters. We reasoned that the relaxation properties may be impacted by the 1H spins surrounding each of the 19F Trp sites and calculated the root-sum-square dipolar coupling drss (Fig. S10a). This parameter approximates the effective dipolar coupling network and can serve as an indicator for spin diffusion, which influences the propagation of the PRE effect throughout the protein. It was calculated as the square root of the sum of squared dipolar couplings between a fluorine and all back-exchangeable protons (Zorin et al., 2006). Moreover, we calculated the solvent accessible surface area (SASA) of each tryptophan (Fig. S10b), which is an approximate measure of the shortest distance between the paramagnetic compound and a given 19F atom. In our case, we did not find a direct correlation of these parameters with the observed PREs (Fig. S10c–d).
Interestingly, the PRE patterns (relative strength of the measured PREs for the four residues) are different for different relaxation rate constants (Γ1 and Γ2), different compounds, and different nuclei (19F and 13C) (Fig. 3e–h). In addition to the factors mentioned above, other influencing parameters that could explain these different patterns include a lower spin diffusion efficiency for 13C, specific binding of the Gd3+ complex to the protein, and properties of the compound, such as the rotational correlation time τc or the water exchange rate.
Differences between the patterns observed for Gd(DTPA-BMA) and Gd(DTPA) could be due to the specific binding of one of the complexes to the protein. A decrease in the distance r between the compound and residues close to the binding site would increase the observed PRE effects as both Γ1 and Γ2 are proportional to r−6 (Eq. 1). The binding would also decrease the τc of the compound, which could, in combination with the dynamics of a specific tryptophan, lead to dampening or acceleration of the PRE.
The most striking observation is that the 19F Γ1 of W164 is very high relative to the other residues compared to 19F Γ2 for both Gd3+ complexes. Such a difference between the longitudinal and transverse PRE can also be a result of a local reduction of τc due to binding. As Γ1 and Γ2 sample the spectral density at different frequencies, their reaction to changes of τc is not the same (Eq. 1) (Jaroniec, 2012). The complex interplay of diverse parameters makes it difficult to understand these patterns in detail.
The potential of biomolecular 19F MAS NMR is often limited by long T1 relaxation times that require recycle delays of several seconds. In this work, we discussed the application of paramagnetic doping with Gd3+ complexes to accelerate these experiments. Previously, paramagnetic doping with different compounds was used to reduce the 1H T1 in a variety of sample types, such as membrane proteins and protein microcrystals (Wickramasinghe et al., 2007, 2009; Linser et al., 2007; Ullrich et al., 2014). To our knowledge, this is the first study applying paramagnetic doping for MAS NMR to fluorine-labelled biological samples.
We evaluated the effect of two different Gd3+ complexes – Gd(DTPA-BMA) and Gd(DTPA) – on the 19F T1 and T2, and 13C T1 and T2 relaxation times in deuterated and 5-fluorotryptophan-labelled TET2. The addition of 8 mM Gd(DTPA-BMA) reduces by a factor of more than 3 compared to the undoped sample, without causing significant line broadening. The addition of Gd(DTPA) results in a stronger paramagnetic relaxation enhancement, but it is a less favourable compound due to its interaction with the protein.
We anticipate that the use of paramagnetic doping for biomolecular 19F MAS NMR can be applied to a variety of systems, experiments, and different types of sample preparations. The increase in sensitivity will be especially beneficial for structural studies and the measurement of anisotropic spin interactions. As for paramagnetic doping of non-fluorine-labelled samples, the optimal concentration and compound are likely to depend on the specific experimental setup.
NMR spectra, analysis scripts, and raw data are publicly available at the Institute of Science and Technology Austria (ISTA) research explorer (https://doi.org/10.15479/AT-ISTA-21284; Becker and Schanda, 2026).
The supplement related to this article is available online at https://doi.org/10.5194/mr-7-29-2026-supplement.
PS and LMB designed the project. GT synthesised the 5FC-anthranilic acid. AK, RS, and UG prepared proteins. LMB prepared samples, performed solid-state NMR experiments, analysed data, and prepared figures. LMB, PS, and GT wrote the paper. All authors discussed and commented on the paper.
At least one of the (co-)authors is a member of the editorial board of Magnetic Resonance. The peer-review process was guided by an independent editor, and the authors also have no other competing interests to declare.
Publisher's note: Copernicus Publications remains neutral with regard to jurisdictional claims made in the text, published maps, institutional affiliations, or any other geographical representation in this paper. The authors bear the ultimate responsibility for providing appropriate place names. Views expressed in the text are those of the authors and do not necessarily reflect the views of the publisher.
We thank Ben P. Tatman for insightful discussions. This research was supported by the Scientific Service Units (SSUs) of ISTA through resources provided by the Nuclear Magnetic Resonance Facility and the Lab Support Facility. We thank Prof. Tobias Madl (Medical University Graz) for a sample of Omniscan.
Lea M. Becker is the recipient of a DOC fellowship of the Austrian Academy of Sciences at the Institute of Science and Technology Austria (grant no. PR10660EAW01).
This paper was edited by Thomas Wiegand and reviewed by Gottfried Otting, Lauriane Lecoq, and one anonymous referee.
Becker, L. M. and Schanda, P.: Research data for `Accelerated 19F biomolecular magic-angle spinning NMR with paramagnetic dopants', Institute of Science and Technology Austria [data set], https://doi.org/10.15479/AT-ISTA-21284, 2026. a
Bertini, I., Luchinat, C., and Giacomo, P. (Eds.): Solution NMR of Paramagnetic Molecules: Applications to Metallobiomolecules and Models, vol. 2 of Curr. Methods Inorg. Chem., Elsevier, ISBN 978-0-444-20529-2, 2001. a
Bloembergen, N. and Morgan, L. O.: Proton relaxation times in paramagnetic solutions. Effects of electron spin relaxation, J. Chem. Phys., 34, 842–850, https://doi.org/10.1063/1.1731684, 1961. a
Boeszoermenyi, A., Chhabra, S., Dubey, A., Radeva, D. L., Burdzhiev, N. T., Chanev, C. D., Petrov, O. I., Gelev, V. M., Zhang, M., Anklin, C., Kovacs, H., Wagner, G., Kuprov, I., Takeuchi, K., and Arthanari, H.: Aromatic 19F-13C TROSY: a background-free approach to probe biomolecular structure, function, and dynamics, Nat. Methods, 16, 333–340, https://doi.org/10.1038/s41592-019-0334-x, 2019. a
Bondarenko, V., Wells, M. M., Chen, Q., Singewald, K. C., Saxena, S., Xu, Y., and Tang, P.: 19F Paramagnetic Relaxation-Based NMR for Quaternary Structural Restraints of Ion Channels, ACS Chem. Biol., 14, 2160–2165, https://doi.org/10.1021/acschembio.9b00692, 2019. a
Borissenko, L. and Groll, M.: Crystal structure of TET protease reveals complementary protein degradation pathways in prokaryotes, J. Mol. Biol., 346, 1207–1219, https://doi.org/10.1016/j.jmb.2004.12.056, 2005. a
Caravan, P., Ellison, J. J., McMurry, T. J., and Lauffer, R. B.: Gadolinium(III) chelates as MRI contrast agents: Structure, dynamics, and applications, Chem. Rev., 99, 2293–2352, https://doi.org/10.1021/cr980440x, 1999. a
Duan, P., Dregni, A. J., and Hong, M.: Solid-State NMR 19F-1H-15N Correlation Experiments for Resonance Assignment and Distance Measurements of Multifluorinated Proteins, J. Phys. Chem. A, 126, 7021–7032, https://doi.org/10.1021/acs.jpca.2c05154, 2022. a, b, c
Gauto, D. F., Estrozi, L. F., Schwieters, C. D., Effantin, G., Macek, P., Sounier, R., Sivertsen, A. C., Schmidt, E., Kerfah, R., Mas, G., Colletier, J. P., Güntert, P., Favier, A., Schoehn, G., Schanda, P., and Boisbouvier, J.: Integrated NMR and cryo-EM atomic-resolution structure determination of a half-megadalton enzyme complex, Nat. Commun., 10, 2697, https://doi.org/10.1038/s41467-019-10490-9, 2019a. a
Gauto, D. F., Macek, P., Barducci, A., Fraga, H., Hessel, A., Terauchi, T., Gajan, D., Miyanoiri, Y., Boisbouvier, J., Lichtenecker, R., Kainosho, M., and Schanda, P.: Aromatic Ring Dynamics, Thermal Activation, and Transient Conformations of a 468 kDa Enzyme by Specific 1H-13C Labeling and Fast Magic-Angle Spinning NMR, J. Am. Chem. Soc., 141, 11183–11195, https://doi.org/10.1021/jacs.9b04219, 2019b. a
Gauto, D. F., Macek, P., Malinverni, D., Fraga, H., Paloni, M., Sučec, I., Hessel, A., Bustamante, J. P., Barducci, A., and Schanda, P.: Functional control of a 0.5 MDa TET aminopeptidase by a flexible loop revealed by MAS NMR, Nat. Commun., 13, 1927, https://doi.org/10.1038/s41467-022-29423-0, 2022. a
Goddard, T. D. and Kneller, D. G.: SPARKY 3, University of California, San Francisco, https://www.cgl.ucsf.edu/home/sparky/ (last access: 5 February 2024), 2008. a
Gronenborn, A. M.: Small, but powerful and attractive: 19F in biomolecular NMR, Structure, 30, 6–14, https://doi.org/10.1016/j.str.2021.09.009, 2022. a
Heller, G. T., Shukla, V. K., Figueiredo, A. M., and Hansen, D. F.: Picosecond Dynamics of a Small Molecule in Its Bound State with an Intrinsically Disordered Protein, J. Am. Chem. Soc., 146, 2319–2324, https://doi.org/10.1021/jacs.3c11614, 2024. a
Helmus, J. J. and Jaroniec, C. P.: Nmrglue: An open source Python package for the analysis of multidimensional NMR data, J. Biomol. NMR, 55, 355–367, https://doi.org/10.1007/s10858-013-9718-x, 2013. a
Hocking, H. G., Zangger, K., and Madl, T.: Studying the structure and dynamics of biomolecules by using soluble paramagnetic probes, Chem. Phys. Chem., 14, 3082–3094, https://doi.org/10.1002/cphc.201300219, 2013. a
Huang, Y., Wang, X., Lv, G., Razavi, A. M., Huysmans, G. H., Weinstein, H., Bracken, C., Eliezer, D., and Boudker, O.: Use of paramagnetic 19F NMR to monitor domain movement in a glutamate transporter homolog, Nat. Chem. Biol., 16, 1006–1012, https://doi.org/10.1038/s41589-020-0561-6, 2020. a
Jaroniec, C. P.: Solid-state nuclear magnetic resonance structural studies of proteins using paramagnetic probes, Solid State Nucl. Magn. Reson., 43-44, 1–13, https://doi.org/10.1016/j.ssnmr.2012.02.007, 2012. a
Juen, F., Glänzer, D., Plangger, R., Kugler, V., Fleischmann, J., Stefan, E., Case, D. A., Kovacs, H., Dayie, T. K., and Kreutz, C.: Enhanced TROSY Effect in [2-19F, 2-13C] Adenosine and ATP Analogs Facilitates NMR Spectroscopy of Very Large Biological RNAs in Solution, Angew. Chem. Int. Ed., 63, e202316273, https://doi.org/10.1002/anie.202316273, 2024. a
Karschin, N., Krenek, S., Heyer, D., and Griesinger, C.: Extension and improvement of the methanol-d4 NMR thermometer calibration, Magn. Reson. Chem., 60, 203–209, https://doi.org/10.1002/mrc.5216, 2022. a
Konig, S. H.: A classical description of relaxation of interacting pairs of unlike spins: Extension to T1ρ, T2, and T1ρoff, including contact interactions, J. Magn. Reson., 47, 441–453, https://doi.org/10.1016/0022-2364(82)90211-6, 1982. a
Linser, R., Chevelkov, V., Diehl, A., and Reif, B.: Sensitivity enhancement using paramagnetic relaxation in MAS solid-state NMR of perdeuterated proteins, J. Magn. Reson., 189, 209–216, https://doi.org/10.1016/j.jmr.2007.09.007, 2007. a, b
Lu, X., Lu, X., Tsutsumi, Y., Huang, C., Xu, W., Byrn, S. R., Templeton, A. C., Buevich, A. V., Amoureux, J. P., Amoureux, J. P., Amoureux, J. P., Su, Y., Su, Y., and Su, Y.: Molecular packing of pharmaceuticals analyzed with paramagnetic relaxation enhancement and ultrafast magic angle pinning NMR, Phys. Chem. Chem. Phys., 22, 13160–13170, https://doi.org/10.1039/d0cp02049d, 2020. a, b
Luck, L. A., Vance, J. E., O'Connell, T. M., and London, R. E.: 19F NMR relaxation studies on 5-fluorotryptophan- and tetradeutero-5-fluorotryptophan-labeled E. coli Glucose/Galactose Receptor, J. Biomol. NMR, 7, 261–272, https://doi.org/10.1007/BF00200428, 1996. a
Matei, E. and Gronenborn, A. M.: 19F Paramagnetic Relaxation Enhancement: A Valuable Tool for Distance Measurements in Proteins, Angew. Chem. Int. Ed., 55, 150–154, https://doi.org/10.1002/anie.201508464, 2016. a
Mroue, K. H., Zhang, R., Zhu, P., McNerny, E., Kohn, D. H., Morris, M. D., and Ramamoorthy, A.: Acceleration of natural-abundance solid-state MAS NMR measurements on bone by paramagnetic relaxation from gadolinium-DTPA, J. Magn. Reson., 244, 90–97, https://doi.org/10.1016/j.jmr.2014.04.020, 2014. a
Öster, C., Kosol, S., Hartlmüller, C., Lamley, J. M., Iuga, D., Oss, A., Org, M. L., Vanatalu, K., Samoson, A., Madl, T., and Lewandowski, J. R.: Characterization of Protein-Protein Interfaces in Large Complexes by Solid-State NMR Solvent Paramagnetic Relaxation Enhancements, J. Am. Chem. Soc., 139, 12165–12174, https://doi.org/10.1021/jacs.7b03875, 2017. a
Öster, C., Kosol, S., and Lewandowski, J. R.: Quantifying Microsecond Exchange in Large Protein Complexes with Accelerated Relaxation Dispersion Experiments in the Solid State, Sci. Rep., 9, 11082, https://doi.org/10.1038/s41598-019-47507-8, 2019. a
Overbeck, J. H., Kremer, W., and Sprangers, R.: A suite of 19F based relaxation dispersion experiments to assess biomolecular motions, J. Biomol. NMR, 74, 753–766, https://doi.org/10.1007/s10858-020-00348-4, 2020. a
Petros, A. M., Mueller, L., and Kopple, K. D.: NMR Identification of Protein Surfaces Using Paramagnetic Probes, Biochemistry, 29, 10041–10048, https://doi.org/10.1021/bi00495a005, 1990. a
Pintacuda, G. and Otting, G.: Identification of protein surfaces by NMR measurements with a paramagnetic Gd(III) chelate, J. Am. Chem. Soc., 124, 372–373, https://doi.org/10.1021/ja016985h, 2002. a
Porat-Dahlerbruch, G., Struppe, J., Quinn, C. M., Gronenborn, A. M., and Polenova, T.: Determination of accurate 19F chemical shift tensors with R-symmetry recoupling at high MAS frequencies (60–100 kHz), J. Magn. Reson., 340, 107227, https://doi.org/10.1016/j.jmr.2022.107227, 2022. a, b, c
Roos, M., Wang, T., Shcherbakov, A. A., and Hong, M.: Fast Magic-Angle-Spinning 19F Spin Exchange NMR for Determining Nanometer 19F-19F Distances in Proteins and Pharmaceutical Compounds, J. Phys. Chem. B, 122, 2900–2911, https://doi.org/10.1021/acs.jpcb.8b00310, 2018. a, b, c
Schanda, P.: Fast-pulsing longitudinal relaxation optimized techniques: Enriching the toolbox of fast biomolecular NMR spectroscopy, Progr. Nucl. Magn. Reson. Spectrosc., 55, 238–265, https://doi.org/10.1016/j.pnmrs.2009.05.002, 2009. a
Sengupta, I.: Insights into the Structure and Dynamics of Proteins from 19F Solution NMR Spectroscopy, Biochemistry, 63, 2958–2968, https://doi.org/10.1021/acs.biochem.4c00534, 2024. a
Shaka, A. J., Keeler, J., Frenkiel, T., and Freeman, R.: An improved sequence for broadband decoupling: WALTZ-16, J. Magn. Reson., 52, 335–338, https://doi.org/10.1016/0022-2364(83)90207-X, 1983. a
Shcherbakov, A. A., Mandala, V. S., and Hong, M.: High-Sensitivity Detection of Nanometer 1H-19F Distances for Protein Structure Determination by 1H-Detected Fast MAS NMR, J. Phys. Chem. B, 123, 4387–4391, https://doi.org/10.1021/acs.jpcb.9b03812, 2019. a, b
Shcherbakov, A. A., Hisao, G., Mandala, V. S., Thomas, N. E., Soltani, M., Salter, E. A., Davis, J. H., Henzler-Wildman, K. A., and Hong, M.: Structure and dynamics of the drug-bound bacterial transporter EmrE in lipid bilayers, Nat. Commun., 12, 1–13, https://doi.org/10.1038/s41467-020-20468-7, 2021. a, b
Shi, P., Li, D., Li, J., Chen, H., Wu, F., Xiong, Y., and Tian, C.: Application of site-specific 19F paramagnetic relaxation enhancement to distinguish two different conformations of a multidomain protein, J. Phys. Chem. Lett., 3, 34–37, https://doi.org/10.1021/jz201480g, 2012. a
Solomon, I.: Relaxation processes in a system of two spins, Phys. Rev., 99, 559–565, https://doi.org/10.1103/PhysRev.99.559, 1955. a
Suleiman, M., Frere, G. A., Törner, R., Tabunar, L., Bhole, G. V., Taverner, K., Tsuchimura, N., Pichugin, D., Lichtenecker, R. J., Vozny, O., Gunning, P., Arthanari, H., Sljoka, A., and Prosser, R. S.: Characterization of conformational states of the homodimeric enzyme fluoroacetate dehalogenase by 19F-13C two-dimensional NMR, RSC Chem. Biol., 5, 1214–1218, https://doi.org/10.1039/d4cb00176a, 2024. a, b
Tang, M., Berthold, D. A., and Rienstra, C. M.: Solid-state NMR of a large membrane protein by paramagnetic relaxation enhancement, J. Phys. Chem. Lett., 2, 1836–1841, https://doi.org/10.1021/jz200768r, 2011. a
Thakur, R. S., Kurur, N. D., and Madhu, P. K.: Swept-frequency two-pulse phase modulation for heteronuclear dipolar decoupling in solid-state NMR, Chem. Phys. Lett., 426, 459–4, https://doi.org/10.1016/j.cplett.2006.06.007, 2006. a
Toscano, G., Holzinger, J., Nagl, B., Kontaxis, G., Kählig, H., Konrat, R., and Lichtenecker, R. J.: Decorating phenylalanine side-chains with triple labeled 13C/19F/2H isotope patterns, J. Biomol. NMR, 78, 139–147, https://doi.org/10.1007/s10858-024-00440-z, 2024a. a
Toscano, G., Rosati, M., Barbieri, L., Maier, K., Banci, L., Luchinat, E., Konrat, R., and Lichtenecker, R. J.: The synthesis of specifically isotope labelled fluorotryptophan and its use in mammalian cell-based protein expression for 19F-NMR applications, Chem. Commun., 60, 14188–14191, https://doi.org/10.1039/d4cc04789c, 2024b. a
Ullrich, S. J., Hölper, S., and Glaubitz, C.: Paramagnetic doping of a 7TM membrane protein in lipid bilayers by Gd 3+-complexes for solid-state NMR spectroscopy, J. Biomol. NMR, 58, 27–35, https://doi.org/10.1007/s10858-013-9800-4, 2014. a, b
Ulrich, A. S.: Solid state 19F NMR methods for studying biomembranes, Prog. Nucl. Magn. Reson. Spectrosc., 46, 1–21, https://doi.org/10.1016/j.pnmrs.2004.11.001, 2005. a
Wang, M., Lu, M., Fritz, M. P., Quinn, C. M., Byeon, I. J. L., Byeon, C. H., Struppe, J., Maas, W., Gronenborn, A. M., and Polenova, T.: Fast Magic-Angle Spinning 19F NMR Spectroscopy of HIV-1 Capsid Protein Assemblies, Angew. Chem. Int. Ed., 57, 16375–16379, https://doi.org/10.1002/anie.201809060, 2018. a, b, c
Wickramasinghe, N. P., Kotecha, M., Samoson, A., Past, J., and Ishii, Y.: Sensitivity enhancement in 13C solid-state NMR of protein microcrystals by use of paramagnetic metal ions for optimizing 1H T1 relaxation, J. Magn. Reson., 184, 350–356, https://doi.org/10.1016/j.jmr.2006.10.012, 2007. a, b
Wickramasinghe, N. P., Parthasarathy, S., Jones, C. R., Bhardwaj, C., Long, F., Kotecha, M., Mehboob, S., Fung, L. W., Past, J., Samoson, A., and Ishii, Y.: Nanomole-scale protein solid-state NMR by breaking intrinsic 1H T1 boundaries, Nat. Methods, 6, 215–218, https://doi.org/10.1038/nmeth.1300, 2009. a, b, c, d
Zorin, V. E., Brown, S. P., and Hodgkinson, P.: Quantification of homonuclear dipolar coupling networks from magic-angle spinning 1H NMR, Mol. Phys., 104, 293–304, https://doi.org/10.1080/00268970500351052, 2006. a